Article Text

Abstract
Objective To identify and characterise DNA methylation subtypes in oesophageal adenocarcinoma (EAC) and its precursor Barrett’s oesophagus (BE).
Design We performed genome-wide DNA methylation profiling on samples of non-dysplastic BE from cancer-free patients (n=59), EAC (n=23), normal squamous oesophagus (n=33) and normal fundus (n=9), and identified methylation subtypes using a recursively partitioned mixture model. We assessed genomic alterations for 9 BE and 22 EAC samples with massively parallel sequencing of 243 EAC-associated genes, and we conducted integrative analyses with transcriptome data to identify epigenetically repressed genes. We also carried out in vitro experiments treating EAC cell lines with 5-Aza-2'-Deoxycytidine (5-Aza-dC), short hairpin RNA knockdown and anticancer therapies.
Results We identified and validated four methylation subtypes of EAC and BE. The high methylator subtype (HM) of EAC had the greatest number of activating events in ERBB2 (p<0.05, Student’s t-test) and the highest global mutation load (p<0.05, Fisher’s exact test). PTPN13 was silenced by aberrant methylation in the HM subtype preferentially and in 57% of EACs overall. In EAC cell lines, 5-Aza-dC treatment restored PTPN13 expression and significantly decreased its promoter methylation in HM cell lines (p<0.05, Welch’s t-test). Inhibition of PTPN13 expression in the SK-GT-4 EAC cell line promoted proliferation, colony formation and migration, and increased phosphorylation in ERBB2/EGFR/Src kinase pathways. Finally, EAC cell lines showed subtype-specific responses to topotecan, SN-38 and palbociclib treatment.
Conclusions We identified and characterised methylator subtypes in BE and EAC. We further demonstrated the biological and clinical relevance of EAC methylator subtypes, which may ultimately help guide clinical management of patients with EAC.
- dysplasia
- gastrointestinal cancer
- methylation
Statistics from Altmetric.com
Significance of this study
What is already known on this subject?
The incidence of oesophageal adenocarcinoma (EAC) is among the fastest rising of any cancer, and when discovered it is often already at an advanced stage and is often not responsive to currently used therapies.
Thus, there is a need for more effective identification of optimal treatment strategies for patients with EAC.
Genetic and epigenetic alterations in EAC hold promise to more accurately select therapy for patients with EAC and possibly Barrett’s oesophagus (BE).
Significant advances in our understanding of these molecular alterations have been made recently.
The characterisation of interlesional molecular heterogeneity seen in EAC and BE and its implications for understanding the biology and clinical care of EAC and BE is an active area of investigation.
What are the new findings?
We found four distinct subtypes in both BE and EAC based on DNA methylation profiles.
Our molecular characterisation of DNA methylation subtypes in EAC found an increased frequency of genomic alterations in the EGFR/ERBB2 genes in high methylator and intermediate methylator (HM/IM) subtypes.
PTPN13, a gene encoding a non-receptor-type tyrosine phosphatase, was identified out of a subtype-specific analysis of methylomes and transcriptomes of EAC.
PTPN13 expression is silenced by aberrant methylation in a subset of HM EAC and may function as a tumour suppressor gene by regulating oncogenic ERBB2/EGFR signalling.
We found subtype-specific responses to topoisomerase 1 inhibitors, topotecan and SN-38, as well as to palbociclib, a targeted inhibitor of CDK4/6, in in vitro EAC studies.
How might it impact on clinical practice in the foreseeable future?
The discovery of molecular subtypes based on DNA methylation may provide insight into the molecular heterogeneity of BE and EAC and the functional role of epigenetic alterations in EAC tumourigenesis.
Our study in EAC cell lines reveals that the methylation subtypes have distinct susceptibilities to conventional and targeted therapies, which, if validated in clinical studies, may be used to improve precision medicine of patients with EAC in the future.
Introduction
Oesophageal adenocarcinoma (EAC) is a significant cause of cancer-related mortality in the USA with a dismal 15% 5-year survival rate.1 Of additional concern is that the incidence-based mortality rate for EAC has increased dramatically over the last three decades.2 Thus, there is a substantial need to advance our understanding of the molecular pathology of EAC and to use this understanding to improve our ability to prevent and manage EAC.
It is well established that virtually all EAC arises from Barrett’s oesophagus (BE), which is a premalignant condition characterised by intestinal metaplasia of the distal oesophagus believed to arise secondary to chronic gastro-oesophageal reflux.3 Studies over the last half century have refined our understanding of the BE→EAC sequence and shown it to be a multistep process that involves the progression of non-dysplastic Barrett’s oesophagus (NDBE, or BE) to low-grade dysplasia, high-grade dysplasia and then EAC.4 A primary mechanism driving this sequence is the accumulation of genetic and epigenetic alterations. Recent studies of the genome of BE and EAC have revealed that mutations in multiple genes, including TP53, CDKN2A, SMAD4, ERBB2, PIK3CA and ELMO1, are common in EAC and also present in BE, although at a lower frequency than seen in EAC.5–9 Of particular note, TP53 mutations appear to play a role in BE progression presumably by affecting genomic stability.10–12 Furthermore, Stachler et al 11 identified two molecular classes of EAC that differ by the presence of whole genome doubling and mutation patterns. More recently, Secrier et al 13 showed three distinct molecular subtypes of EAC based on mutational signatures. These studies demonstrate that there is interlesional molecular heterogeneity among EACs , as has been shown for other cancers including colorectal, breast and brain (gliomas).14–16
In addition to genetic alterations, epigenetic alterations have been found to be common in BE and EAC. CpG island DNA methylation in promoter regions, a specific type of epigenetic modification, can lead to the silencing of a subset of tumour suppressor genes and presumably drive cancer formation.17 The majority of studies published to date on DNA methylation in BE and EAC have been limited to the assessment of small panels of candidate genes, but have established that aberrantly methylated genes are present in both BE andEAC and that they may contribute to the initiation and progression of BE→EAC.18–22 More recent studies have used HumanMethylation27 and HumanMethylation450 (HM450) arrays to identify global methylation alterations in BE and EAC, but these studies have typically lacked validation cohorts.20 23 24 A recently published paper by The Cancer Genome Atlas (TCGA) found molecular features such as DNA hypermethylation in oesophageal carcinoma, including EAC.25 However, whether such DNA methylation features exist in BE and whether methylation-based subtypes of EAC and BE exist require further study at this time.
Thus, to determine if there are molecular subtypes of BE and EAC based on DNA methylation patterns, we performed genome-wide DNA methylation profiling using HM450 arrays in 59 BE, 23 EAC, 33 normal squamous (SQ) and 9 fundus samples. We identified four distinct methylation subtypes. We assessed genomic alterations and integrated methylome and transcriptome data to characterise the methylation subtypes. Using primary EAC tissue samples and EAC cell lines, we assessed whether methylation-based subtyping in EAC could provide novel insights into the functional role of epigenetic alterations and could potentially be helpful to guide treatment decisions for EAC.
Materials and methods
The online supplementary methods contain details on experiment design, methods, reagents and analysis.
Supplemental material
Primary tissue sample collection
All primary EAC samples were obtained from the University Hospitals Cleveland Medical Center (Cleveland, Ohio) following Institutional Review Board approval. Fresh frozen normal oesophagus tissues (n=7) were obtained from GICaRes Biorepository (University of Washington Department of Medicine; Division of Gastroenterology) following Institutional Review Board approval. Formalin fixed paraffin-embedded (FFPE) slides and cores from a total of 33 normal SQ from patients with BE, 9 fundus from patients with EAC, 59 NDBE samples from cancer-free patients and 23 EAC samples, as well as an independent set of 16 fresh frozen EAC biopsy samples, were obtained via the Barrett’s Esophagus Translational Research Network (BETRNet). All the FFPE BE/EAC samples were reviewed by an expert GI pathologist and were determined to be >70% BE or EAC (see online supplementary table 1 for the demographic information of BETRNet samples).
Supplemental material
EAC cell lines
The established EAC cell lines ESO26, OE33, SK-GT-4, FLO-1, OACM5.1C and OE19 were purchased from the European Collection of Authenticated Cell Cultures through Sigma Aldrich. Cells were cultured in standard conditions according to the repository’s instructions. The JH-EsoAd1 was a kind gift from Hector Alvarez.26 The cell lines were authenticated by the suppliers prior to being sent to our laboratory.
DNA preparation and HM450 array data acquisition and preprocessing
DNA extraction and bisulfite conversion were performed as described previously.27 DNA samples were processed and run on HM450 arrays following the manufacturer’s instructions (Illumina). Raw intensity data were read, preprocessed and batch corrected in R (V.3.2.2). After subsequent filtering, 426 718 probes were left for analysis. Additional HM450 array data sets include level 1 HM450 array data from 87 EAC and 11 adjacent normal tissue samples obtained from TCGA on 13 November 2015 (https://tcga-data.nci.nih.gov/tcga/), and 125 EAC samples from the Gene Expression Omnibus (study ID: GSE72872).23
Subtype identification
The most variable probes (MVPs, n=1515) were identified among BETRNet EACs. Recursive-partitioning mixture model (RPMM) clustering (RPMM R package, V.1.2.0) was performed using MVP methylation data to identify methylation subtypes.28
Targeted sequencing of BETRNet samples
Preprocessing was performed on DNA libraries using Picard tools and Burrows-Wheeler Alignment tool as described prior.29 30 Mutation analysis for single nucleotide variants was performed using MuTect V.1.1.4.31 32 We used the Somatic Indel Detector tool that is part of the GATK tools for indel calling. Selection of likely somatic non-synonymous mutations was performed as described in the online supplementary methods. Copy number variants were called, then tangent-normalised, with prior filtering of high-variance capture intervals, using the tool ReCapSeg V.1.4.4.33
Exome sequencing analysis of TCGA samples
Whole exome sequencing files were downloaded from TCGA and used as input for MutSig (http://www.broadinstitute.org/cancer/cga/mutsig) and GISTIC (www.broadinstitute.org/cancer/cga/gistic) analysis as previously described.34 35
Integrative analysis of repressed genes and pathways
Level 3 gene expression data from TCGA EAC samples were obtained from Firehose (https://confluence.broadinstitute.org/display/GDAC/Home). We applied stringent workflows to identify significant, substantial and biologically meaningful evidence of epigenetic and transcriptomic repression (online supplementary methods). For differentially regulated gene sets, we performed network analyses with PANTHER (http://www.pantherdb.org) and DAVID (https://david.ncifcrf.gov/).36 37
Quantitative methylation-specific PCR
PTPN13 quantitative methylation-specific PCR (qMS-PCR) assays were performed to validate HM450 array results in clinical samples and EAC cell lines using the C-L-less-C1 assay to control for input DNA amounts. Detailed methods including primer sequences for qMS-PCR assays and the calculation of the relative methylation of PTPN13 are provided in the online supplementary methods.
RNA extraction
RNA extraction from primary tissue samples and EAC cell lines was performed as previously described.19
Quantitative real-time PCR
The mRNA level of PTPN13 was determined by a SYBR qRT-PCR assay. A TaqMan Gene Expression Assay for GUSB expression (Applied Biosystems) was used for normalisation of cDNA loading. Detailed methods and primer sequences are provided in the online supplementary methods.
5-Aza-2’-Deoxycytidine (5-Aza-dC) treatment
OE33 and ESO26 cell lines were treated with 5-Aza-2’Deoxcytidine (5-Aza-dC) as previously described19 and described in the online supplementary methods.
Gene knockdown by small hairpin RNA transfection
pGIPz-based short hairpin RNA (shRNA) constructs specifically targeting human PTPN13 mRNA were provided by the Genomics Shared Resource Core at the Fred Hutchinson Research Center (Seattle, Washington). The lentiviral transfection was performed as described before.38 The target sequences of each PTPN13 shRNA construct were confirmed by direct sequencing and are listed in the online supplementary methods.
Cell proliferation assays
Cells were plated at a density of 1000 cells per well onto 96-well plates at day 0. Each day through day 4, CellTiter 96 AQueous Non-Radioactive Cell Proliferation Assay reagent (Promega, USA) was added and incubated at 37°C for 1 hour. Optical density was measured at 490 nm using a plate reader (Molecular Devices, Sunnyvale, California).
Colony formation assays
Cells were trypsinised into a single-cell suspension. A total of 50 and 100 cells were plated in each well of a 6-well plate and maintained for 14 days to allow colony formation. Colonies were fixed with methanol and stained with 0.01 (w/v) crystal violet. Two independent experiments were performed on each cell line.
Cell migration/invasion assay
Cell motility was measured on FlouroBlok Inserts with 8 mm pores (24 well format; Corning Incorporated, Corning, New York), and cell invasiveness was measured on the same inserts containing 100 µL of 300 µg/mL matrigel diluted in serum-free media, according to the manufacturer’s instructions. Briefly, cells (5×10⁴) were seeded onto insert membranes without and with matrigel. After incubation at 37°C for 24 hours, cells that did not migrate or invade through the pores of the FlouroBlok Inserts were manually removed. Membranes were washed, fixed and stained. Cells present at the bottom of the membrane were counted using a computer program after fluorescent images of the membranes were taken. Three independent experiments were performed on each cell line.
Western blotting
Western blotting experiments were conducted as described previously.39 Detailed information on the antibodies is provided in the online supplementary methods.
In vitro drug sensitivity assays
The in vitro drug sensitivity assays were conducted as described previously.40 The detailed methods are provided in the online supplementary methods. The following compounds were used for drug treatment: SN-38 and topotecan (Sigma Aldrich) and palbociclib (Selleckchem). The compounds were diluted to a working concentration in dimethyl sulfoxide (DMSO) (Sigma Aldrich).
Statistical analysis and data visualisation
Analyses applied R/Bioconductor, MutSig, GISTIC, PANTHER and DAVID statistical software. R/Bioconductor libraries included minfi, sva, qvalue, RPMM, ggplot2 and ComplexHeatmap. Essential scripts are available on GitHub (https://github.com/GradyLab). Binomial tests were used to assess enrichment. Correlations between multiple molecular data types (eg, promoter methylation vs gene expression) used Spearman’s tests, unless indicated otherwise. We evaluated genomic event count data using Fisher’s exact test. Benjamini-Hochberg and false discovery rate adjustment were used to adjust p values. Student’s t-test was used (1) to compare the average (mean) difference in PTPN13 methylation or gene expression, and (2) to compare proliferation and migration data between the two groups. When the two groups had unequal variances and unequal sample sizes, Welch’s t-test was used instead. Reported p values are two-sided; p<0.05 was considered significant. GraphPad Prism V.7.0 (GraphPad Software, La Jolla, California) was used to calculate the p values and EC50 values in drug sensitivity experiments.
Results
Genome-wide DNA methylation analysis of BE and EAC reveals distinct methylation subtypes
Molecular subclasses based on DNA methylation alterations have been recently identified in several cancer types, including colorectal cancer and glioma.16 41 Herein, we conducted studies to determine if DNA methylation subtypes are present in EAC and its precursor BE.
First, we applied a model-based clustering method (RPMM) to HM450 data sets from n=23 EAC samples collected through the BETRNet. RPMM is suitable for β-distributed data sets including the HM450 platform,28 and it has been used to identify molecular subtypes in cancers of the colon and the breast.41 42 We performed clustering using the 1515 most variable CpG probes (MVPs, β-value SD>0.25; online supplementary table 2). Interestingly, MVPs were significantly enriched for intragenic CpGs in both promoter (55%, p<10−15) and gene body regions (37%, p<10−6), and they were further enriched for probes in CpG islands (70%, p<10−15).
Supplemental material
Clustering using RPMM revealed four methylation subtypes among EAC samples (figure 1A), denoted as high (HM), intermediate (IM), low (LM), and minimal (MM) methylator based on the underlying MVP methylation patterns. Considering a mean β-value >0.6 as hypermethylated, HM harbours the most hypermethylated CpG probes (n=981), followed by IM (n=181), LM (n=58) and MM (n=39). To validate the subtype assignments, we also conducted multidimensional scaling (MDS) using the 1515 MVPs and found the subtype designations from RPMM were largely concordant with two-dimensional MDS clustering patterns (online supplementary figure 1).
Supplemental material
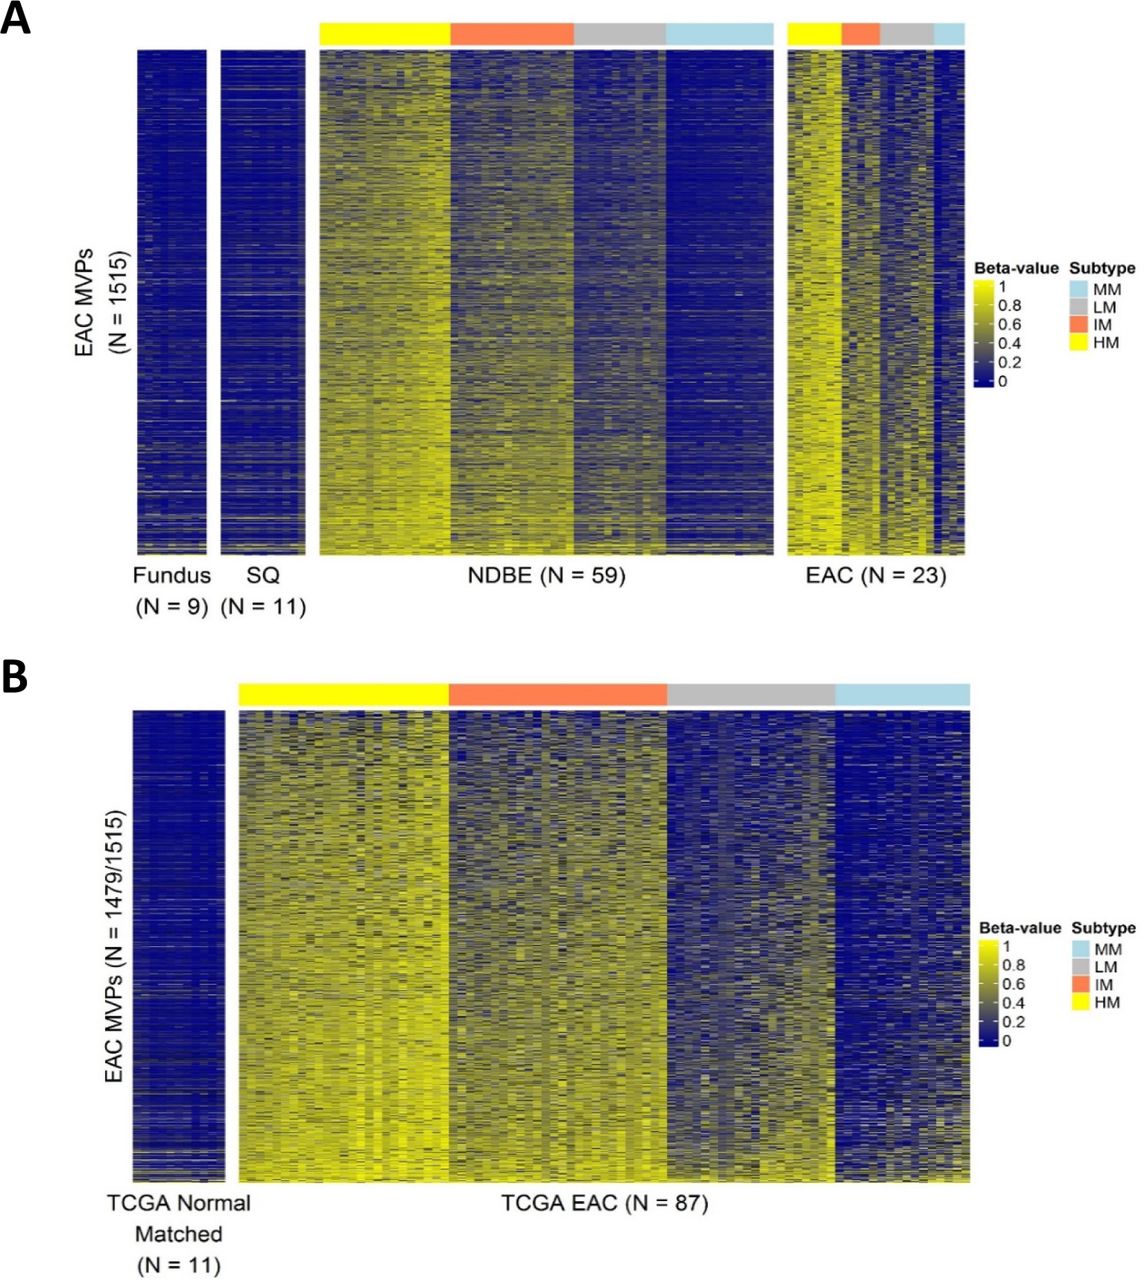
Heatmaps of methylated CpGs in EAC and BE cases show distinct clusters based on methylation patterns. The clusters were identified with recursive partition modelling using β-value methylation at the 1515 most variable CpG probes (MVPs). (A) MVP heatmap of BETRNet samples, including EACs used for MVP discovery (n=23), NDBE from cancer-free patients (n=59), a representative subset of normal SQ tissues from patients with BE (n=11) and normal fundus (n=9) from patients with EAC. (B) MVP heatmap of independent validation samples from TCGA, including EACs (n=87) and matched normal tissues (n=11). Methylation is measured as β-values from unmethylated or 0 (dark blue) to methylated or 1 (yellow). Methylation subtype annotation: high methylator (HM, yellow); intermediate methylator (IM, coral); low methylator (LM, grey) and minimal methylator (MM, blue). BE, Barrett’s oesophagus; BETRNet, Barrett’s Esophagus Translational Research Network; EAC, oesophageal adenocarcinoma; NDBE, non-dysplastic Barrett’s oesophagus; SQ, squamous; TCGA, The Cancer Genome Atlas.
Notably, the methylation pattern in MM is similar to what is observed in the normal SQ and fundus (figure 1A and online supplementary figure 2A). A review of samples by a pathologist did not find any differences in tumour cell content percentages between subtypes and the MM subtype samples did not have less tumour purity estimated by Infinium PurifyR (online supplementary methods and online supplementary figure 3). We found uniformly lower methylation levels of MVPs in normal matched tissues compared with their adjacent EACs (n=7 pairs; online supplementary figure 2B).
Supplemental material
Supplemental material
To validate our findings of methylation subtypes in EAC samples from the BETRNet cohort, we used an independent set of 87 EACs and 11 normal matched samples from TCGA (see online supplementary table 3 for TCGA EAC cohort information). Clustering analysis with the MVPs available after preprocessing (n=1479/1515) again revealed four distinct clusters corresponding to the HM, IM, LM and MM subtypes (figure 1B). Similar to the BETRNet EAC cohort, these subtypes largely reflect global hypermethylation in the HM and IM, when compared with the LM and MM subtypes (online supplementary figure 4).
Supplemental material
Supplemental material
Finally, we observed no correlation between available demographic features (age, gender or tobacco use in TCGA EACs; age or gender in BETRNet EACs) and methylation subtype membership (p>0.1, Spearman’s test). We then conducted survival analyses in independent data sets from TCGA (87 EACs) and the Gene Expression Omnibus (GSE72872, 123 EACs), but found no significant correlation either with or without adjustment for pathological stage of the tumour (p>0.1, Cox proportional hazard testing) (online supplementary figure 5).
Supplemental material
Methylation-based subtypes in BE
To investigate the presence of the methylation subtypes in BE, the known precursor of EAC, we applied RPMM-based clustering in 59 NDBE samples from cancer-free patients. Remarkably, with the same MVPs identified in EAC, we again identified four subtypes in NDBE (figure 1A and online supplementary figure 6). The number of hypermethylated MVPs (mean β-value >0.6) in the HM, IM, LM and MM subtypes was 751, 88, 37 and 32, respectively, and the MVP methylation patterns across MM BEs were similar to matched SQ and fundus (figure 1A).
Supplemental material
Somatic genomic alterations in EAC and BE methylation subtypes
In order to further characterise the EAC methylation subtypes, we assessed genomic alterations in the BETRNet EAC cohort. We used massively parallel sequencing with a targeted sequencing panel containing all exons of 243 of the most commonly altered genes in gastro-oesophageal cancer (online supplementary tables 4–5).10 11 We identified a total of 62 likely pathogenic somatic mutations in 29 candidate genes, 74 gene-level copy number gains (28 of which were considered high-level amplifications, log2 ratio >2), 335 gene-level single copy deletions and 64 gene-level multicopy deletions. We also identified frequent TP53 mutations in all of the methylation subtypes. Although the number of samples in each subtype was small, an elevated frequency of ERBB2 events (COSMIC mutations or amplifications) was found in the HM group (6/7, 86%), but only one case was found in the IM and MM subtypes (online supplementary table 5). To assess the clinical relevance of the high frequency of ERBB2 genomic alterations in the HM subtype, we assessed ERBB2 expression in a subset of the BETRNet EACs (n=18) using a standard ERBB2/HER2 immunohistochemistry assay (online supplementary methods). Although the significance of the findings is limited by the number of samples available for the ERBB2 immunohistochemistry assay, we observed the greatest frequency of increased HER2 expression in cases in the HM subtype (HM: n=2/5 or 40%; IM: 1/3 or 33%; LM: 0/6; MM: 0/2).
Supplemental material
We next assessed genomic alterations in a subset of NDBE samples (n=9) with the sequencing panel described above (online supplementary figure 7). Recognising the number of samples is limited and may impact on the interpretation of our results, we did not identify significant differences in gene alteration frequency between the methylation subtypes of the BE samples.
Supplemental material
To confirm our finding of an increased rate of ERBB2 events in the HM subtype, we used the exome sequencing data from the TCGA EAC samples. Overall likely ERBB2 activating genomic alterations (recurrent COSMIC mutations or amplifications) occurred in 7/25 (28%) of HM subtype, 8/26 (31%) of IM subtype, 1/20 (5%) of LM subtype and 2/16 (12.5%) of MM subtype (online supplementary table 6). In order to determine if a larger number of samples with expanded sequencing coverage would allow discovery of other alterations unique to a given methylation subtype, we next assessed whether there were subtype-specific events in both mutations and copy number alterations in the TCGA EAC sample set. We observed a trend for increased loss of function ARID1A mutations in the HM subtype (6/25, 24%) compared with the IM (2/26, 8%), LM (1/20, 5%) and MM (1/16, 6%) subtypes (p=0.1–0.2, Fisher’s exact test). Amplifications in CDK6 were found in 5/26 (19%) of IM samples, while only in ≤1 sample per subtype was found in all the other subtypes. High-level MDM2 amplifications were rare but found exclusively within the MM subtype (3/16, 19%).
Supplemental material
Notably, we also observed significant differences in the overall mutation loads between the EAC methylation subtypes (figure 2A). The highest overall mean mutation load was seen in the HM subtype (10.9 mut/MB), followed by the IM subtype (6.87 mut/MB). The LM (5.19 mut/MB) and MM (5.54 mut/MB) subtypes had the lowest loads (p=0.11, 0.01 and 0.03 for HM vs IM, LM and MM respectfully, Student’s t-test). Two HM samples were outliers with very high mutation loads (online supplementary figure 8). After removal of these samples, the HM subtype had a considerably lower mutation load of 7.78 mut/MB but was still significantly higher than the LM and MM subtype mutation loads (p=0.02 and 0.03, respectively, Student’s t-test). The HM subtype also had a higher proportion of mutations that were small insertions or deletions compared with the other subtypes (15.4% vs 6.0%, 7.5%, and 6.9% for IM, LM and MM, respectively; p<0.0001 HM vs any other subtype).
Supplemental material

Characterisation of methylation subtypes in EAC. (A) Mutation loads (mut/MB) calculated using MutSig, and with statistical analysis comparing HM with other subtypes (two-tailed Student’s t-test, p<0.05 is considered statistically significant). (B) BETRNet EAC sample gene alterations detected using sequencing of a panel of genes functionally important in EAC. (C) Venn diagram comparing epigenetically repressed genes across subtypes. (D) Venn diagram comparing differentially expressed miRNAs (DEmiRs) in pairwise subtype comparisons. (E) Volcano plots of miR and DEmiR expression and differential expression test result (t-test, p-unadjusted) in three subtype comparisons (HM vs IM, LM and MM, respectively). The x-axis is the difference in mean expression between subtypes (HM minus IM, LM or MM mean, respectively), while the y-axis is the −log10 (p-unadjusted) from t-tests. COSMIC, catalogue of somatic mutations in cancer; HM, high methylator; IM, intermediate methylator; LM, low methylator; MM, minimal methylator; RTK, receptor tyrosine kinase; TF, transcription factor.
In summary, looking across the BETRNet and TCGA EAC cohorts, we identified 32 HM, 31 IM, 26 LM and 20 MM samples. A combined analysis across the BETRNet and TCGA EAC cohorts demonstrated results largely consistent with what was observed in the individual data sets (table 1 and online supplementary table 7). We observed that recurrent COSMIC ERBB2 mutations were enriched in the HM subtype, with a higher number of mutated samples (6/32, 19%) compared with the IM subtype (3/31, 10%), the MM subtype (0/20) or LM subtype (0/26) (Fisher’s exact test, p=0.03 for both HM vs LM and HM vs MM). The number of ERBB2 amplified samples was significantly greater in the HM (9/32, 28%) compared to the LM subtype (1/26, 4%) (Fisher’s exact test, p=0.02). ARID1A alterations also showed a suggestive strong correlation between methylation subtype, being highest in the HM subtype (7/32, 22%), followed by the IM (3/31, 10%), LM (3/26, 11%) and MM (1/20, 5%) subtypes, respectively.
Supplemental material
Frequency of genomic alterations in selected genes across methylation subtypes in combined BETRNet and TCGA EAC cohorts
Integrative analysis of EAC subtype-specific gene and pathway repression
We analysed HM450 methylation and RNA-seq data sets from TCGA EACs to identify genes differentially regulated by promoter methylation and miRNA expression across the EAC methylation subtypes (online supplementary figure 9 and online supplementary methods).
Supplemental material
The HM EAC cases had the greatest total number (n=69 genes, Spearman’s r <0, p-adjusted <0.05) as well as subtype-specific number (n=50 genes, 72%) of epigenetically repressed genes (figure 2C, online supplementary table 8). Among these were putative tumour suppressors implicated in various cancer types, including PTPN13, TUSC1, RGS6, TIAM1 and HUNK 43–47 (online supplementary figure 10). Gene enrichment tests of HM-specific repressed genes showed enrichment of pathways important in cancer (online supplementary table 9). By contrast, using the same search criteria, we found no epigenetically repressed genes in MM cases and only three in LM cases.
Supplemental material
Supplemental material
Supplemental material
We also compared differentially expressed miRNAs and their putative target genes across methylation subtypes (figure 2D,E, online supplementary methods, online supplementary figures 11–13 and online supplementary table 10). Gene enrichment analysis of differentially expressed target genes repressed by miRNAs in HM subtypes compared with MM subtypes (binomial test, p-adjusted <0.05; online supplementary tables 11–14) revealed subtype-specific repression of cancer pathways in the HM subtype, including the WNT pathway and cell adhesion and signaling pathway(see details in the online supplementary results and methods).
Supplemental material
Supplemental material
Aberrant methylation of PTPN13 in a subset of EAC leads to its transcriptional repression
We decided to focus on one particular gene, PTPN13, to study the functional consequences of gene silencing in EAC. PTPN13 was chosen because its promoter hypermethylation was correlated with repressed gene expression predominantly in the HM and IM subtypes. PTPN13 encodes a non-receptor-type protein tyrosine phosphatase. It is a putative tumour suppressor gene in breast cancer48 and non-small cell lung cancer.49 We used qMS-PCR to assess PTPN13 methylation in the gene promoter region in an independent set of clinical samples, including normal oesophagus (n=7) and EAC (n=16). We detected low level PTPN13 methylation (median 0.07±0.012) in normal samples and significantly elevated PTPN13 methylation in EAC samples (Welch’s t-test, p=0.03). Using the relative methylation level >0.1 as a cut-off threshold for methylated PTPN13, PTPN13 was methylated in 56% of EAC samples (figure 3A). We further analysed the PTPN13 mRNA expression levels in 14 EAC samples with available mRNA and correlated them with the samples’ PTPN13 promoter methylation status (figure 3B). We observed 71.4% of PTPN13 methylated EAC samples showed low mRNA level (normalised expression <0.5) (online supplementary figure 14A). Of note, the PTPN13 gene expression was heterogeneous in EAC samples, likely reflecting a mixure of stromal and tumour tissue and the small sample size. Assessment of normal SQ epithelium contamination with cytokeratin 14 (KRT-14) gene expression50 revealed the two outliers had high levels of contamination (online supplementary figure 14B). In contrast, 71.4% of unmethylated EAC samples showed high mRNA level (normalised expression >8) (online supplementary figure 14A). To determine the role of DNA methylation in the regulation of PTPN13 gene expression, we treated ESO26 and OE33 cell lines, which have methylated PTPN13 and no detectable mRNA level, with 5-Aza-dC. As shown in figures 3C,D, 5-Aza-dC treatment restored PTPN13 gene expression in both cell lines and this restoration of gene expression was associated with a significant decrease in promoter DNA methylation (Student’s t-test, p<0.5).
Supplemental material

Aberrant methylation of PTPN13 in a subset of EAC leads to its transcriptional repression. (A) The relative methylation of PTPN13 (normalised to C-Less-C1 control) in normal oesophagus tissues (n=7) and EAC biopsy samples (n=16) was determined using qMS-PCR. The average relative methylation, depicted as a line, is significantly elevated in EAC compared to normal oesophagus (Welch’s t-test, p<0.05). The red dots indicate EAC samples with methylated PTPN13 (see online supplementary methods). (B) The relative DNA methylation level (normalised to C-Less-C1 control) (y-axis) and mRNA expression (normalised to GUSB) of PTPN13 (x-axis) for 14 EAC biopsy samples with available RNA. The mRNA expression was determined using quantitative real-time PCR with GUSB as control gene (see online supplementary methods). The red dots indicate EAC samples with methylated PTPN13. (C–D) A significant transcriptional re-expression of methylated PTPN13 following 5-Aza-dC treatment in OE33 and ESO26 cell lines. Cells were treated with 5 and 10 µM 5-Aza-dC for 72 hours. *Student’s t-test, p<0.05. (E–F) A significant decrease in the relative methylation level of PTPN13 following 5-Aza-dC treatment in OE33 and ESO26 cell lines. *Student’s t-test, p<0.05. 5-Aza-dC, 5-Aza-2’Deoxycytidine; EAC, oesophageal adenocarcinoma; qMS-PCR, quantitative methylation-specific PCR.

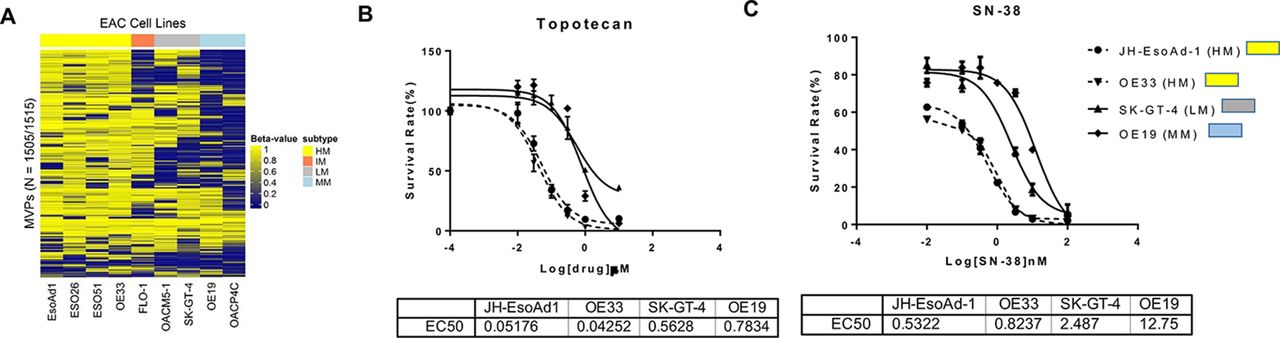
Inhibition of PTPN13 promotes proliferation, colony formation, migration and key kinase phosphorylation events i n EAC cells. (A) The relative DNA methylation level (normalised to C-Less-C1 control) (y -axis) and mRNA expression (normalised to GUSB) of PTPN13 (x -axis) in seven EAC cell lines. The PTPN13 mRNA level in SK-GT-4 cells is higher than other lines. (B) Daily proliferation assays in SKGT4-PTPN13-shRNA cells versus non-specific scrambled control (NSC) or parental cells. ** Student’ s t-test, p < 0.01. (C) Colony formation assays in NSC cells (two wells on the left) versus PTPN13-shRNA (two wells on the right) at 50 cells or 100 cells seeded per well (original magnification 10×) reveals PTPN13 suppresses colony formation. (D) Compared with mock or NSC cells, transfection with PTPN13-shRNA promoted migration. * Student’ s t-test, p < 0.05 in SK-GT-4 cells. (E) Western blotting revealed enhanced tyrosine phosphorylation in a panel of key kinases including ERBB2-Tyr1268, EGFR-Tyr1068 and Src-Tyr416 in the basal state, which increased with EGF stimulation, in PTPN13-shRNA SK-GT-4 cells compared with NSC cells.
Inhibition of PTPN13 in EAC cells led to increased cell growth, colony formation and migration
To directly investigate the functional roles of PTPN13 in EAC, we measured the promoter methylation and gene expression of PTPN13 in seven EAC cell lines. We found PTPN13 was methylated with no detectable mRNA level in four EAC cell lines (ESO26, FLO-1, OE33 and ESO51) and that SK-GT-4 had higher PTPN13 mRNA level than any other cell line (figure 4A). Therefore, we chose SK-GT-4 for shRNA knockdown studies to investigate the effect of PTPN13 loss on EAC cells. We used four PTPN13-specific shRNAs with confirmed target sequences and, for the majority of the experiments, used the one that achieved >85% reduction of PTPN13 mRNA levels in transfected SK-GT-4 cells versus non-specific scrambled control (NSC) (online supplementary figure 15). To determine the functional consequences of repressed PTPN13 in EAC cells, we performed several in vitro assays. In comparison with parental SK-GT-4 cells or SK-GT-4 NSC cells, stable transfection of SK-GT-4 cells with PTPN13-shRNA had significantly increased growth at day 4 (Student’s t-test, p<0.01; figure 4B). SK-GT-4 PTPN13-shRNA clones also had increased capacity to form colonies compared with SK-GT-4-NSC control cells (figure 4C). Further, suppression of PTPN13 in SK-GT-4 cells significantly increased the migration of SK-GT-4 compared with the mock transfected cells or NSC cells (Student’s t-test, p<0.05; figure 4D). However, we did not observe significant differences in cell invasion capability. Taken together, these results suggest that inhibition of PTPN13 in EAC cells promotes cell growth, colony formation and migration.
Supplemental material

![[SP4.jpg]](https://gut.bmj.com/content/gutjnl/68/3/389/DC4/embed/inline-supplementary-material-4.jpg?download=true)
![[SP5.jpg]](https://gut.bmj.com/content/gutjnl/68/3/389/DC5/embed/inline-supplementary-material-5.jpg?download=true)
![[SP6.jpg]](https://gut.bmj.com/content/gutjnl/68/3/389/DC6/embed/inline-supplementary-material-6.jpg?download=true)
![[SP8.jpg]](https://gut.bmj.com/content/gutjnl/68/3/389/DC8/embed/inline-supplementary-material-8.jpg?download=true)
![[SP9.jpg]](https://gut.bmj.com/content/gutjnl/68/3/389/DC9/embed/inline-supplementary-material-9.jpg?download=true)
![[SP10.jpg]](https://gut.bmj.com/content/gutjnl/68/3/389/DC10/embed/inline-supplementary-material-10.jpg?download=true)
![[SP13.jpg]](https://gut.bmj.com/content/gutjnl/68/3/389/DC12/embed/inline-supplementary-material-12.jpg?download=true)
![[SP15.jpg]](https://gut.bmj.com/content/gutjnl/68/3/389/DC14/embed/inline-supplementary-material-14.jpg?download=true)
![[SP17.jpg]](https://gut.bmj.com/content/gutjnl/68/3/389/DC16/embed/inline-supplementary-material-16.jpg?download=true)
![[SP19.jpg]](https://gut.bmj.com/content/gutjnl/68/3/389/DC18/embed/inline-supplementary-material-18.jpg?download=true)
![[SP30.jpg]](https://gut.bmj.com/content/gutjnl/68/3/389/DC22/embed/inline-supplementary-material-22.jpg?download=true)
![[SP31.jpg]](https://gut.bmj.com/content/gutjnl/68/3/389/DC23/embed/inline-supplementary-material-23.jpg?download=true)
Treatment response in EAC cell lines representative of different methylation groups. (A) DNA methylation subtypes in EAC cell lines were determined by clustering on the HM450 array data (online supplementary methods). In vitro drug sensitivity curves for JH-EsoAd1 and OE33 (HM cell lines) are compared with SK-GT-4 (LM) and OE19 (MM) after 72 hours of exposure to the topoisomerase inhibitor topotecan (B) or SN-38, the active metabolite of irinotecan (C). Cell survival rate (%) is expressed as the percentage of growth relative to DMSO-treated control cells (± SD for the three experiments). DMSO, dimethyl sulfoxide .
Inhibition of PTPN13 in EAC cells led to enhanced ERBB2/EGFR tyrosine kinase signalling
PTPN13 encodes a non-receptor-type protein tyrosine phosphatase. Its biological functions in EAC have not been elucidated. Thus, we determined if inhibition of PTPN13 in EAC cells would affect the tyrosine phosphorylation status of a panel of key kinases implicated in EAC. As shown in figure 4E, the phosphorylation of EGFR-Tyr1068, ERBB2-Tyr1248 and Src-Tyr416 was increased in PTPN13 knockdown SK-GT-4 cells in basal condition and was further enhanced on EGF stimulation, compared with the NSC control cell line. These data demonstrate that inhibition of PTPN13 enhanced EGFR/ERBB2 and Src kinase signalling. We also assessed PTPN13 protein expression and EGFR phosphorylation in primary EAC tissues. With a limited sample size (n=14), we observed activation of EGFR at Tyr1068 in two EACs with methylated PTPN13 and reduced gene/protein expression (online supplementary figure 16). Further, we examined the protein expression of PTPN13 and phospho-ERBB2 (Tyr1248) in EAC tissue microarrays. The immunohistochemical analyses revealed that 7.7% cases (3/39 EAC cores) had strong pERBB2 (Tyr1248) expression (score 2+) with weak or absent PTPN13 (score ≤60). In contrast, 41% of cases (16/39) with weak or absent pERBB2 (Tyr1248) (score ≤2) had strong PTPN13 expression (score >60) (online supplementary table 15).
Supplemental material
![[SP32.jpg]](https://gut.bmj.com/content/gutjnl/68/3/389/DC24/embed/inline-supplementary-material-24.jpg?download=true)
Supplemental material
Efficacy of cytotoxic chemotherapy differs between EAC methylation subtypes
Given the different genomic features observed between the methylation subtypes, we hypothesised that EACs from different methylation subtypes might respond differently to anticancer chemotherapies. Consequently, as noted previously, we performed DNA methylation profiling on available EAC cell lines and determined the methylation subtype of each cell line (figure 5A, online supplementary table 16 and online supplementary methods). We then tested the growth inhibitory efficacy of two commonly used chemotherapeutic drugs, SN-38 (the active metabolite of irinotecan) and topotecan, which are both topoisomerase I inhibitors, in cell lines representative of the methylation subtypes: JH-EsoAd1 and OE33 (HM), SK-GT-4 (LM) and OE19 (MM). Two HM cell lines responded similarly to SN-38 and topotecan and exhibited a marked sensitivity to both chemotherapeutic agents compared to the SK-GT-4 and OE19 cell lines (figure 5B,C).
Supplemental material
We then evaluated whether these cell lines had differential sensitivities to targeted therapies. Agents targeting cyclin-dependent kinases (CDKs) are currently being evaluated in clinical trials and have potential for the treatment of EAC. Given the genomic alteration profiles of methylation subtypes, we chose to assess palbociclib, a highly specific CDK4/6 inhibitor. We found JH-EsoAd1 and OE33 (HM cell lines) responded similarly to palbociclib, while OACM5.1C (LM cell line) was substantially more sensitive to palbociclib (online supplementary figure 17). The ability of palbociclib to effectively block CDK4/6 activity was determined by inhibition of Rb phosphorylation (online supplementary figure 18).
Supplemental material
![[SP35.jpg]](https://gut.bmj.com/content/gutjnl/68/3/389/DC27/embed/inline-supplementary-material-27.jpg?download=true)
Supplemental material
![[SP36.jpg]](https://gut.bmj.com/content/gutjnl/68/3/389/DC28/embed/inline-supplementary-material-28.jpg?download=true)
Discussion
The development of high-throughput methods for characterising the cancer genome and epigenome has revealed molecular heterogeneity among cancers originating from the same tissue, providing greater insight into their biology, and clinical heterogeneity in natural history and in treatment response.51–53 We now provide further insight into that molecular heterogeneity by identifying and characterising DNA methylation subtypes in BE and EAC (figure 1). Notably, methylation subtypes in NDBE reflect similar MVP methylation patterns to those seen in EAC. Our joint analysis of both methylation and genomic alterations allowed for several primary observations. First, the HM subtype showed a significantly higher overall mutation load compared to the other subtypes (figure 2A). Second, integrative analyses of DNA methylation and gene expression, as well as differential microRNA and target gene expression, revealed HM-specific differences in patterns of gene and network deregulation (figure 2). Furthermore, our integrative analysis identified a list of candidate genes that are epigenetically silenced specifically in the HM subtype, including the candidate tumour suppressor gene, PTPN13, a non-receptor type tyrosine phosphatase. Using combined orthogonal assays (qMS-PCR and quantitative real-time PCR) in an independent cohort of EAC primary tissue samples, we validated our findings that PTPN13 methylation is uniformly low in normal oesophagus tissues and that EACs show promoter hypermethylation and loss of PTPN13 mRNA expression in a subset of EAC primary tissues as well as EAC cell lines. We provided evidence that promoter methylation was driving loss of PTPN13 expression through studies using 5-Aza-dC, a DNMT1 inhibitor (figure 3).
To further elucidate the biological relevance of this HM subtype-specific feature, we investigated the consequences of PTPN13 loss on several hallmark behaviours of EAC cells and showed PTPN13 suppressed cell proliferation, colony formation and migration. Furthermore, inhibition of PTPN13 led to increased phosphorylation in critical tyrosine sites of EGFR/ERBB2 and SRC kinases in the basal state and was further increased by EGF stimulation (figure 5). Additionally, western blotting of EAC biopsy samples revealed increased EGFR-Tyr1068 phosphorylation in a subset that harbours aberrant PTPN13 hypermethylation and silenced expression at both mRNA and protein levels (online supplementary figure 16). Immunohistochemistry analysis of PTPN13 and pERBB2-Tyr1248 in EAC tissue microarrays indicated that strong phosphorylation of ERBB2 (Tyr1248) staining is only present in EACs with weak or absent PTPN13 staining (online supplementary table 15). In aggregate, these findings support the conclusion that PTPN13 is an HM subtype-specific tumour suppressor gene that is silenced epigenetically in HM EACs. Interestingly, our molecular characterisation of DNA methylation subtypes found an increased frequency of genomic alterations in EGFR/ERBB2 genes in HM/IM subtypes (table 1). Collectively, our data on methylated PTPN13 and EGFR/ERBB2 genomic alterations reveal a novel molecular mechanism of activating oncogenic ERBB2/EGFR signalling in a subset of EAC, which highlights the importance of the ERBB2/EGFR signalling pathways in the pathophysiology of a subset of EAC.
Our experiments assessing EAC cell culture susceptibility to two topoisomerase I inhibitors as well as palbociclib (figure 5 and online supplementary figure 17) suggest that the methylation subtypes may have distinct susceptibilities to conventional and targeted therapies. While these in vitro results will need to be validated in additional cell lines and clinical studies, our preliminary findings suggest the DNA methylation-based subtypes are of potential clinical relevance and could eventually be used as prognostic markers or to optimise treatment selection for a specific individual’s EAC.
An important consideration for any analysis of HM450 data is the extent to which heterogeneity in the tissue samples or in the cell type content in the tissue samples can bias findings. We carefully considered whether variable normal tissue content in the samples could explain the methylation differences across subtypes in BE and EAC. All EAC samples in both the BETRNet and TCGA cohorts contained >70% tumour tissue as determined by expert pathological analyses. From computational analysis of EACs, there was no significant difference in tumour purity between HM and MM subtypes. We further observed no significant correlations between methylation subtype membership and important histological (tumour nuclei percent, tumour necrosis percent and tumour weight) or clinical features (age, gender, tobacco use and survival). Based on these deconvolution analyses, it is unlikely that unintended tumour enrichment of specific histologic or clinical features confounds subtype membership.
In summary, we have identified four distinct DNA methylation subtypes of BE and EAC using comprehensive molecular characterisation. Our integrative analysis combined with functional in vitro studies uncovers a novel molecular mechanism by which EAC cells activate the oncogenic kinase pathways via epigenetically silencing the tyrosine phosphatase PTPN13, specifically in the HM subtype. The drug treatment experiments provided evidence that these subtypes may respond differently to conventional chemotherapeutic agents and targeted therapies. Therefore, identification of these subtypes has provided novel insights into the biological mechanisms of EAC carcinogenesis and promises to be helpful in promoting precision medicine in EAC.
Supplemental material
Supplemental material
![[SP21.jpg]](https://gut.bmj.com/content/gutjnl/68/3/389/DC30/embed/inline-supplementary-material-30.jpg?download=true)
Supplemental material
![[SP22.jpg]](https://gut.bmj.com/content/gutjnl/68/3/389/DC31/embed/inline-supplementary-material-31.jpg?download=true)
Supplemental material
![[SP23.jpg]](https://gut.bmj.com/content/gutjnl/68/3/389/DC32/embed/inline-supplementary-material-32.jpg?download=true)
Supplemental material
Supplemental material
Supplemental material
Supplemental material
Supplemental material
References
Footnotes
MY, SKM and MS contributed equally.
Contributors Study concept and design: MY, WMG, AMK, AB, JEW, SDM. Data acquisition: MY, MS, AMK, JA, YG, KTC, AW, TJH, RMO, RE, JEW. Data analysis and interpretation: MY, SM, MS, WMG. Manuscript drafting: MY, SM, MS, WMG. Critical revision of the manuscript for important intellectual content: MY, SDM, MS, AB, AC, WMG. Funding support: MY, SDM, WMG. Reagents/materials/analysis support: XX, JEW, AC, SDM. Study supervision: MY, WMG.
Funding These studies were supported by funding from the NIH: UO1CA152756, 5P30CA015704, U54CA163060, UO1CA086402 and UO1CA182940 to WMG; P50CA150964 to SDM; and T32DK007742 to MY. Funding is also provided by the DeGregorio Family Foundation and the Price Family Foundation to WMG. This material is the result of work supported in part by resources from the VA Puget Sound Health Care System. The views expressed in this article are those of the authors and do not necessarily represent the views of the Department of Veterans Affairs.
Competing interests None declared.
Patient consent Next of kin consent obtained.
Ethics approval University Hospitals Cleveland Medical Center (Cleveland, Ohio) Review Board approval.
Provenance and peer review Not commissioned; externally peer reviewed.
Data sharing statement The HM450 array data will be deposited in GEO and accessible there. Anyone wanting other data is welcome to contact the corresponding author and make a request.
Author note Accession codes: HumanMethylation450 array data for 89 samples (n=23 EAC; n=59 BE from cancer-free patients; n=7 BE from EAC patients) have been deposited at the Gene Expression Omnibus under accession numbers GSE81334.