Article Text

Abstract
Background and objective Progression of a colorectal adenoma to invasive cancer occurs in a minority of adenomas and is the most crucial step in colorectal cancer pathogenesis. In the majority of cases, this is associated with gain of a substantial part of chromosome 20q, indicating that multiple genes on the 20q amplicon may drive carcinogenesis. The aim of this study was to identify genes located on the 20q amplicon that promote progression of colorectal adenoma to carcinoma.
Design Functional assays were performed for 32 candidate driver genes for which a positive correlation between 20q DNA copy number and mRNA expression had been demonstrated. Effects of gene knockdown on cell viability, anchorage-independent growth, and invasion were analysed in colorectal cancer cell lines with 20q gain. Colorectal tumour protein expression was examined by immunohistochemical staining of tissue microarrays.
Results TPX2, AURKA, CSE1L, DIDO1, HM13, TCFL5, SLC17A9, RBM39 and PRPF6 affected cell viability and/or anchorage-independent growth. Chromosome 20q DNA copy number status correlated significantly with TPX2 and AURKA protein levels in a series of colorectal adenomas and carcinomas. Moreover, downmodulation of TPX2 and AURKA was shown to inhibit invasion.
Conclusion These data identify TPX2 (20q11) and AURKA (20q13.2) as two genes located on distinct regions of chromosome 20q that promote 20q amplicon-driven progression of colorectal adenoma to carcinoma. Therefore the selection advantage imposed by 20q gain in tumour progression is achieved by gain-of-function of multiple cancer-related genes—knowledge that can be translated into novel tests for early diagnosis of progressive adenomas.
- TPX2
- AURKA
- chromosome 20q gain
- colorectal adenoma to carcinoma progression
- colon carcinogenesis
- colorectal cancer
- colorectal cancer genes
- colorectal cancer screening
- colorectal carcinoma
- cancer
- adenoma
- molecular biology
- tumour markers
- gastric cancer
- genetic instability
- colonic adenomas
Statistics from Altmetric.com
- TPX2
- AURKA
- chromosome 20q gain
- colorectal adenoma to carcinoma progression
- colon carcinogenesis
- colorectal cancer
- colorectal cancer genes
- colorectal cancer screening
- colorectal carcinoma
- cancer
- adenoma
- molecular biology
- tumour markers
- gastric cancer
- genetic instability
- colonic adenomas
Significance of this study
What is already known about this subject?
-
Detection of colorectal tumours at an early (pre-malignant) stage of disease development is an effective approach for reducing colorectal cancer mortality.
-
Progression of colorectal adenomas to invasive cancer is a critical step in colorectal cancer pathogenesis, which occurs in a minority of only 5% of adenomas.
-
The transition of colorectal adenomas to carcinomas is driven by non-random molecular alterations, the most prominent of which is gain of a large region of chromosome 20q.
-
Aurora kinase A (AURKA) is considered to be one of several candidate genes that promote chromosome 20q amplicon-driven progression of adenoma to carcinoma.
What are the new findings?
-
TPX2 (20q11), in addition to AURKA (20q13.2), is identified as a novel gene that promotes 20q amplicon-driven progression of colorectal adenoma to carcinoma.
-
The selection advantage imposed by gain of a large region of chromosome 20q in colorectal tumour progression is achieved by gain-of-function of multiple cancer-related genes, rather than being caused by a single driver gene.
How might it impact on clinical practice in the foreseeable future?
-
Molecular screening tests for colorectal cancer may be fine-tuned to detect the minority of adenomas that are truly at high risk of progression.
Introduction
Colorectal cancer (CRC) is the third most prevalent and second most fatal type of cancer in the Western world. It develops from normal colon epithelium through an adenoma precursor stage. Only 5% of these adenomas are estimated to progress to cancer,1 a transition that requires significant biological changes that are facilitated by an enhanced rate of genomic instability.2 ,3 Chromosomal aberrations are detected in ∼85% of CRCs and occur as non-random events, often involving gain of chromosome regions 8q, 13q and 20q, and loss of 4q, 8p, 17p and 18q.4 ,5 We previously demonstrated that gain of the long arm of chromosome 20 (20q) is strongly associated with progression of colorectal adenoma to carcinoma.6 The clinical relevance of 20q gain in cancer is emphasised by its association with a poor prognosis in CRC and other cancer types.7 ,8
The fact that amplification of substantial parts of 20q is associated with progression of colorectal adenoma to carcinoma implies that increased DNA copy numbers of one or more genes must have functional consequences, most likely caused by aberrant mRNA and protein expression. Well-known examples of such gene-dosage effects include the MYC gene on 8q24.1 and the ERBB2 gene on 17q21.1. In contrast with these amplifications, which often span small genomic regions of <250 kb,9 amplification of chromosome 20 often involves the whole q-arm of 36 Mb. Several studies aiming to identify candidate genes for tumour progression on 20q have pinpointed aurora kinase A (AURKA) as the target of the amplicon,6 ,10 which is supported by its functional role in several carcinogenic processes in different tumour types.11–14 However, the large size of the 20q amplicon suggests that, in addition to AURKA, other genes at this locus would also drive colorectal adenoma to carcinoma progression. Indeed, we have previously shown a gene-dosage effect—that is, mRNA expression levels correlated with change in DNA copy number status, for multiple genes on 20q.6
These lines of evidence prompted us to test the hypothesis that multiple genes on the 20q amplicon drive tumour progression in CRC in a 20q DNA copy number-dependent manner. RNA and protein levels of such genes are expected to be associated with 20q gain, while functionally affecting carcinogenesis. In the present study, we investigated the functional role of a series of candidate driver genes on 20q for which a positive correlation between 20q DNA copy number and mRNA expression had been found.
Materials and methods
Selection of candidate driver genes
Genes for which the (20q) DNA copy number status correlated with mRNA expression levels in a genome-wide statistical evaluation of array-based comparative genomic hybridisation (array CGH) and mRNA expression data6 were selected as candidate driver genes for chromosome 20q amplification (n=30). In addition, individual statistical analysis of six genes referred to in literature as potentially contributing to (CRC) carcinogenesis revealed a correlation between DNA copy number status and mRNA expression for BCAS4 and PFDN4 (Pearson correlation; p<0.05). The other four genes—BCL2L1, CYP24A1, SRC and TOP1—were not considered candidate drivers, as no gene-dosage effect was observed; however, they were included as positive controls for functional assays (literature reference genes). The selection of 20q candidate driver genes is listed in online supplementary table 1.
Cell culture and transfection with small interfering RNA (siRNA)
HT29 and SW480 cells were grown in Dulbecco's modified Eagle's medium (Lonza, Verviers, Belgium) containing 10% fetal bovine serum (FBS) (HyClone; Perbio Science, Etten-Leur, The Netherlands), and Caco2 cells in RPMI 1640 (Lonza) containing 20% FBS. Transfection with siRNA pools (SMARTpools) from Dharmacon (Lafayette, Colorado, USA) was performed 24 h after seeding according to the manufacturer's recommendations. A final siRNA concentration of 30 nM was obtained using DharmaFECT3 reagent (1:1000 dilution) for Caco2 and SW480 cells, and DharmaFECT4 reagent (1:250 dilution) for HT29 cells. siRNA pools directed against PLK1 (M-003290-01) and BIRC5 (M-003459-03) were used as positive controls for cell viability and invasion assays,15 respectively. A non-targeting control siRNA pool (Non-Targeting Pool 2; D-001206-14) was used as a negative control.
Cell viability assay
Cells plated in 96-well flat-bottom plates (2500 cells per well for Caco2, and 5000 cells per well for HT29 and SW480) were transfected in triplicate. Cells were left untreated for 3 days (regular culture conditions) or were treated with 5-fluorodeoxyuridine (5FU; Sigma-Aldrich, Zwijndrecht, The Netherlands) at a final concentration of 2 μM (Caco2 and SW480) or 3 μM (HT29) for 5 days (5FU-induced cytotoxicity). Cell viability was measured using the 3-(4,5-dimethylthiazolyl-2)-2,5-diphenyltetrazolium bromide (MTT; ICN Biomedicals, Solon, Ohio, USA) assay. Only those genes that showed a significant effect in at least two out of three cell lines were regarded biologically relevant.
Anchorage-independent growth assay
SW480 cells were plated in 24-well cell culture plates (28 000 cells per well) and transfected in duplicate. The next day, untransfected cells were counted, and volumes containing 5000 cells were plated in 0.35% top agarose (SeaPlaque agarose; Lonza, Verviers, Belgium) on a surface of 0.6% bottom agarose, in duplicate. Likewise, the same volume of transfected cells (harvested from one well) was plated in agarose. The MTT cell viability assay was performed (using cells from the second well) to correct the number of observed colonies by the number of viable cells. After 3 weeks of incubation at 37°C, the number of colonies was evaluated by taking digital images on which colony numbers were counted using image processing.
Invasion assay
SW480 cells were seeded in 12-well cell culture plates (60 000 cells per well) and transfected in duplicate. Cellular invasion was measured using transwells (HTS FluoroBlok; Falcon, BD Biosciences, Alphen aan de Rijn, The Netherlands) coated with extracellular matrix gel (ECM gel; Sigma-Aldrich) as previously described.16 One day after transfection, all cells from each well were transferred to a coated transwell. After 4 h, medium in the upper compartment was replaced by serum-free medium, and medium in the lower compartment by medium containing 10% FBS. Invasion rates were determined after 48 h by taking ratios of invaded cells (bottom compartment) to non-invaded cells (top compartment), which were quantified by fluorescent labelling of cells with 5 μM calcein-AM (Molecular Probes, Invitrogen, Leiden, The Netherlands).
Statistical analysis of functional assays
A log2 ratio of the target gene effect relative to the control non-targeting siRNA was calculated for each gene per experiment. Data from the respective assays were normalised to correct for day-to-day variation and reduce the effect of technical or biological outliers, using robust regression (R package MASS, function ‘rlm’, default settings). Per assay, genes identified by the permutation-rank test for negative outliers were considered to have a biologically relevant effect on the cell's phenotype after downregulation. More specifically, per experiment, the rank of the result for each gene was determined with respect to all other genes in that experiment. For each gene, the sum of the ranks over all experiments involving that particular gene was used as test statistic. p Values corresponding to the observed test statistics were determined by permutation.
Immunohistochemical analysis
Immunohistochemical staining was performed on tissue microarrays (TMAs) containing colorectal adenoma and CRC tissue samples. Histological and molecular characteristics of the tumours, including microsatellite instability status and chromosome 20q copy number status, are shown in online supplementary table 2. Tissue samples were used in agreement with the ‘Code for Proper Secondary Use of Human Tissue in the Netherlands’, in compliance with national and institutional ethics regulations. TMAs were stained using antibodies directed against AURKA (mouse monoclonal NCL-L-AK2; Novocastra Laboratories, Newcastle upon Tyne, UK), chromosome segregation 1-like factor (CSE1L; mouse monoclonal NCL-CAS; Novocastra Laboratories) and targeting protein for Xenopus kinesin-like protein 2 (TPX2; rabbit polyclonal HPA005487; AtlasAntibodies, Stockholm, Sweden). The HPA005487 antibody was specifically generated and used for protein profiling as part of the Human Protein Atlas project (http://www.proteinatlas.org).17 ,18 AURKA protein expression was scored as negative, weak or strong on the basis of intensity of nuclear staining, as previously described.6 CSE1L staining intensity was evaluated as negative, weak, moderate or strong. TPX2 staining was analysed on the basis of the frequency of positive epithelial nuclei distributed over three categories: low (<25%), intermediate (25–50%) and high (>50%). For a detailed description of immunohistochemical staining and scoring, see online supplementary materials and methods.
Statistical analysis of DNA copy number, mRNA and protein expression data
Data on DNA copy number ratio and mRNA expression of colorectal adenomas and CRCs had been previously obtained by array CGH and mRNA expression arrays, respectively.6 For the evaluation of immunohistochemical staining per tumour, the maximum score of the evaluated tumour cores was used. Differences in mRNA expression between tumours with and without 20q copy number gain were determined using the Mann–Whitney test. Differences in protein expression levels between tumours with and without 20q gain were determined using the linear-by-linear association test, a χ2 test that takes into account the order of the data. DNA copy number ratios of the actual AURKA and TPX2 loci were determined by taking the ratio of tumour to normal DNA of the array CGH bacterial artificial chromosome clone nearest to the gene locus (RP5-1167H4 for AURKA and RP5-857M17 for TPX2). Significance for coexpression of AURKA and TPX2 at DNA and mRNA level was calculated by Pearson correlation, and their correlation at protein expression level by the Kendall tau-b test. Statistical analyses were performed in SPSS (V.15.0 for Windows).
Results
AURKA, TPX2, SLC17A9, RBM39, TCFL5, CSE1L and PRPF6 affect cell viability
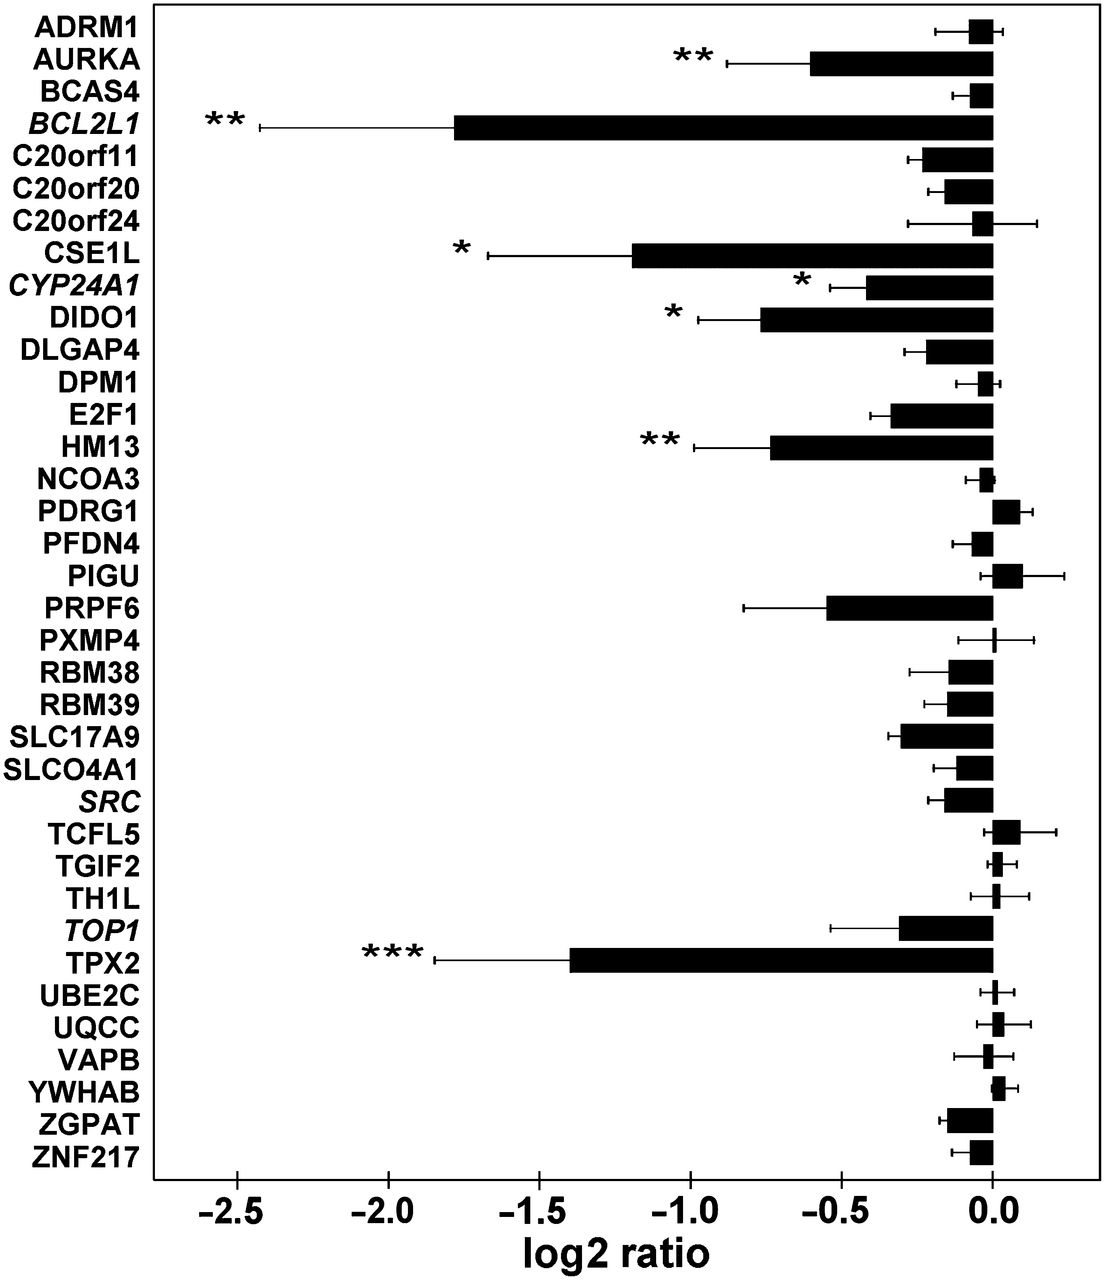
From a total of 520 genes located on chromosome arm 20q, 32 candidates for progression of colorectal adenoma to carcinoma were selected on the basis of correlation of their (20q) DNA copy number status with mRNA expression levels (see materials and methods and online supplementary table 1). The observation that cell lines can often be derived from CRC tissue while attempts to obtain colorectal adenoma cell lines generally fail implies that genes critical to viability of cell cultures are affected during adenoma to carcinoma progression. Therefore cell viability was examined upon loss-of-function of candidates by siRNA-mediated mRNA downmodulation using three human CRC cell lines with 20q amplification—SW480, Caco2 and HT29 (online supplementary figure 1). Downmodulation of gene expression was confirmed by quantitative reverse transcription PCR for a selection of target genes (online supplementary figure 2 and supplementary materials and methods). Cell viability was reduced by AURKA, TPX2, SLC17A9, RBM39 and TCFL5 in at least two of the three CRC cell lines cultured under regular conditions (figure 1A). Likewise, cell viability was investigated after induction of cellular stress by administration of the cytotoxic anti-cancer drug 5FU. In addition to the genes that affected cell viability under regular culture conditions, viability of 5FU-stressed cells was also affected by CSE1L and PRPF6 (figure 1B).

AURKA, TPX2, SLC17A9, RBM39, TCFL5, CSE1L and PRPF6 affect cell viability. The effect of downmodulation of 20q genes on cell viability was measured by the 3-(4,5-dimethylthiazolyl-2)-2,5-diphenyltetrazolium bromide (MTT) assay under regular culture conditions (A) and upon 5-fluorodeoxyuridine-induced cytotoxicity (B) in Caco2, HT29 and SW480 CRC cells. At least three independent experiments were performed for each gene (32 candidate driver genes and four literature reference genes—in italics). Bars represent the mean log2 ratio of cell viability of cells treated with siRNAs downregulating target gene expression relative to control cells transfected with non-targeting siRNA. Error bars correspond to SE. p Values were determined using a permutation-rank test for negative outliers: *p<0.05, **p<0.01 and *** p<0.001. Actual p values, mean log2 ratios and standard errors are provided in online supplementary table 3.
AURKA, TPX2, HM13, CSE1L and DIDO1 affect anchorage-independent growth
Malignant transformation is characterised by the ability of cells to survive and proliferate outside their normal environment. Therefore the effects of the candidate genes on anchorage-independent growth were examined using the cell line SW480. The number of colonies formed was significantly decreased on mRNA downmodulation of AURKA, TPX2, HM13, CSE1L and DIDO1 (figure 2). The effects of TPX2, HM13, CSE1L and DIDO1 on anchorage-independent growth exceeded their effects on cell viability. However, the strong effects of AURKA on cell viability may have contributed to the observed effect on anchorage-independent growth (online supplementary figure 3). These data support the hypothesis that multiple genes on the 20q amplicon influence colorectal tumour progression.

AURKA, TPX2, HM13, CSE1L and DIDO1 affect anchorage-independent growth. The effect of downmodulation of 20q genes on anchorage-independent growth was measured by colony formation of SW480 cells in soft agarose. At least three independent experiments were performed for each gene (32 candidate driver genes and four literature reference genes—in italics). Bars represent the mean log2 ratio of the number of colonies formed by cells transfected with siRNAs directed against one of the target genes relative to the number of colonies formed by control cells transfected with non-targeting siRNA. Error bars correspond to SE. p Values were determined using a permutation-rank test for negative outliers: *p<0.05, **p<0.01 and ***p<0.001. Actual p values, mean log2 ratios and standard errors are provided in online supplementary table 3.
AURKA and TPX2 mRNA and protein levels correlate with 20q DNA copy number status
Correlation of 20q DNA copy number status with mRNA and protein expression was evaluated for three genes that affected both cell viability and anchorage-independent growth—AURKA, CSE1L and TPX2. Significant correlation between chromosome 20q DNA copy number status and mRNA expression level—that is, one of the criteria used to select candidate genes—is illustrated for each of these genes in microsatellite stable colorectal adenomas and carcinomas (figure 3A–C). In order to correlate AURKA, CSE1L and TPX2 protein expression with chromosome 20q DNA status, their expression levels were examined by immunohistochemical evaluation. First, antibody specificity was confirmed by immunohistochemical staining of siRNA-treated formalin-fixed paraffin-embedded cells (online supplementary figure 4 and supplementary materials and methods). Next, TMAs containing colorectal adenoma and carcinoma samples were tested for AURKA, CSE1L and TPX2 protein expression. Epithelial expression of AURKA protein was mostly nuclear, as previously described,6 and was stronger in microsatellite stable tumours with 20q gain than in tumours without 20q gain (linear-by-linear association, p=0.00002; figures 3D and 4A). CSE1L protein expression was predominantly observed in epithelial cells that showed nuclear staining, often together with weaker cytoplasmic staining (online supplementary figure 5A). No significant correlation was found between CSE1L staining and chromosome 20q copy number status (linear-by-linear association, p=0.3; figure 3E). TPX2 protein expression was predominantly observed in nuclei of epithelial cells (online supplementary figure 5B). The frequency of positive TPX2 staining was significantly higher in tumours with 20q gain than in those without 20q gain (linear-by-linear association, p=0.001; figures 3F and 4B). These data show that mRNA and protein levels of AURKA and TPX2 correlate with 20q DNA copy number status.

AURKA and TPX2 mRNA and protein levels correlate with 20q DNA copy number status. mRNA and protein expression levels of AURKA, CSE1L and TPX2 were analysed in colorectal tumours in relation to 20q DNA copy number status. AURKA (A), CSE1L (B) and TPX2 (C) mRNA expression levels (arbitrary units) in an mRNA expression array dataset of microsatellite stable colorectal adenomas and carcinomas, in the absence and presence of 20q gain. p Values were calculated by the Mann–Whitney test. Protein expression of AURKA (D), CSE1L (E) and TPX2 (F) in microsatellite stable colorectal adenoma and carcinoma samples, in the absence and presence of 20q gain. p Values were determined by the linear-by-linear association test.

Examples of AURKA (A) and TPX2 (B) protein expression in colorectal adenomas and carcinomas with and without 20q gain.
AURKA and TPX2 affect invasion
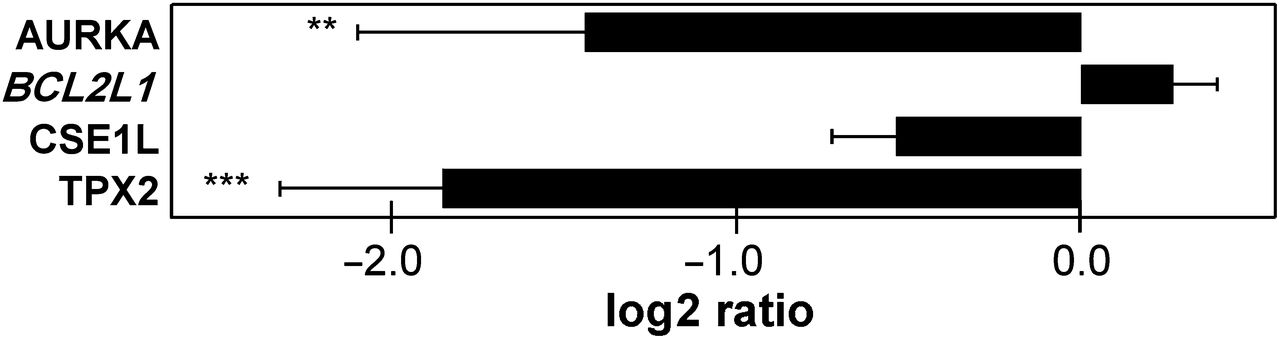
AURKA and TPX2 proteins have been described as interacting with each other,19–22 and downmodulation of AURKA has been shown to reduce invasive capacity.11 Therefore we next examined the effects of TPX2 and AURKA on invasive capacity of SW480 cells. Invasion was significantly reduced by downmodulation of TPX2, as seen with AURKA, while such effects were not observed for CSE1L (figure 5).

AURKA and TPX2 affect invasion. The effect of AURKA, CSE1L and TPX2 downmodulation on invasion of SW480 cells was investigated in a transwell system. Invasion rates were determined by the ratio of invaded to non-invaded cells. At least three independent experiments were performed (BCL2L1 literature reference gene—in italics). Bars represent the mean log2 ratio of invasion rate of siRNA transfected cells relative to the invasion of control cells transfected with non-targeting siRNA. Error bars correspond to SE. p Values were determined using a permutation-rank test for negative outliers: **p<0.01 and ***p<0.001. Actual p values, mean log2 ratios and standard errors are provided in online supplementary table 3.
AURKA and TPX2 are coexpressed at DNA, mRNA and protein level
Because mRNA and protein expression of both AURKA and TPX2 correlated with chromosome 20q status, we further examined the extent of coexpression of AURKA and TPX2. A highly significant correlation was observed between AURKA and TPX2 DNA copy number ratios (Pearson correlation, p=4E-19), mRNA expression levels (Pearson correlation, p=7E-16) and protein expression levels (Kendall tau-b test, p=4E-08) (figure 6). Protein expression of AURKA and TPX2 was concordant in 70% of cases, showing either high or low expression for both proteins. Consequently, classifying tumours by their 20q DNA copy number status based on either AURKA or TPX2 protein expression is only marginally improved when the protein expression of both are used (online supplementary figure 6). These results indicate that AURKA and TPX2 are generally coexpressed and that their expression levels are similarly associated with chromosome 20q gain status in colorectal adenomas and carcinomas.

AURKA and TPX2 are coexpressed at DNA, mRNA and protein level. Correlation of AURKA and TPX2 DNA copy number ratios (as determined by array comparative genomic hybridisation) (A) and mRNA expression (arbitrary units) (B) was analysed by Pearson correlation. (C) Correlation of AURKA and TPX2 protein expression data was investigated by the Kendall tau-b test.
Discussion
Substantial parts of chromosome 20q are commonly amplified in progression of colorectal adenoma to carcinoma.6 This implies that gain of multiple genes spread over chromosome arm 20q applies more selective pressure driving CRC carcinogenesis than focal amplifications, which contain only one or a few genes. Theoretically, a combination of genes that promote tumour progression may affect different features of carcinogenesis or may act collaboratively to acquire or augment one specific cancer phenotype. Evaluation of the functional roles of 32 candidate driver genes on 20q in several cancer-related processes led to the novel identification of TPX2 and validation of AURKA as two genes on the 20q amplicon that promote colorectal adenoma to carcinoma progression. Although both genes are located on the q-arm of chromosome 20—that is, TPX2 on 20q11.2 and AURKA on 20q13—they are approximately 24 Mb apart. Functionally, both genes affect several carcinogenesis-related processes such as cell viability (figure 1), anchorage-independent growth (figure 2), and invasion (figure 5). Genomically, 20q gain is associated with increased AURKA and TPX2 mRNA and protein expression in colorectal tumours (figure 3). These results are consistent with features expected from genes that drive gain of the amplicon. Somatic mutations in AURKA and TPX2 have been reported to occur at low frequency in CRC, which supports their putative oncogenic potential.21 ,23
AURKA and TPX2 are known to directly interact with each other19–22 and were shown in the present study to have similar functional effects when individually downregulated. We therefore hypothesise that these genes affect the same aspects of tumour progression through a gene-dosage effect in which amplification of both genes applies more selection advantage than single gene amplification. Recently, Asteriti et al reported concurrent expression of AURKA and TPX2 in multiple tumour types. They propose that AURKA and TPX2 form a functional unit with oncogenic properties, especially when both genes are overexpressed,22 a model that is consistent with our current findings.
The cell-cycle-regulated kinase, AURKA, is required for mitotic spindle assembly and controls chromosome segregation. AURKA located on centrosomes contributes to centrosome separation, duplication and maturation,24 whereas AURKA on spindle microtubules stimulates microtubule formation and stabilisation.25 Overexpression of AURKA has been reported to stimulate centrosome amplification, genomic instability and transformation, but also cell survival and migration, while inhibiting apoptosis.12 ,13 ,26 Inhibition of AURKA overexpression has been reported to reduce proliferation, colony formation, migration and invasion, whereas it stimulates cell cycle arrest and apoptosis in other tumour types.11 ,14 TPX2 is a binding partner of AURKA and is required to position AURKA at the spindle microtubules and stimulate its activity.19 ,27 Although TPX2 mRNA overexpression has been found to be due to TPX2 locus amplification in lung and cervical cancer,28 ,29 the functional consequences of TPX2 overexpression in (CRC) carcinogenesis have been less well described. In pancreatic cancer cells, interference with TPX2 mRNA expression induced apoptosis and inhibited proliferation, anchorage independence and tumorigenicity.30 The present study reports for the first time a functional role for TPX2 in CRC carcinogenesis.
An association between aberrant expression of AURKA and TPX2 and chromosomal instability has been assumed because accurate regulation of mitotic spindle formation is crucial for proper chromosome segregation.3 ,31 However, the effect of AURKA goes beyond its role in the mitotic spindle. AURKA has been described as regulating important signalling molecules, including p53, c-Myc, AKT, MAPK and NF-κB.11 ,32–34 TPX2 may also contribute to this regulation—for example, the protein complex containing AURKA and TPX2 interacts with the IKK complex of the NF-κB pathway.35 In addition, AURKA and TPX2 have recently been shown to modulate alternative splicing of mRNA transcripts, an important regulatory mechanism in biological processes that is misregulated in cancer.36 Thus, next to a role in chromosomal instability, AURKA and TPX2 may influence various carcinogenic processes by regulation of signalling pathways and/or alternative splicing. This further emphasises their crucial role in carcinogenesis and provides a mechanistic explanation for their effects on multiple cancer processes. On the basis of their pluripotent role in carcinogenesis, AURKA and TPX2 are attractive drug targets. Phase I and II clinical trials with AURKA inhibitors are underway for several cancer types, including CRC.37 TPX2 was identified as a promising target from an siRNA screen of 3700 genes,38 and combining TPX2 downregulation with taxanes—that is, drugs that interfere with microtubules—synergistically reduced cell viability in pancreatic cells.30
In addition to AURKA and TPX2, the present study revealed other genes at the 20q locus that may contribute to adenoma to carcinoma progression. The nuclear transport factor gene CSE1L contributes to chromosomal instability, apoptosis, invasion and metastasis.39 ,40 The effect of CSE1L on cell viability under 5FU-induced cytotoxicity corresponds to a role in apoptosis induction. However, the carcinogenic effect of CSE1L on invasion of breast cancer cells40 was not observed in CRC cells (figure 5). Moreover, CSE1L was discarded as a driver gene for 20q gain-related progression of adenoma to carcinoma because of lack of correlation between protein expression and 20q DNA copy number status (figure 3E).
Of the other candidate driver genes, several affected either anchorage-independent growth—that is, DIDO1 and HM13—or cell viability—that is, TCFL5, SLC17A9, RBM39 and PRPF6. Tumour-suppressive effects have previously been reported in haematological myeloid neoplasms for DIDO1 (death inducer-obligator 1), an apoptosis-inducing protein that also contributes to chromosomal instability.41–43 We detected an effect of TCFL5 (transcription factor-like 5 protein) on cell viability of Caco2 and HT29 cells, but not on anchorage-independent growth of SW480 cells. The formation of multicellular spheroids from HT29 cells has been reported to be inhibited after downmodulation of TCFL5.44 This suggests a cell line-specific effect of TCFL5 on anchorage-independent growth, which is probably caused by its effect on cell viability. For SLC17A9, RBM39, PRPF6 and HM13, a role in cancer processes has not been previously reported. Further studies are required to explore putative correlations between DNA copy number status and protein expression levels for these genes.
In conclusion, functional screens of 32 candidate driver genes on the 20q amplicon, which is associated with progression of colorectal adenoma to carcinoma, revealed TPX2 and AURKA as major players in this critical step in colorectal carcinogenesis. Given the known functional interaction of these two genes, coamplification appears to be a likely mechanism for achieving this selection advantage. In addition to these two genes, gene-dosage effects of other 20q genes, such as CSE1L, DIDO1, HM13, TCFL5, SLC17A9, RBM39 and PRPF6, may further contribute to cancer progression, since knockdown of each of these genes affected one or more cancer-related assays, raising the possibility that one or several of them act synergistically with AURKA and/or TPX2. These findings are consistent with the hypothesis that the selection advantage imposed by 20q gain in colorectal adenoma to carcinoma progression is achieved by gain-of-function of multiple cancer-related genes at chromosome 20q, rather than affecting a single driver gene. Moreover, these data support the notion that gain of chromosome 20q can be used as a molecular marker for early diagnosis of the clinically most relevant colon tumour lesions—that is, the minority of adenomas that have the potential to progress into carcinomas.
Acknowledgments
We thank Valentine Arendsen and Denice Verheijen for technical support and Jaap Veldhuisen and Ron Otsen for professional photography support.
References
Supplementary materials
Supplementary Data
This web only file has been produced by the BMJ Publishing Group from an electronic file supplied by the author(s) and has not been edited for content.
Files in this Data Supplement:
- Download Supplementary Data (PDF) - Manuscript file of format pdf
- Download Supplementary Data (PDF) - Manuscript file of format pdf
- Download Supplementary Data (PDF) - Manuscript file of format pdf
- Download Supplementary Data (PDF) - Manuscript file of format pdf
- Download Supplementary Data (PDF) - Manuscript file of format pdf
- Download Supplementary Data (PDF) - Manuscript file of format pdf
- Download Supplementary Data (PDF) - Manuscript file of format pdf
- Download Supplementary Data (PDF) - Manuscript file of format pdf
- Download Supplementary Data (PDF) - Manuscript file of format pdf
- Download Supplementary Data (PDF) - Manuscript file of format pdf
- Download Supplementary Data (PDF) - Manuscript file of format pdf
Footnotes
-
Funding This work was supported by the Cancer Center Amsterdam and by the Aegon International Scholarship in Oncology.
-
Competing interests None.
-
Ethics approval This study was conducted with the approval of the medical ethics review board of the VU University Medical Center Amsterdam.
-
Provenance and peer review Not commissioned; externally peer reviewed.