


Abstract
Background/Aim: Nearly all mammalian tumors of diverse tissues are believed to be dependent on fermentative glycolysis, marked by elevated production of lactic acid and expression of glycolytic enzymes, most notably lactic acid dehydrogenase (LDH). Therefore, there has been significant interest in developing chemotherapy drugs that selectively target various isoforms of the LDH enzyme. However, considerable questions remain as to the consequences of biological ablation of LDH or upstream targeting of the glycolytic pathway. Materials and Methods: In this study, we explore the biochemical and whole transcriptomic effects of CRISPR-Cas9 gene knockout (KO) of lactate dehydrogenases A and B [LDHA/B double KO (DKO)] and glucose-6-phosphate isomerase (GPI KO) in the human colon cancer cell line LS174T, using Affymetrix 2.1 ST arrays. Results: The metabolic biochemical profiles corroborate that relative to wild type (WT), LDHA/B DKO produced no lactic acid, (GPI KO) produced minimal lactic acid and both KOs displayed higher mitochondrial respiration, and minimal use of glucose with no loss of cell viability. These findings show a high biochemical energy efficiency as measured by ATP in glycolysis-null cells. Next, transcriptomic analysis conducted on 48,226 mRNA transcripts reflect 273 differentially expressed genes (DEGS) in the GPI KO clone set, 193 DEGS in the LDHA/B DKO clone set with 47 DEGs common to both KO clones. Glycolytic-null cells reflect up-regulation in gene transcripts typically associated with nutrient deprivation / fasting and possible use of fats for energy: thioredoxin interacting protein (TXNIP), mitochondrial 3-hydroxy-3-methylglutaryl-CoA synthase 2 (HMGCS2), PPARγ coactivator 1α (PGC-1α), and acetyl-CoA acyltransferase 2 (ACAA2). Other changes in non-ergometric transcripts in both KOs show losses in “stemness”, WNT signaling pathway, chemo/radiation resistance, retinoic acid synthesis, drug detoxification, androgen/estrogen activation, and extracellular matrix reprogramming genes. Conclusion: These findings demonstrate that: 1) The “Warburg effect” is dispensable, 2) loss of the LDHAB gene is not only inconsequential to viability but fosters greater mitochondrial energy, and 3) drugs that target LDHA/B are likely to be ineffective without a plausible combination second drug target.
Common features across diverse mammalian tumors include the rapid glycolytic activity, greater expression of lactate dehydrogenases (LDH) and subsequent over-production of lactic acid, occurring regardless of the presence of oxygen (Warburg effect) (1,2). This unique trait of cancer has been studied for decades, where researchers have geared off original focus from its role in metabolism to its role in acidification of the tumor microenvironment (TME), a formidable driving force for tumor growth, metastasis, aggressiveness, chemo/radiation resistance and loss of immune surveillance (3-8). This loss of immune surveillance involves a concurrent loss of host T and NK cell functions combined with tumor sequestration of immune leukocyte subpopulations, infiltrated in solid acidic tumors, promoting tumor survival (7, 9). TME acidification directly correlates to tumor progression, which has been exploited pharmacologically for the development of drug delivery systems such as low pH insertion peptides pHLIP (10, 11), or delivery diagnostic tools (12), while attempts at reducing acidity genetically or by pharmacological means include drugs that target LDHA and lactate/H+ symporters (13).
Previously, our laboratory conducted a high throughput screening of over a thousand natural herbs and phytochemicals for inhibition of LDHA (14). LDHA inhibitors, once identified, were then evaluated for their effects on metabolic parameters in MDA-MB-231 breast cancer cells, showing no cell death or reduced production of lactic acid, with the only observable effects being the reduction in proliferative rate (15). Subsequently, we silenced the LDHA gene in MDA-MB-231 cells, where we again reconfirm no adverse consequential effects on viability, lactic acid, energy, or any other observable malignant attribute (16). Subsequent studies led us to investigate all LDH isoforms in this particular cell line – revealing a high dominance of co-existent LDHA and B. We suggested that a double knockdown would be required to reduce both LDHA/B gene expressions to accurately identify the consequences to the loss of this gene. At the same time, Pouyssegur's research group created dual (LDHA/B) knock out clones using CRISPR-Cas9 genome editing, where they reported that this double genetic disruption completely eliminated lactic acid production in human colon adenocarcinoma (LS174T) and mouse melanoma (B16) cells, having no effect on viability, yet coinciding with greater mitochondrial OXPHOS capacity (17, 18). They also established a clone with complete genetic ablation of glucose-6-phosphate isomerase (GPI), which, similarly to the LDHA/B DKO, showed reduced lactic acid production, greater reliance on OXPHOS and suppressed growth in hypoxia (18-20).
Given the unusual survival of tumor cells in response to the severe compromise of glycolysis, in this work we used Affymetrix whole-transcriptome microarrays combined with metabolic biochemical evaluation to explore survival mechanisms.
Materials and Methods
Materials. Ninety-six well plates, pipette tips, Dulbecco's modified Eagle's medium (DMEM), fetal bovine serum (FBS), penicillin/streptomycin, general reagents and supplies were all purchased from Sigma-Aldrich Co. (St. Louis, MO, USA) and VWR International (Radnor, PA, USA). All microarray equipment, reagents, and materials were purchased from Affymetrix/ Thermo Fisher (Waltham, MA, USA).
Cell culture. Dukes' type B, colorectal adenocarcinoma LS174T (ATCC® CL-188™) WT versus GPI KO and LDHA/B double KO (DKO) were established and provided by Dr. Pouyssegur's lab (17, 18). The cells were cultured in 75 cm2 flasks containing high glucose DMEM supplemented with 6% FBS and 1% 10,000 U/ml penicillin G sodium/10,000 μg/ml streptomycin sulfate. Cells were grown at 37°C in 95% atmosphere 5% CO2 and sub-cultured every three to five days. The WT control grew in multi-cellular aggregates, which required trypsin detachment [Trypsin-EDTA (0.25%), phenol red] on a regular basis through pressurized distribution using a 5 ml serological pipette, deactivation with FBS growth media, and monolayer re-seeding. Both KO clones grew in relatively well-distributed monolayers. High glucose DMEM (4,500 mg/l) was used for all studies, except for monitoring glucose consumption, which required low glucose DMEM (1000 mg/l) to unmask differential rates between the three clones.
Cell viability. Cells were equally plated in 96 well plates at 5×10⁵ cells/ml in high glucose media. The resazurin (alamar blue) indicator dye was used to measure viability (21). Briefly, a working solution of resazurin (0.5 mg/ml) was prepared in sterile PBS and filter sterilized through a 0.2-micron filter. The dye solution was added to the samples [15% (v/v) equivalent], and samples were then returned to the incubator for 6-12 h. Reduction of the dye by viable cells reduced the oxidized resazurin, yielding a bright red fluorescent intermediate resorufin quantified using a Synergy HTX multi-mode reader (Bio-Tek, Winooski, VT, USA) with the following settings: 530 nm (excitation)/590 nm (emission) filters.
Lactic acid. Determination of lactic acid produced and released in the media by the three clones was done from cells plated at a density of 5×10⁵ cells/ml by dual detection. Lactic acid was quantified by HPLC (Shimadzu), equipped with an SPD-20A UV detector (set at 210 nm), a workstation containing EZSTART version 7.4 software and an SS420X instrument interface docked to a Waters Autosampler Model 717 Plus (Shimadzu Scientific Instruments, Columbia, MD, USA; Waters, Milford, MA, USA). The flow rate was isocratic at 0.6 ml/min. The mobile phase contained 5mM sulfuric acid, and the column used was an Aminex HPX-87H 300×7.8 mm; 9 μm particle size (Bio-Rad, Hercules, CA, USA). Lactic acid was also determined using a colorimetric enzymatic assay using lactate reagent protocol as provided by the manufacturer (Trinity Biotech, Jamestown, NY, USA). The reagent was added to the samples and incubated for 8 minutes. Lactate was quantified at 490 nm using a Synergy HTX multi-mode reader (Bio-Tek). Experimental media for this assay was high glucose DMEM, containing 1% FBS, 4 mM L-glutamine, and penicillin/streptomycin (100 U/0.1 mg/ml) (minus phenol red). Lower FBS was required to carry out the colorimetric assay, as it interferes with the lactate reagent.
Glucose consumption. Briefly, glucose was quantified by an enzymatic assay using glucose oxidase (20 U/ml) and a chromogenic solution, then quantified at 490 nm on the Synergy/HTX multi-mode reader (Bio-Tek). Experimental media for this assay was DMEM (glucose 1000 mg/l) containing 1% FBS, 4 mM L-glutamine and penicillin/streptomycin (100 U/0.1 mg/ml) (minus phenol red).
Somatic cell ATP. Adenosine triphosphate (ATP) was assessed by using the Adenosine 5’-triphosphate (ATP) bioluminescent somatic cell assay kit (Catalog Number FLASC) purchased from Sigma Aldrich (St. Louis, MO, USA) and carried out according to the manufacturer's instructions. Briefly, cells were lysed with ATP releasing reagent, transferred to a flat white bottom 96 well plate and quantified on a Synergy HTX multi-mode reader (Bio-Tek) using luminescence settings.
Oxygen consumption. The oxygraph respirometer-Clark electrode (Hansatech Instruments Ltd., Norfolk, England) was used to evaluate cellular/mitochondrial respiration indirectly by evaluating dissolved O2 in the media. The electrode was calibrated with both air saturated deionized water and deionized water bubbled with nitrogen for 20 minutes, with additional sodium dithionite to stabilize zero oxygen line calibration. Briefly, the cell supernatants or control media blanks were loaded into the cell chamber jacket at 25°C. After rate equilibration, a reading was taken, and data were plotted as μM O2 consumed/ 24 h.
Microarray WT 2.1 human datasets. All cells were washed three times in ice-cold HBSS, rapidly frozen and stored at −80°C. Total RNA was isolated and purified using the Trizol/chloroform method. The quality was assessed, and concentration was equalized to 82 ng/μl in nuclease-free water. Whole transcriptome analysis was conducted according to the GeneChipTM WT PLUS Reagent Manual for Whole Transcript (WT) Expression Arrays. Briefly, RNA was reverse transcribed to first-strand /second-strand cRNA, cRNA was purified and assessed for yield, prior to the second cycle single-stranded cDNA synthesis, hydrolysis of RNA, and purification of the second cycle single-stranded cDNA. Subsequently, cDNA was assessed for yield, then fragmented, labeled, and hybridized onto the arrays prior to being subjected to fluidics and imaging using the Gene Atlas (Affymetrix, ThermoFisher Scientific). The array data quality control and initial processing from CEL to CHP files were conducted using an expression console, prior to data evaluation using the Affymetrix transcriptome analysis console and String Database (String Consortium 2020) (22, 23). The dataset has been deposited to NIH Gene Expression Omnibus located at: https://www.ncbi.nlm.nih.gov/geo/query/acc.cgi?acc=GSE149289.
Data analysis. Statistical analysis was performed using GraphPad Prism (version 3.0; Graph Pad Software Inc., San Diego, CA, USA) with the significance of difference between the groups assessed using a one-way ANOVA and then followed by Tukey post hoc analysis.
Results
Metabolic profiling. The metabolic parameters in WT and GPI KO LS174T as well as LDHA/B DKO colon adenocarcinoma cells were acquired at 24h for viability (Figure 1A), cell respiration (Figure 1B), glucose consumption (Figure 1C), lactic acid production/release (Figure 1D) and somatic ATP generation (Figure 1E). The findings clearly suggest that both subset KO LS174T viable clones are capable of maintaining energy to thrive, with the primary difference being that the GPI KO and LDHA/B DKO clones display impaired glycolytic ability, as evidenced by the severe loss of lactic acid production, occurring to a greater extent in the latter subset (LDHA/B DKO). These data also show greater ATP yield in both knockouts compared to the WT, with no detectable levels of glucose being consumed within the first 48 h. Experimental protocols to sufficiently quantify glucose consumption rates required low glucose media (1000 mg/l), with data obtained when controls consumed most of the glucose in 96 well plates with an endpoint at 48 h (Figure 1C). This experimental design clearly shows a difference in the WT controls which utilize glucose at a fairly rapid rate, tantamount to the production of lactic acid. In summary, baseline studies confirm that fermentative glycolysis is not required for cells to maintain energy systems, cells can overcome a complete loss of LDHA/B where there appears to be a significant switch to an efficient ATP producing system, non-reliant on glucose. In order to investigate how KO clones overcome a near-complete loss of glycolysis, whole transcriptomic microarrays were then conducted.
Microarray. The overall bio statistical summary data for the microarrays were quantified according to the following analysis set parameters: Fold Change: >2 or <-2, p-Value<0.05, and filtered for only characterized genes. The summary analysis report shows 48,226 genes evaluated, 273 deferentially expressed genes (DEGS) were found in the GPI KO clone set, 193 DEGS in the LDHA/B DKO clone set with 47 DEGs consistent to both KO clones (Figure 2). These changes correspond to transcriptomic shifts being less than 0.5% of the transcriptome affected in both glycolysis-null KOs (Figure 3A, B). Detailed data on the DEGs are presented for both independent clones (Tables I and II) and DEGs consistent to both clones (Table III).
DEG tables. Table I reflects the most significant shift in DEGs for the LDHA/B DKO clone set versus WT controls, where the highest down-regulated genes were: mucin 6 (MUC6), dickkopf (WNT signaling pathway inhibitor) 4 (DKK4), alanyl (membrane) aminopeptidase (ANPEP), EPS8-like 3 (EPS8L3) and solute carrier family 44 member 4 (SLC44A4), while the highest up-regulated genes were among others: cilia and flagella associated protein 126 (CFAP126), 2-5-oligoadenylate synthetase 2 (OAS2), neurotensin (NTS) and serine peptidase inhibitor, Kazal type 1 (SPINK1).
Table II reflects the most significant shift in DEGs for the GPI KO clone set versus WT controls, where down-regulated genes show the highest losses for: dickkopf WNT signaling pathway inhibitor 4 (DKK4), gap junction protein alpha 1 (GJA1), versican (VCAN), biglycan (BGN), and the top up-regulated genes were: S100 calcium-binding protein A7 (S100A7), v-kit Hardy-Zuckerman 4 feline sarcoma viral oncogene homolog (KIT), 5-hydroxytryptamine (serotonin) receptor 1D, G protein-coupled (HTR1D) and 3-hydroxy-3-methylglutaryl-CoA synthase 2, which is mitochondrial (HMGCS2).
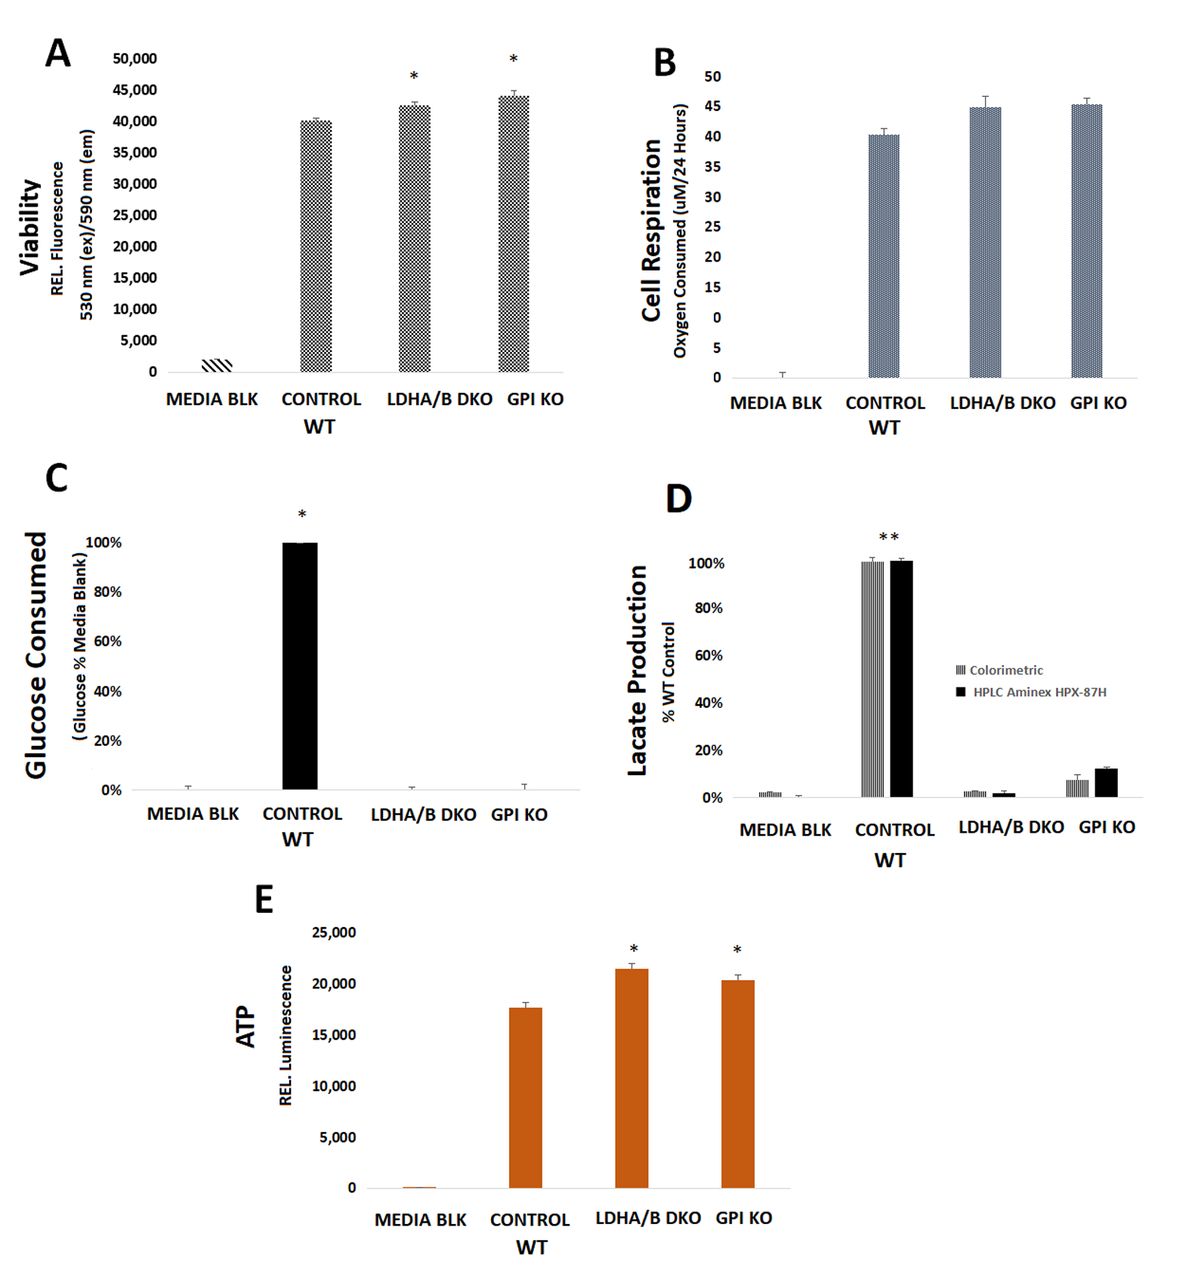
Metabolic parameters in the control WT (LS174T) cells, relative to LDHA/B double knockout (DKO) and GPI KO including: (A) basic viability [relative fluorescent intensity defined as 530 (ex)/590 (em)], (B) oxygen respiration (O2 consumed μM/ 24 h), (C) glucose consumption (media glucose concentrations as a % of WT controls with no defect in glycolysis), (D) lactic acid production (lactic acid produced as a % of WT controls with no defect in glycolysis) and (E) somatic ATP concentrations (relative luminescent values). The data was analyzed by a one way ANOVA, followed by a Tukey post hock test, where significant differences are represented by *p-Value <0.05 and significant differences established for the following: (A-B) WT versus KO clones, (C) glucose media versus consumption in the 3 clones, (D) lactic acid production in 3 clones versus media blank and (E) WT versus KO clones.
Table III shows only overlapping unidirectional DEGs for both glycolytic KO clones versus WT where down-regulated genes show the most significant losses for: dickkopf WNT signaling pathway inhibitor 4 (DKK4), biglycan (BGN), desmocollin 3 (DSC3), crystallin beta B1(CRYBB1), aldo-keto reductase family 1, member C2 (AKR1C), aldo-keto reductase family 1, member B10 (aldose reductase) (AKR1B10), and calbindin 2 (CALB2). The top up-regulated genes included among others: serine peptidase inhibitor (SPINK1), Kazal type 1, FXYD domain-containing ion transport regulator 4 (FXYD4), 3-hydroxy-3-methylglutaryl-CoA synthase 2 (mitochondrial) (HMGCS2), peroxisome proliferator-activated receptor gamma and coactivator 1 alpha (PPARGC1A).
Transcriptome analysis console (TAC) pathway analysis. The totality of the microarray data show that many of the DEGs in clone subsets did not fall on known Wiki metabolic pathways. TAC pathway analysis for glycolysis and TCA cycle genes is shown in Figure 4. In the LDHA/B DKO clones, the data show very few changes accompanying the loss of LDH transcripts, including a reduction in phosphofructokinase (PFKP) with a rise in phosphoenolpyruvate carboxykinase 1 (PCK1), with no modifications to the TCA cycle gene transcripts. The GPI KO clone set shows a compensatory increase in SLC2A1, enolase 2 (ENO2), aldolase, fructose-bisphosphate C (ALDOC) and hexokinase (HK2), with few to no changes in the TCA cycle-related gene transcripts. Integrated pathway analysis (Figure 5A, B) is also provided, which shows potential changes in pyruvate metabolism, glycolysis and gluconeogenesis, urea cycle, glutamate metabolism, ketone bodies, and fatty acid metabolism. Again, these data show very few additional changes in response to severe glycolytic inhibition: LDHA/B DKO displays reduction in argininosuccinate synthase 1 (ASS1, urea cycle), cystathionine gamma lyase (CTH, cysteine metabolism), aldehyde dehydrogenase 1, family member 1 (ALDH1A1, aldehyde metabolism) and significantly elevated expression of HMGCS2 (Figure 6A), while GPI KO reflects a unique elevation in arginase 2 (ARG2, urea cycle). The prominent overlapping transcriptomic shifts consistent in both clone subsets involve the rise in expression of HMGCS2 in the HMG-CoA cycle Wiki diagram and elevation of nuclear-targeted PPARGC1A (Figure 6B).

Whole transcriptome summary of deferentially expressed genes (DEG) in both clones (LDHA/B DKO and GPI KO) vs. WT Vector controls in the LS174T colon cancer cell line, and overlapping genes common to both KO clones. Analysis conditions: fold change >2 or p-Value<0.05. Total number of genes analyzed: 48226. Results: 273 DEGS (GPI KO) and 193 DEGS (LDHA/B DKO) and 47 DEGS common to both KO cell lines.
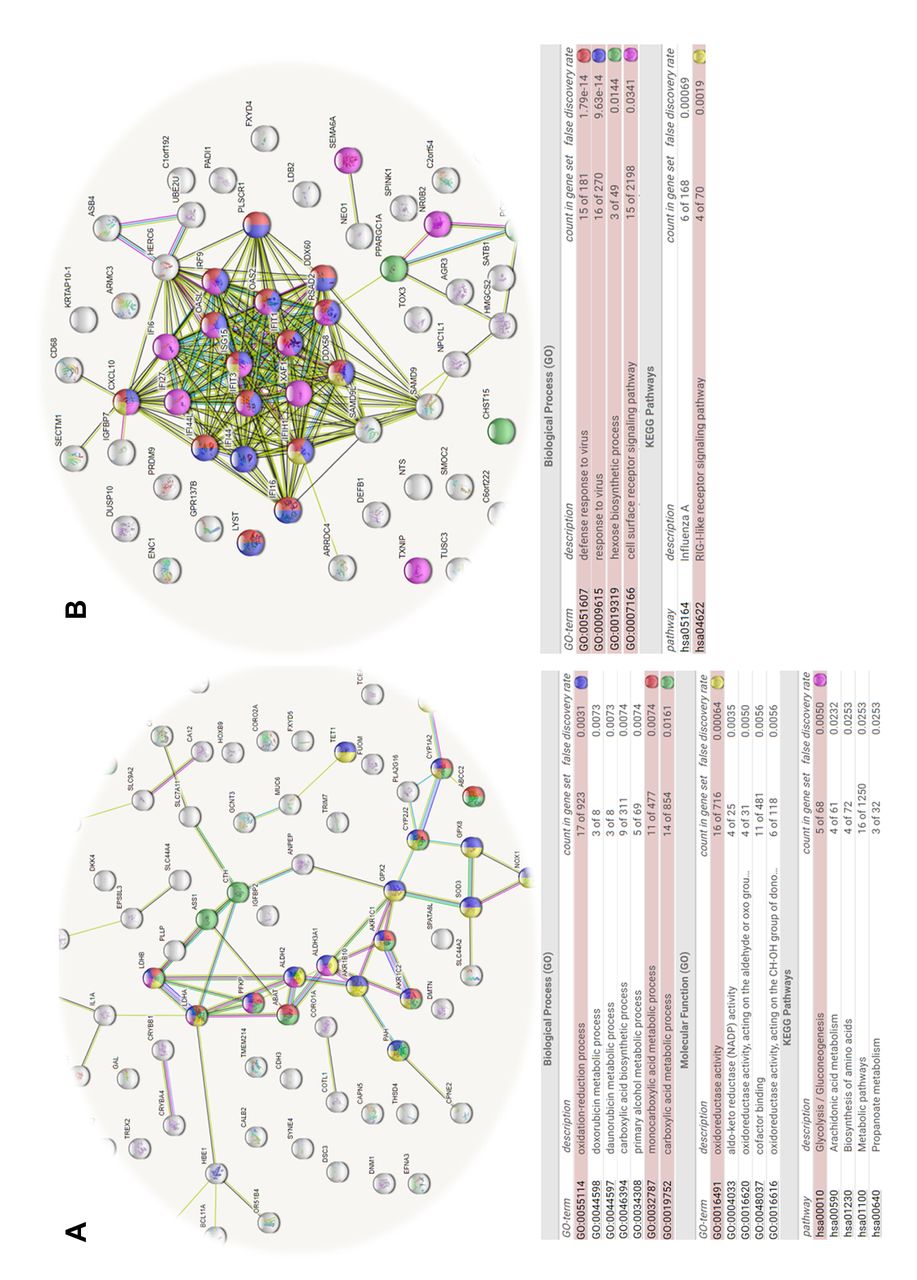
String_db. String database functional analysis was also conducted on subclone datasets, where the LDHA/B DKO versus WT down-regulated DEGs involved losses in oxidoreductase activities, aldehyde dehydrogenase activities, anion transporter activity, and corresponding increases in transcripts associated with proteins involved with response/defense to viral and other organisms, hexose/fructose metabolism and RIG-I-like receptor signaling (Figure 7A, B). Notably, there was a large integrated response evoked by dual knock down in LDHA/B DKO as elucidated by this analysis; the reason for this remains unknown. String database functional analysis on the GPI KO versus WT transcriptome was conducted in both directions, where down-regulated DEGs involved losses in drug detoxification processes, some specific to doxorubicin/daunorubicin, carboxylic acid metabolic systems, oxidoreductase activity and gluconeogenesis, corresponding to a rise in cell response to hypoxia, HIF1 signaling, oxidation-reduction processes, dioxygenase activity, and hexose metabolic processing (Figure 7C, D).

Whole transcriptome summary of DEGs in both clones (LDHAB DKO) (A) and (GPI KO) (B) versus WT vector controls in the LS174T colon cancer cell lines, with respect to the entire genome, also reflecting % of up and down DEGs in both clones. Analysis conditions: fold change >2 or p-Value<0.05. Total number of genes: 48226. (A) LDHAB DKO: Up-regulated 78 (0.16%) and Down-regulated 115 (0.24%), (B) GPI KO: Up-regulated 84 (0.28%) and Down-regulated 121 (0.21%).
Discussion
Energy reprogramming. The data in this study provide evidence to suggest that severe compromise to glycolysis in colon adenocarcinoma LS174T cells can be achieved by selective dual KO of LDHA/B or single KO of the glucose-6-phosphate isomerase (GPI) gene, and is of little consequence to overall cell survival. Both KO clones display suppression of lactic acid secretion, either inability or strong reduction in glucose consumption, high production of ATP, greater mitochondrial functions and a slower proliferative growth rate (data not shown), as previously reported (17, 18).
WT affymetrix human transcriptome: WT versus LDHA/B DKO LS174T colon adenocarcinoma cells.
Typically, malignant tumor cells respond to high concentrations of glucose or insulin (fed state) by induction of gene transcripts and activation of mTOR signaling to augment glucose transporters, glycolytic enzymes, and enable higher production of succinyl-CoA and malonyl-CoA metabolites, which inhibit fatty acid oxidation as an alternative fuel source, coinciding with the Warburg effect. In this study we show that glycolysis-null KO clones undergo a transcriptomic shift consistent with glucose deprivation signaling (response to long term fasting), with increased transcription of mitochondrial HMGCS2 (HMG-CoA synthetase) and PPARγ coactivator-1α (PGC-1α), both associated with loss of mTOR signaling (24). The high expression of PGC-1α reported leads to heightened AMPK phospho-signaling, which normally plays a role in long-chain fatty acid catabolism, inactivation of acetyl-CoA carboxylase (ACC) (which decreases malonyl-CoA), causing the release of carnitine palmitoyltransferase 1A (CPT-1A), aiding the transport of fatty-acyl chains to mitochondria for β-oxidation (25-27). Theoretically, glycolysis would trigger elevation in PGC-1α, where this metabolic fuel switch should coincide with attenuation of biosynthesized steroids and cholesterol, where inactivation of HMG-CoA reductase (HMGCR) would then enable HMG-CoA to be rerouted to the production of ketones (this involving HMGCS2), both elevated in the KO clones. If this was the case, ketones [β-hydroxybutyrate (bHB), acetoacetate, acetone] would be produced through 2 or more acetyl-CoA molecules being condensed by the following enzymes: acetoacetyl-CoA thiolase (ACAT1), HMGCS2 and HMG-CoA lyase (HMGC). We did a follow up investigation for the presence of bHB and acetoacetate, finding no evidence of accumulation of both of these ketones (data not shown). Ketones, if present could be used to fuel the TCA cycle, through the reverse conversion of bHB to acetoacetate, then converted to acetoacetyl-CoA (by succinyl-CoA:3-ketoacid-CoA transferase, SCOT) and lastly to Acetyl-CoA by ACAT1. The end goal of a metabolic flip switch would be to regulate sources of acetyl-CoA to fuel the TCA cycle from glucose (during a fed state) to fats in a non-fed state (β-oxidation). Another metabolic reprogramming gene that was elevated in both KO clones was acetyl-CoA acyltransferase 2 (ACAA2).
WT affymetrix human transcriptome: WT versus GPI KO LS174T colon adenocarcinoma cells.
Future work will be required to corroborate if what we are seeing in both KOs is similar to lipid metabolic oncogenic reprogramming described in diverse cancers which involve the overexpression of both HMGC2 (28, 29) and PGC-1α transcripts (24). Overexpression of HMGC2/PGC-1α has been observed in high-grade colorectal cancer (30), colitis-associated cancer (31), clear cell renal cell cancer (32, 33), ovarian (34), liver (35), oral squamous cell carcinoma (36) and high-grade prostate cancer (37), and is reflective of recurrence and poor prognosis (38). The dual induction of HMGCS2/PGC-1α also propels oncogenic mediated ketogenic events within the cancer milieu/stroma (for example, in cancer-associated fibroblasts) (39).

(A) Wiki Pathway analysis of LDHA/B DKO DEF changes observed in glycolysis, gluconeogenesis and mitochondrial TCA cycle pathways. (B) Wiki Pathway analysis of GPI KO DEF changes observed in glycolysis, gluconeogenesis and mitochondrial TCA cycle pathways. In red are the down-regulated transcripts and in green the up-regulated transcripts. Filtered by fold change <-2 or >2, p-Value<0.05.
Increase in thioredoxin interacting protein transcripts (TXNIP). Concomitant changes to glycolysis in both KOs were few, but the elevated expression of TXNIP was however notable (40). This is a pathological feature of type II diabetes and biological tissues that are unable to utilize glucose (glucose intolerance) (41). An earlier work with a fibroblast mutant defective in phosphoglucose isomerase (PGI) demonstrated that glucose-6-phosphate is the key accumulated metabolite “repressing” glucose transport activity (42), a mechanism further elucidated by Ayer's group in which TXNIP was shown to be induced through a nuclear transcription factor complex, ChREBP/Mlx, (MondoA-Mlx) (43). Finally, TXNIP, by direct interaction with GLUT1 transporter stops its activity by internalization through clathrin coated pits (44). Research using diverse models show a reciprocal self-perpetuated elevation in TXNIP, resulting in the inability to use glucose, with elevated glucose levels driving then further expression of TXNIP (40). The rise in TXNIP, besides a reduction in glucose uptake, can lead to reduced glycolytic enzyme activities (such as Phosphofructokinase, Pyruvate Kinase and Lactate Dehydrogenase), the Pentose phosphate pathway (PPP) and Glucose-6-Phosphate Dehydrogenase (45). This is entirely opposite in cancer, where a reported loss of TXNIP correlates to the observed Warburg effect: rapid glycolysis, higher glucose uptake, and activation of glutaminolysis (46, 47). In other words, diabetes is a disease involving higher TXNIP expression with the inability to use glucose, while cancer is a disease corresponding to lower TXNIP and heightened ability to use glucose, particularly with regards to glycolysis.
DEG patterns in both KO clones relative to WT Controls.
Reduction in aldehyde dehydrogenase transcripts (ALDHs) One of the most significant losses in response to glycolytic impairment in both KO clones was the concomitant repression of several aldehyde dehydrogenase transcripts, specifically ALDH1A1, ALDH2 (mitochondrial), and ALDH3A1, which could create a non-ergogenic vulnerability to cancer cells. High expression of these genes is observed in many cancers, playing a critical role in the biosynthesis of retinoic acid (RA), nuclear signaling (48, 49) and contribution toward the “stemness” or self-renewal features which perpetuates tumor initiation and drug/radiation resistance (50-54). While ALDHs are keys in the collective stemness gene profile (CSN6, CD15, CD24, CD166, TRIM21, CD133, CD82, CD105, CD44, CD90, ALDH1A1, EPCAM, SOX2, SOX9, LGR5, BMI1, NANOG, OCT4, CXCR4 and CD24), ALDHs are specifically up-regulated by pro-oncogenic proteins such as cytokines, growth factors or pollutants which trigger epithelial-mesenchymal transition (EMT), colony formation, migration, and metastasis in diverse cancers with poor clinical outcome (55-61).
One of the critical questions that comes to mind from this particular aspect of the data is the following: is there a correlation between the reduction in ALDHs and metabolic reprogramming? While few studies have investigated this aspect, there are reports suggesting that, in adipocytes, the observed overexpression of ALDH1A1 is associated with fatty acid synthesis, obesity, insulin resistance (62) as well as lipogenesis and triglyceride production (63). In cancer tissues, the rise in ALDHs is associated with heightened glucose uptake, activation of the glycolytic pathway, and elevation of GLUT1 (64). While the loss of ALDHs coincides with complete loss of glucose utilization in both KO clones, the causal effect, if any, between these two events will need further investigation. Future studies will be needed to confirm if LDHA/B inhibitors could be combined with ALDH inhibitors to evoke a more significant chemotherapeutic effect of drugs and radiation (48), and could be explored with ALDH inhibitors such as (−)-epigallocatechin gallate (65, 66), rocaglamide A (67), NCT-501 (67), and ellagic acid (68).
Reduction in Aldo-keto reductase (AKR) transcripts. In this work, we also see a consistent downregulation of several ARKs, including AKR1B10, AKR1C1, AKR1C2 and AKR1C3 in both KO clones. Higher expression of ARKS is frequently reported in cases of liver damage due to environmental pollutants (69), hepatitis C and B virus, aflatoxin B1 (70-72), nonalcoholic fatty liver, steatohepatitis (73), fibrosis (74), and cirrhosis (75). The ARKs, including AKR1B10 and AKR1C3, are also overexpressed in a number of premalignant and established cancers including liver cancer (76-78), and play a role in prostanoid synthesis which drives hormone-dependent cancers including prostate, breast, and endometrial ones (79-81). Heightened AKR1B10 overexpression is also critical to cancers associated with protein prenylation of mutant KRAS; which is a formidable prognostic indicator to tumor invasion, metastasis and progression (82-84), chemoresistance (85), radiation resistance (86), recurrence, tumor size and overall poor clinical outcomes (87-89). Downregulation of ARK1B10 observed in both glycolysis-null clones would favor a vulnerability to tumor growth. This has been shown many times, through either KO or inhibition of AKR1B10 in various in vitro and in vivo models which demarcates reduced tumor growth, metastasis (90, 91), protein prenylation (92), colony formation (3), and ultimately more significant response to chemotherapy drugs such as doxorubicin (93). Given this role in cancer, future research could be conducted to examine if there is a synergistic effect when using LDHA/B inhibitors and ARK class inhibitors, such as apigenin, luteolin (94), epalrestat (95), hop-derived compounds (adhumulone), n-humulone (96), xanthohumol isoxanthohumol (97), caffeic acid phenethyl esters, tolrestat, zopolrestat, sorbinil (76), curcumin, magnolol honokiol (16), oleanolic acid (76) and baccharin analogs or sulfonylureas (98).
WNT signaling. One of the most significant differential shifts in both KOs was the reduced expression of inhibitory controls over WNT signaling: loss of DKK4 (-20.53 FC), which otherwise would act as a canonical WNT/β-catenin signaling inhibitor. In the GPI KO, this corresponded to a significant elevation of C-KIT (+29.65 FC), a major driving force in WNT/β-catenin signaling which plays a role in cancer stem cell reprogramming, EMT, immune evasion and drug resistance (99, 100). The effects of enhanced WNT signaling on glycolysis-null cells would definitely deserve further investigation.

(A) Wiki Pathway analysis of LDHA/B DKO DEF changes observed in integrated amino acid metabolic pathways. (B) Wiki Pathway analysis of GPI KO DEF changes observed in integrated amino acid metabolic pathways. In red are the down-regulated transcripts and in green the up-regulated transcripts. Filtered by fold change <-2 or >2, p-Value<0.05.
Normally, DKK4 acts to suppress the canonical WNT signaling as follows. Briefly, canonical WNT signaling is initiated by WNT ligands that bind to Frizzled (Fzd) receptor family, and cytoplasmic low-density-lipoprotein-related protein 5/6 (LRP5/6, the binding target of DKK4) (101, 102). If DKK inhibits this mechanism, then it would prevent the phosphorylation, recruitment, and polymerization of Dishevelled (Dvl), that would otherwise bind axin to the receptor and inactivate the β-catenin destruction complex. When activated, this leads to a subsequent rise in β-catenin levels which precipitates its translocation into the nucleus to interact with transcription factors [T-cell factor (TCF) and lymphoid enhancer factor (LEF)] to promote cell proliferation and tumorigenesis (103). Both KOs also displayed reduced expression of APC down-regulated 1 (APCDD1), which also binds to WNT3a/LRP5 (102, 104) and inhibits WNT/β-catenin LEF transcriptional signaling (105, 106). The attenuation of negative WNT controls (APCDD1 and DKK4) in glycolytic KOs would, in theory, lead to a rise in β-catenin, which, if occurring in the cytoplasm, could interact with cadherin, bind to the actin filaments or TGF-β and alter cell-cell adhesion, thus resulting in a very loose mesenchymal phenotype contributing to metastasis. This could be a negative consequence, particularly for colon cancer, since high catenin levels, coinciding with inability of proteolytic degradation of β-catenin as in the case of mutations in TrCP1 (β-TrCP) E3 ubiquitin ligase motifs or β-catenin recruiting motifs of adenomatous polyposis coli (APC) can lead to precancerous polyps with the capacity to transform into lethal tumors (107).
However, it is important to note that concerning DKK4, there is a remarkable inconsistency in regard to its effect on WNT signaling. While many reports reveal its tumor suppressor role, it is also reported to be overexpressed in diverse cancers, corresponding to tumorigenesis and metastasis (108) including esophageal cancer (109), endometrial cancer and thyroid carcinoma (110, 111). While healthy tissue is devoid of DKKs, elevated DKK expression is found in matched tumor tissues (112) and overexpressed chemoresistant (113, 114) and metastatic xenograft models of CRC (115). Further confounding its role, a reduction in DKK4, either experimentally manipulated or inherent, corresponds to increased β-catenin-mediated transcriptional activity on target genes including Axin2 and CCND1 (116), which drive proliferation (117). While several research groups are looking into this paradox, it is believed that pro-tumoral properties of DKK may be attributable to activating a non-canonical c-Jun N-terminal kinase (JNK) signaling pathway while inhibiting the WNT-canonical pathway (118).
Future research will be required to evaluate the synergistic effects of LDHA/B inhibitors with a diverse range of drugs that target WNT signaling. C-KIT can be inhibited by drugs such as imatinib or mastinib which down-regulate stem cell markers, enhance the therapeutic efficacy of cytostatic agents (119), and prevent its role in the stroma to promote tumorigenesis, angiogenesis, proliferation and survival (120, 121).
Extracellular matrix (ECM). One of the most striking visual observations to the morphology of the knockouts was the loss of cell-cell adhesion relative to WT in both KO clones, also reflected by a significant loss of genes controlling cell-cell/cell – surface or ECM systems. Some of these included losses to ECM component genes which would otherwise play a role in cancer migration, motility and invasion, such as Anosmin 1 or Biglycan (122-125). The type of losses in ECM anchoring related genes as shown in this study (such as VCAN) could evoke the remodeling of tumor stroma matrix which is known to enable sequestration of tumor-promoting immune cells and angiogenesis (126-128). Combined with losses in desmocollin 3 (129, 130) and moesin (MSN) (131), it could then worsen EMT and metastasis (132).
In summary, this work provides an overall broad layout of the transcriptomic changes that are triggered by severe compromise to glycolysis by KO of LDHA/B or GPI genes, specific to this highly aggressive type of colon cancer. Future research will be required to clearly demarcate all plausible ergogenic pathways in tumor cells to identify a multi-target tumor-specific approach to destroy the tumor metabolic requirements.

(A) Wiki Pathway analysis of overlapping upregulated DEG changes observed in both LDHA/B DKO and GPI KO in energy pathways. The PPARGC1A differential transcript changes were as follows: WT versus LDHA/B DKO: (FC +3.43, FDR p-Value<0.001); WT versus GPI KO: (FC +3.39, FDR p-Value <0.001). (B) Wiki Pathway analysis of overlapping up-regulated DEF changes observed in both LDHA/B DKO and GPI KO in the HMG-CoA pathway. The HMGCS2 differential transcript changes were as follows: WT versus LDHA/B DKO: (FC +3.43, FDR p-Value<0.001); WT versus GPI KO: (FC +3.39, FDR p-Value<0.001). In red are the down-regulated transcripts and in green the up-regulated transcripts. Filtered by fold change <-2 or >2, p-Value<0.05.


String predicted protein-protein interactions assembled from microarray data specific to DEG down-regulated genes in the LDHA/B DKO clone set, (relative to WT controls). (A) The network nodes connected by a line represent protein-protein interactions, with colored nodes correspond to the String DB functional, molecular or pathway elements in the Table below. The interactions include direct (physical) and indirect (functional) associations; stemming from computational prediction, and knowledge of interactions aggregated from a large number of major (primary) databases. (B) The network nodes connected by a line represent protein-protein interactions, with colored nodes correspond to the String DB functional, molecular or pathway elements in the Table below. The interactions include direct (physical) and indirect (functional) associations; stemming from computational prediction, and knowledge of interactions aggregated from a large number of major (primary) databases. (C) The network nodes connected by a line represent protein-protein interactions, with colored nodes correspond to the String DB functional, molecular or pathway elements in the Table below. The interactions include direct (physical) and indirect (functional) associations; stemming from computational prediction, and knowledge of interactions aggregated from a large number of major (primary) databases. (D) The network nodes connected by a line represent protein-protein interactions, with colored nodes correspond to the String DB functional, molecular or pathway elements in the Table below. The interactions include direct (physical) and indirect (functional) associations; stemming from computational prediction, and knowledge of interactions aggregated from a large number of major (primary) databases.
Acknowledgements
This research was supported by the National Institute of Minority Health and Health Disparities of the National Institutes of Health through Grant Number G12 MD007582 and Grant Number P20 MD006738 - (Dr J. Pouyssegur's group) Research was funded by University Côte d'Azur, IRCAN, CNRS and by the Centre Scientifique de Monaco and Donation from GEMLUC.
Footnotes
↵# Present address: Faculty of Medicine, University of Montenegro, Kruševac bb, 81000 Podgorica, Montenegro.
Authors' Contributions
EM carried out the basic metabolic profiling and microarray work. RB assisted with daily tasks and consultation on experimental design and troubleshooting. NM assisted with ATP assays. KS oversaw this project from start to finish by scientific consultation, guidance, manuscript preparation and review. ZM isolated and characterized the two glycolytic-null cell lines. SC has done cell growth, viability, clonogenic assays and assisted manuscript preparation and edition. JP oversaw this collaborative project by scientific consultation, guidance and review.
This article is freely accessible online.
Availability of Data and Material
The dataset has been deposited to NIH Gene Expression Omnibus located at: https://www.ncbi.nlm.nih.gov/geo/query/acc.cgi?acc=GSE149289.
Conflicts of Interest
The Authors declare that they have no conflicts of interest.
- Received May 26, 2020.
- Revision received June 14, 2020.
- Accepted June 26, 2020.
- Copyright© 2020, International Institute of Anticancer Research (Dr. George J. Delinasios), All rights reserved
References
In this issue


Jump to section
Related Articles
Cited By...
- Loss of Nkd1 is epistatic to loss of Axin2 in regulating Wnt signaling
- Plasma GPI and PGD are associated with vascular normalization and may serve as novel prognostic biomarkers for lung adenocarcinoma: Multi-omics and multi-dimensional analysis
- Metabolic Response to the Mitochondrial Toxin 1-Methyl-4-phenylpyridinium (MPP+) in LDH-A/B Double-knockout LS174T Colon Cancer Cells