
OncoLnc: linking TCGA survival data to mRNAs, miRNAs, and lncRNAs
- Published
- Accepted
- Received
- Academic Editor
- Hsueh-Fen Juan
- Subject Areas
- Bioinformatics, Computational Biology, Databases
- Keywords
- TCGA, Cancer, RNA-SEQ, mRNA, miRNA, lncRNA, Kaplan-Meier, Cox regression, Database
- Copyright
- © 2016 Anaya
- Licence
- This is an open access article distributed under the terms of the Creative Commons Attribution License, which permits unrestricted use, distribution, reproduction and adaptation in any medium and for any purpose provided that it is properly attributed. For attribution, the original author(s), title, publication source (PeerJ Computer Science) and either DOI or URL of the article must be cited.
- Cite this article
- 2016. OncoLnc: linking TCGA survival data to mRNAs, miRNAs, and lncRNAs. PeerJ Computer Science 2:e67 https://doi.org/10.7717/peerj-cs.67
Abstract
OncoLnc is a tool for interactively exploring survival correlations, and for downloading clinical data coupled to expression data for mRNAs, miRNAs, or long noncoding RNAs (lncRNAs). OncoLnc contains survival data for 8,647 patients from 21 cancer studies performed by The Cancer Genome Atlas (TCGA), along with RNA-SEQ expression for mRNAs and miRNAs from TCGA, and lncRNA expression from MiTranscriptome beta. Storing this data gives users the ability to separate patients by gene expression, and then create publication-quality Kaplan-Meier plots or download the data for further analyses. OncoLnc also stores precomputed survival analyses, allowing users to quickly explore survival correlations for up to 21 cancers in a single click. This resource allows researchers studying a specific gene to quickly investigate if it may have a role in cancer, and the supporting data allows researchers studying a specific cancer to identify the mRNAs, miRNAs, and lncRNAs most correlated with survival, and researchers looking for a novel lncRNA involved with cancer lists of potential candidates. OncoLnc is available at http://www.oncolnc.org.
Introduction
The Cancer Genome Atlas (TCGA) provides researchers with unprecedented amounts of molecular data along with clinical and histopathological information (http://cancergenome.nih.gov/). This data set has not only led to increases in our understanding of cancer (Ciriello et al., 2013; Hoadley et al., 2014), but its scale has also allowed for previously impossible projects such as a comprehensive cataloguing of the human transcriptome (Han et al., 2014; Iyer et al., 2015). However, the size and complexity of this unique data set makes it difficult for cancer researchers to access and fully utilize.
Multiple resources exist to help researchers download or explore TCGA data (Cerami et al., 2012; Győrffy et al., 2013; Koch et al., 2015). However, a tool does not exist that focuses on survival analyses with TCGA data. Although cBioPortal (http://www.cbioportal.org/) does allow for simple Kaplan-Meier analyses for a range of TCGA cancer studies, it does not allow for more rigorous analyses with Cox regression. More importantly, the p-value obtained from a single analysis can be misleading, and it may be more informative to consider the relative strength of the correlation (Anaya et al., 2016).
Furthermore, current tools for survival analyses only allow users to view the results from one cancer at a time. This makes it difficult for a researcher to perform a comprehensive survival study with their gene of interest, and makes it possible that researchers will miss an interesting correlation. Current tools also do not allow for generation of Kaplan-Meier plots with user defined upper and lower groups, and do not allow for simple download of the survival data coupled to the expression data.
It is also important to note that the gene names used in TCGA data are outdated. While many online portals use current mRNA definitions, there is not an online data portal that uses modern miRNA definitions. This is because the TCGA Tier 3 read counts for the 5p and 3p arms are aggregated into one count for the stem-loop, which makes it difficult for researchers who want to obtain information for a specific mature miRNA.
In addition, although the role of long noncoding RNAs (lncRNAs) in cancer is beginning to be appreciated (Yarmishyn & Kurochkin, 2015), the Tier 3 TCGA mRNA files contain expression data for only the limited number of lncRNAs that were known at the initiation of the TCGA project. As a result, tools for exploring TCGA data will not contain many lncRNAs currently being studied. Although a platform has already been developed to fill this gap (Li et al., 2015), to help the scientific community study lncRNAs OncoLnc incorporates analyses and data for MiTranscriptome beta lncRNAs, http://mitranscriptome.org/, in addition to Tier 3 TCGA mRNAs and miRNAs.
Materials and Methods
Code, files, and software
All of the code necessary to reproduce Tables 1–3 and S1–S3, and therefore the data in OncoLnc, along with a limited amount of raw data and intermediate files is located at https://github.com/OmnesRes/onco_lnc. The rest of the raw data can be downloaded from https://tcga-data.nci.nih.gov/tcga/ and http://mitranscriptome.org/. This code was run with Python 2.7.5, NumPy 1.7.1, and rpy2 2.5.6, and can require upwards of 6GB of RAM. OncoLnc runs on Django 1.8.2, Python 2.7, matplotlib 1.2.1, NumPy 1.7.1, rpy2 2.5.6, uses the SQLite3 database engine, and utilizes Bootstrap CSS and JavaScript, and Font Awesome icons.
| Cancer | Patients | Male/Female | Age at diagnosis | Events | Median survival | Genes in OncoLnc |
|---|---|---|---|---|---|---|
| BLCA | 403 | 296/107 | 68.03 | 177 | 1,008 | 16,339 |
| BRCA | 1,006 | 11/995 | 58.34 | 135 | 3,941 | 16,602 |
| CESC | 264 | 0/264 | 48.23 | 59 | 4,086 | 16,330 |
| COAD | 440 | 235/205 | 66.58 | 85 | NA | 16,378 |
| ESCA | 144 | 126/18 | 60.51 | 59 | 801 | 16,790 |
| GBM | 152 | 99/53 | 59.84 | 27 | 1,426 | 16,783 |
| HNSC | 497 | 364/133 | 61.24 | 207 | 1,732 | 16,614 |
| KIRC | 523 | 341/182 | 60.56 | 167 | 2,764 | 16,638 |
| KIRP | 285 | 210/75 | 61.45 | 44 | NA | 16,399 |
| LAML | 151 | 81/70 | 54.40 | 92 | 577 | 15,227 |
| LGG | 510 | 282/228 | 43.02 | 124 | 2,835 | 16,781 |
| LIHC | 360 | 244/116 | 59.41 | 126 | 1,694 | 15,824 |
| LUAD | 492 | 225/267 | 65.32 | 176 | 1,492 | 16,748 |
| LUSC | 489 | 362/127 | 67.23 | 169 | 2,224 | 16,942 |
| OV | 294 | 0/294 | 59.19 | 42 | NA | 16,893 |
| PAAD | 175 | 96/79 | 64.37 | 92 | 607 | 17,177 |
| READ | 159 | 88/71 | 64.58 | 22 | NA | 16,472 |
| SARC | 259 | 118/141 | 60.71 | 98 | 1,991 | 16,197 |
| SKCM | 459 | 284/175 | 58.14 | 215 | 2,454 | 16,030 |
| STAD | 379 | 247/132 | 65.49 | 146 | 1,043 | 16,885 |
| UCEC | 541 | 0/541 | 63.95 | 90 | NA | 16,670 |
| Cancer | Patients | Male/Female | Age at diagnosis | Events | Median survival | Genes in OncoLnc |
|---|---|---|---|---|---|---|
| BLCA | 404 | 297/107 | 68.02 | 177 | 1,036 | 512 |
| BRCA | 988 | 11/977 | 58.35 | 131 | 3,941 | 479 |
| CESC | 267 | 0/267 | 48.27 | 59 | 4,086 | 501 |
| COAD | 426 | 226/200 | 66.48 | 84 | NA | 476 |
| ESCA | 144 | 125/19 | 60.61 | 59 | 801 | 494 |
| GBM | 561 | 343/218 | 57.94 | 67 | 2,648 | 507 |
| HNSC | 501 | 363/138 | 61.30 | 208 | 1,732 | 514 |
| KIRC | 506 | 331/175 | 60.48 | 165 | 2,764 | 448 |
| KIRP | 286 | 210/76 | 61.52 | 44 | NA | 430 |
| LAML | 164 | 88/76 | 54.05 | 100 | 518 | 374 |
| LGG | 506 | 278/228 | 43.07 | 123 | 2,660 | 486 |
| LIHC | 362 | 248/114 | 59.41 | 125 | 1,791 | 485 |
| LUAD | 490 | 226/264 | 65.35 | 175 | 1,492 | 493 |
| LUSC | 467 | 346/121 | 67.43 | 160 | 2,224 | 519 |
| OV | 470 | 0/470 | 59.85 | 92 | 3,128 | 467 |
| PAAD | 175 | 96/79 | 64.37 | 92 | 607 | 494 |
| READ | 154 | 84/70 | 64.23 | 22 | NA | 495 |
| SARC | 259 | 119/140 | 60.85 | 98 | 1,991 | 455 |
| SKCM | 438 | 271/167 | 58.01 | 207 | 2,470 | 535 |
| STAD | 400 | 260/140 | 65.54 | 155 | 1,043 | 495 |
| UCEC | 534 | 0/534 | 63.91 | 87 | NA | 518 |
| Cancer | Patients | Male/Female | Age at diagnosis | Events | Median survival | Genes in OncoLnc |
|---|---|---|---|---|---|---|
| BLCA | 120 | 86/34 | 67.37 | 61 | 706 | 4,322 |
| BRCA | 766 | 8/758 | 58.03 | 111 | 3,941 | 4,708 |
| CESC | 106 | 0/106 | 48.22 | 26 | 3,046 | 4,493 |
| COAD | 117 | 52/65 | 69.64 | 24 | NA | 3,302 |
| GBM | 144 | 94/50 | 59.56 | 24 | 1,426 | 4,524 |
| HNSC | 288 | 211/77 | 61.40 | 133 | 1,762 | 4,314 |
| KIRC | 457 | 299/158 | 60.75 | 156 | 2,764 | 5,191 |
| KIRP | 73 | 51/22 | 59.78 | 17 | NA | 4,627 |
| LAML | 20 | 15/5 | 54.75 | 10 | 580 | 3,940 |
| LGG | 217 | 123/94 | 42.82 | 65 | 2,660 | 4,875 |
| LIHC | 65 | 40/25 | 60.97 | 41 | 1,005 | 3,610 |
| LUAD | 320 | 148/172 | 65.72 | 118 | 1,357 | 4,636 |
| LUSC | 330 | 244/86 | 67.16 | 112 | 2,284 | 4,979 |
| OV | 369 | 0/369 | 59.63 | 69 | 3,128 | 4,901 |
| READ | 42 | 22/20 | 66.67 | 8 | 1,581 | 3,310 |
| SKCM | 255 | 159/96 | 56.82 | 148 | 2,192 | 3,893 |
| STAD | 148 | 93/55 | 65.72 | 56 | 940 | 4,619 |
| UCEC | 274 | 0/274 | 63.12 | 39 | NA | 3,706 |
Cox models
Multivariate Cox regressions were performed with the coxph function from the R survival library. For each cancer and data type an attempt was made to construct a model with gene expression, sex, age, and grade or histology as multivariates. However, not every cancer contained complete grade information, and some cancers did not contain different grades. As a result, grade was not able to be included in every model. Cancers which have grade in the model are BLCA, BRCA, CESC, ESCA, HNSC, KIRC, LGG, LIHC, OV, PAAD, STAD, and UCEC. Cancers with grade missing from the model include COAD, GBM, KIRP, LAML, LUAD, LUSC, READ, SARC, and SKCM. When grade is available each grade is listed as a separate term in the models and is either 1 or 0. Similarly, sex is also listed in the models as 1 or 0. Gene expression is inverse normal transformed before inclusion into the models, except for the GBM miRNA data, which was normalized microarray data. Age is listed in the models as is. The multivariate model run for each cancer and each data type is listed at the top of Tables S1–S3, and the code for running all of the Cox regressions is present in the GitHub repository: https://github.com/OmnesRes/onco_lnc.
All the clinical data was downloaded from https://tcga-data.nci.nih.gov/tcga/ January 5th and 6th, 2016. Cancers were chosen for the study based on the quality and amount of overall survival data. It is possible for a cancer such as PRAD to have a large amount of survival information, but a low number of events (deaths), making a survival analysis difficult. The Tier 3 mRNA and miRNA data was also downloaded from https://tcga-data.nci.nih.gov/tcga/, while the MiTranscriptome data was downloaded from http://mitranscriptome.org/. Definitions for miRNAs were downloaded from http://www.mirbase.org/.
For each cancer, only patients who contained all the necessary clinical information were included in the analysis. In addition, patients had to have a follow up time or time to death greater than 0 days. For each cancer, only genes which met an expression cutoff were included in the analysis (see below for more details). In general, only primary solid tumors were included in analyses, and this is implemented by only using samples with “01” in the patient barcode. The exceptions are LAML, which is a blood derived cancer, and therefore has the designation “03,” and SKCM, which contains primarily metastatic tumors, and therefore designations “01” and “06” were allowed for SKCM analyses. It is possible for a patient to have more than one sequencing file, and in these cases the counts were averaged.
Results
Overview of OncoLnc
OncoLnc stores over 400,000 analyses, which includes Cox regression results as well as mean and median expression of each gene. For the Cox regression results, in addition to p-values, OncoLnc stores the rank of the correlation. Different cancers contain very different p-value distributions (Anaya et al., 2016; Yang et al., 2014), and it is unclear what causes this difference. As a result, using one p-value cutoff across cancers is not possible, and the rank of the correlation is a simple way to measure the relative strength of the correlation. The rank is calculated per cancer, per data type. Tables 1–3 contain information about how many genes there are for each cancer and each data type.
The mRNA and miRNA identifiers used by TCGA are out of date, and the identifiers in OncoLnc have been manually curated using NCBI Gene: http://www.ncbi.nlm.nih.gov/gene, and recent miRBase definitions: http://www.mirbase.org/. Over 2,000 mRNA symbols were updated, and these are listed in Table S4. Genes which have had their Entrez Gene ID removed from NCBI Gene, or could not be confidently mapped to a single identifier, are not included in OncoLnc but are still included in Table S1.
Using OncoLnc is very straightforward. The preferred method of using OncoLnc is to submit a gene at the home page, and this submission is not case sensitive. If a user submits a gene not in the database, they will be notified and provided with links to all the possible gene names and IDs. Submission of a valid gene identifier will return correlation results for up to 21 cancers for mRNAs and miRNAs, or 18 cancers for MiTranscriptome beta lncRNAs (Fig. 1). If a gene does not meet the expression cutoff for the analysis, it will not be present in the database, and therefore a user may receive less than the maximum possible number of results. For users using OncoLnc on smaller devices, it is possible to perform a single cancer search. The link for this search is on the home page, and the user must submit the TCGA cancer abbreviation along with the gene of interest.
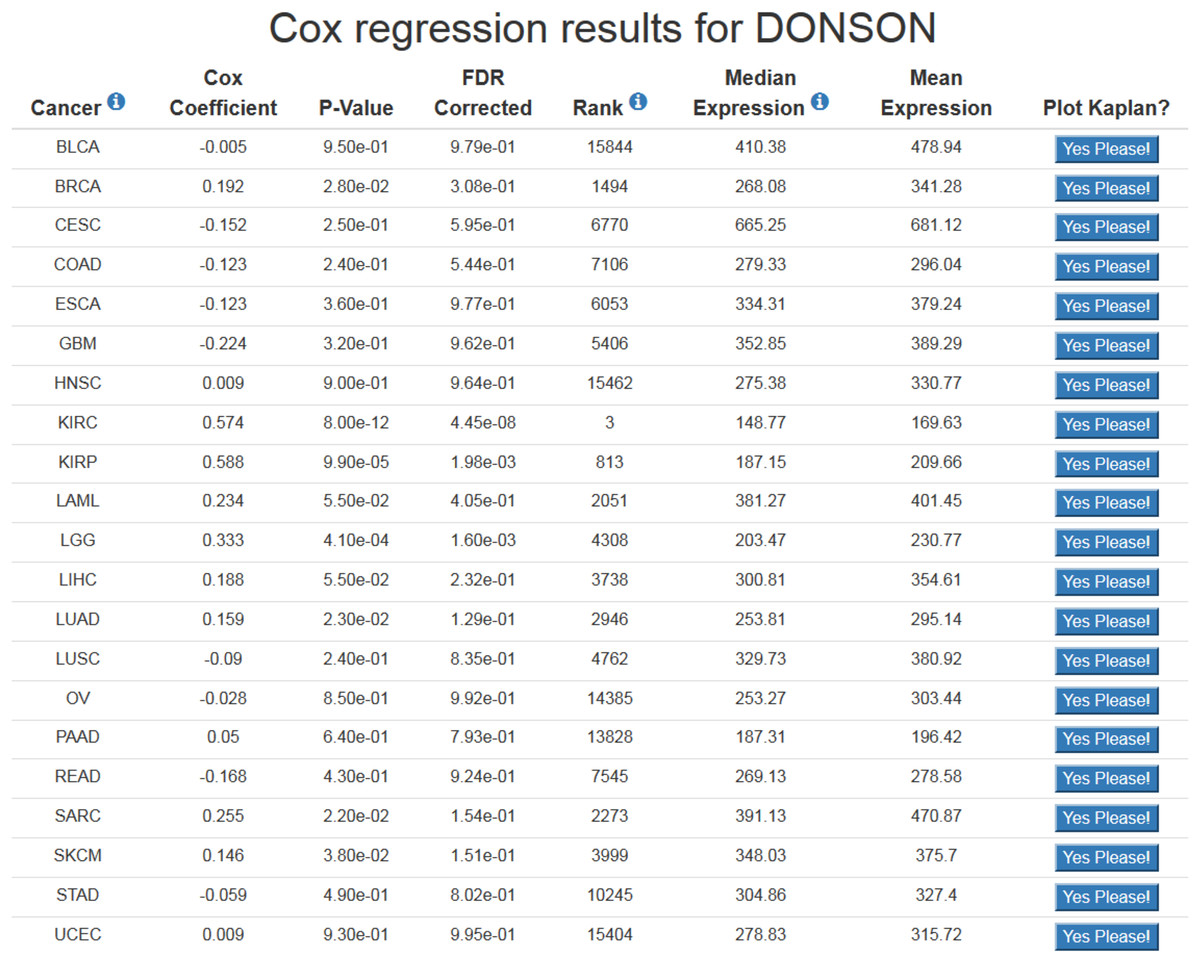
Figure 1: Example of OncoLnc search results.
The Cox coefficient and p-value are from the gene term in precomputed multivariate Cox regressions. The FDR correction is performed per cancer analysis per data type, and in this example the correction would have involved around 16,000 genes for each cancer. The rank is also performed per cancer per data type. In this example DONSON is the 3rd most highly correlated gene in KIRC.
At the results page is a link to perform a Kaplan-Meier analysis for each cancer (Fig. 1). The user will be asked how they would like to divide the patients. Patients can be split into any non-overlapping upper and lower slices, for example upper 25 percent and lower 25 percent. Upon submission users will be presented with a PNG Kaplan-Meier plot, a logrank p-value for the analysis, and text boxes with the data that was plotted (Fig. 2). If a user simply wants all the data for that cancer and that gene, the user can submit 100 for “Lower Percentile,” and 0 for “Upper Percentile.”
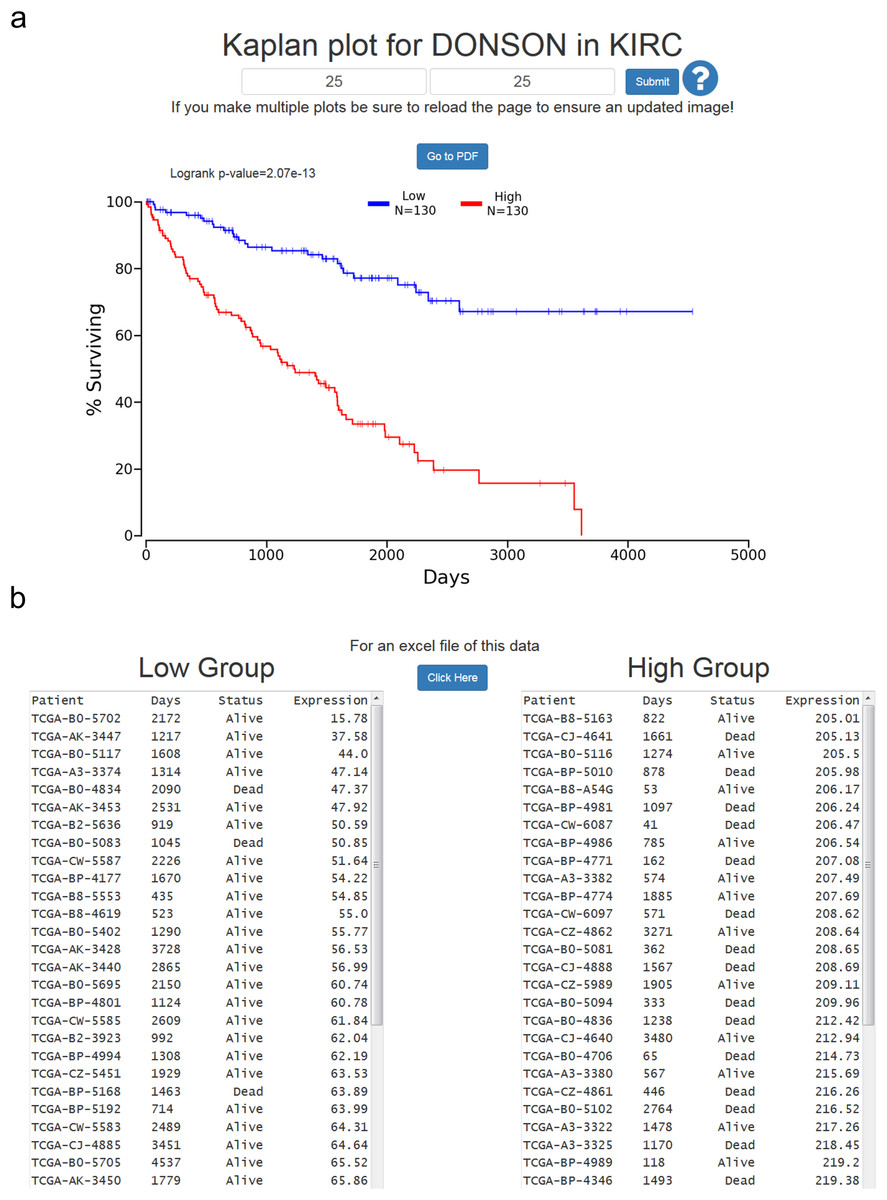
Figure 2: Example of OncoLnc Kaplan-Meier results.
(A) Submitting non-overlapping percentiles will return a logrank p-value for the analysis and a PNG image with the option to generate a PDF of the plot. (B) Below the Kaplan-Meier image will be the data that was plotted along with an option to download a CSV file.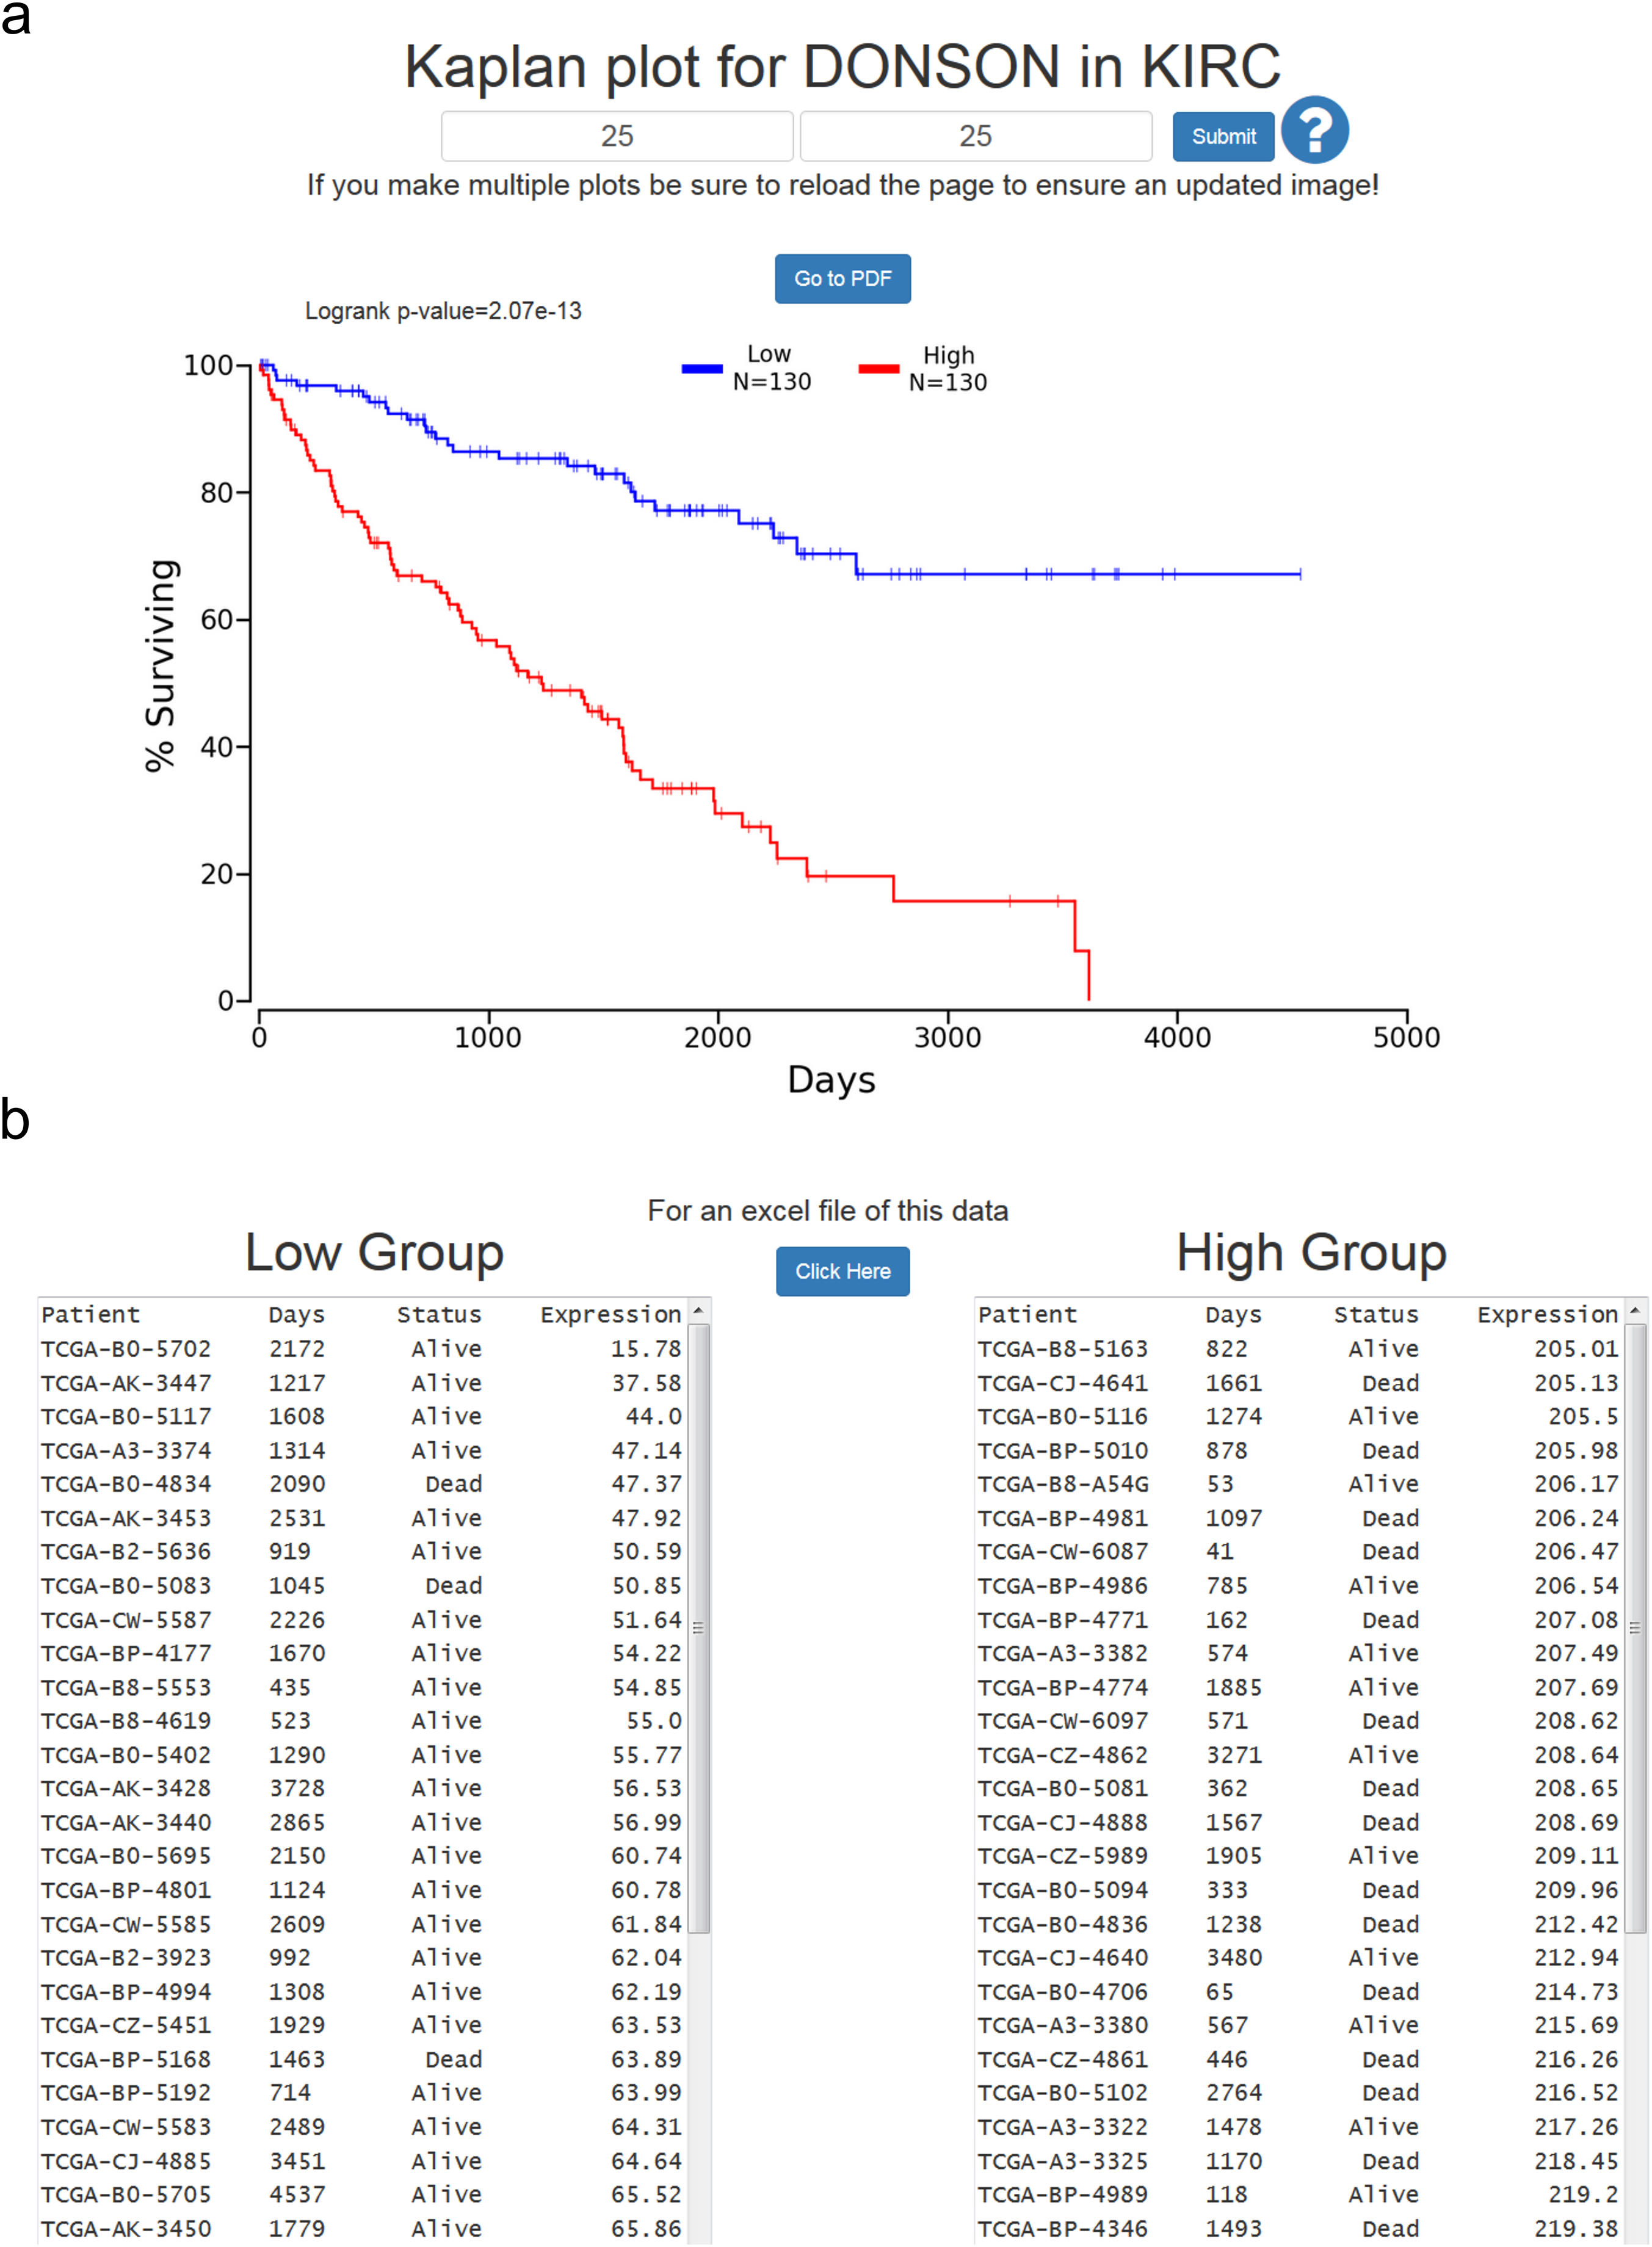
Users then have the option to either go to a PDF of the Kaplan-Meier plot, or download a CSV file of the data plotted. In both cases the file name will be the cancer, gene ID, lower percentile, upper percentile, separated by underscores. Gene ID had to be used instead of gene name because there are multiple HUGO gene symbol conflicts between TCGA Tier 3 mRNAs and MiTranscriptome beta, as well as between TCGA mRNA HUGO gene symbols and updated mRNA HUGO gene symbols. In the case that a user performs a search for a name with a conflict, OncoLnc presents a warning message and instructs the user how to proceed.
mRNAs
Table 1 contains information about the patients for each Tier 3 mRNA study included in OncoLnc, and how many gene analyses are present in OncoLnc for each study. Tier 3 RNASeqV2 was used for all 21 cancers, and expression was taken from the “rsem.genes.normalized_results” files. As a result, the expression data in OncoLnc for Tier 3 mRNAs is in normalized RSEM values. Table 1 contains different numbers of genes for the different cancers because an expression cutoff was used to determine if a gene would be included in the analysis. For mRNAs this cutoff was a median expression greater than 1 RSEM, and less than a fourth of the patients with an expression of 0.
The results of every Tier 3 mRNA Cox regression performed are included in Table S1. The Tier 3 expression files contain both a HUGO gene symbol and Entrez Gene ID for each gene, but these IDs and gene symbols are not current. To update the gene symbols I downloaded every human gene from NCBI Gene, and updated any symbol for which the Entrez Gene ID was still current. For genes that had deleted or changed Entrez Gene IDs I had to manually curate the Gene IDs and gene symbols. Genes which I could not confidently assign to a modern ID are not included in OncoLnc, but are still included in Table S1. Table S1 includes the original TCGA IDs and symbols along with the updated names and symbols, and Table S4 lists genes which had either the symbol or ID changed. OncoLnc allows users to search mRNAs using either an updated HUGO gene symbol or Entrez Gene ID.
miRNAs
Table 2 contains information about the patients for each Tier 3 miRNA study included in OncoLnc, and how many gene analyses are present in OncoLnc for each study. Tier 3 miRNASeq was used for every cancer except GBM, which only had microarray data available. The results of every Cox regression performed are included in Table S2. Many of the miRBase IDs, or possibly read counts, present in Table S2 and OncoLnc will be different from the IDs and read counts in TCGA data files and available at other data portals for TCGA data. This is because I went through each expression file and updated the IDs and read counts.
The “isoform.quantification” files contain both miRBase IDs as well accession numbers. In these files the 5p and 3p arms of miRNAs are referred to with the same ID, for example hsa-let-7b-5p and hsa-let-7b-3p would both be listed as hsa-let-7b. In order to update the names and read counts for the Tier 3 miRNAs I used the read counts assigned to each accession number to obtain reads per million miRNAs mapped for each accession number, and updated the ID with the current miRBase ID. When an accession number was not available I used the genomic coordinates provided to identify the accession number, and therefore ID. GBM names were updated using the “aliases” file from the miRBase FTP site, and if an alias could not be confidently identified the miRNA was not included in OncoLnc, but is still in Table S2.
As a result, all expression values in Table S2 and in OncoLnc are reads per million miRNA mapped for every cancer except GBM, which are microarray normalized values. The numbers of miRNAs in Table 2 differ because the miRNA may not have been in the expression files for that cancer, or may not have met the expression cutoff. An expression cutoff of a median of .5 reads per million miRNA mapped, and less than one fourth of the patients with 0 expression was used. OncoLnc allows users to search for miRNAs with either a miRBase version 21 mature accession number or ID.
lncRNAs
Table 3 contains information about the patients for each MiTranscriptome beta lncRNA analysis, along with how many lncRNAs are included in OncoLnc for each cancer. Normalized lncRNA counts were downloaded from http://mitranscriptome.org/, and these were mapped to patient barcodes using the library information provided. MiTranscriptome beta contains over 8,000 of the most differentially expressed lncRNAs in the entire MiTranscriptome dataset, but the actual number of lncRNAs in OncoLnc for each cancer is far fewer due to the expression cutoff used: a median of .1 normalized counts, and less than a fourth of patients with 0 expression. Table S3 contains every lncRNA Cox regression performed, and these are all included in OncoLnc. OncoLnc allows users to search for MiTranscriptome beta lncRNAs using either a name or transcript ID.
Discussion
Depending on the researcher, OncoLnc should be used in different ways. If a researcher is studying a specific gene and looking for a cancer association, they should go to http://www.oncolnc.org and perform a search with their gene of interest. Instead of focusing on p-values, I would focus more on the rank of the correlations for the different cancers, and also on the sign of the Cox coefficients. A positive Cox coefficient indicates high expression of the gene increases the risk of death, while a negative Cox coefficient indicates the opposite. A gene with a high rank in multiple cancers (indicated by a low number, 1 being the best), and Cox coefficients with the same sign could be very interesting. It is also important to look at the level of expression of the gene. Different genes obviously require different levels of expression to exert their effects, but genes with expression near 0 should be dealt with caution. In addition, users can investigate the range of expression of the gene at the Kaplan-Meier plotting page. Genes that have large fold increases from the low expression to high expression group could be interesting candidates.
A researcher studying a specific cancer should download Tables S1–S3 to see which mRNAs, miRNAs, and lncRNAs are most correlated to survival for their cancer. Once they identify some genes of interest they can go to http://www.oncolnc.org to perform further analyses such as checking the range of expression of the gene, or if it is associated with survival in other cancers. Similarly, bioinformaticians looking to perform large scale analyses of prognostic genes can use these tables as a starting point, or if a user wants to change the Cox models they can use the GitHub code to alter the models.
The importance of the ability to perform survival correlations with lncRNAs must be emphasized. There are multiple techniques for identifying protein coding genes that are involved in cancer because mutations that occur in protein coding genes can result in missense mutations, and methods have been developed for identifying which of these mutations are drivers as opposed to simply passengers (Carter et al., 2009; Kaminker et al., 2007; Youn & Simon, 2011). In contrast, because it is unclear how mutations will affect lncRNA function, methods to identify lncRNAs involved in cancer must rely on lncRNA expression. As a result, OncoLnc is one of the few resources available for finding lncRNAs involved in cancer, and if a lncRNA researcher is searching for a novel lncRNA to study, Table S3 would be a good place to start.
Compared to microarrays, RNA-SEQ is a relatively unproven technology for identifying prognostic genes. However, I previously performed a pan-cancer analysis of prognostic genes that used RNA-SEQ data and provided consistent groupings of cancers and identified interesting cancer biology (Anaya et al., 2016). For example, in my analysis EGF signaling was strongly associated with survival in LUSC, and EGFR inhibitors have been shown to be effective in LUSC patients despite EGFR mutations being rare in this cancer (Chiu et al., 2014). Although examples such as this are assuring, when using OncoLnc it is important to remember that the correlations observed, regardless of p-value, are still only correlations. Perhaps the largest limitation of OncoLnc is that the Cox models do not account for intra-cancer subtypes. For example, GBM and BRCA both have well-established subtypes (Brennan et al., 2013; Perou et al., 2000). If the expression of a gene correlates with cancer subtypes, and those subtypes correlate with survival, subtype would be a confounding variable. As subtype definitions for the different cancers improve a future version of OncoLnc may be able to incorporate the subtypes in the Cox models.
An analysis is only as good as the data available, and the Tier 3 TCGA RNA-SEQ analyses were performed with outdated software and transcript information. There have been some attempts to reanalyze both the TCGA mRNA RNA-SEQ data and miRNA-SEQ data (Kuo et al., 2015; Rahman et al., 2015). In the event that TCGA or the scientific community releases a gold standard analysis of TCGA data, a future version of OncoLnc could incorporate this data.
Current data portals for TCGA data only allow users to view the results for one cancer at a time, may or may not offer Cox regression results, do not allow for complete control over separating patients during Kaplan-Meier analysis, and do not allow for download of the data used in the analysis. To my knowledge OncoLnc is the only online resource for TCGA data that includes these features, is the only resource that uses modern gene definitions for TCGA mRNA and miRNA data, and is the only resource for survival analysis of MiTranscriptome beta lncRNAs. In addition, current methods for survival analysis rely on a p-value cutoff of .05 for significance, which may lead to either the study of genes not actually correlated with survival or missing genes that are correlated with survival depending on the cancer. By storing the results of the correlation for every gene, OncoLnc can provide a context for the significance of a correlation. As a result, used correctly OncoLnc can not only increase the sensitivity of finding genes involved in cancer, but also the specificity. This combination of ease of use, results for complex analyses, and tools for exploring and downloading data make OncoLnc an invaluable resource for cancer researchers.