
Bioinformatic Prediction of Signaling Pathways for Apurinic/Apyrimidinic Endodeoxyribonuclease 1 (APEX1) and Its Role in Cholangiocarcinoma Cells

 and
and 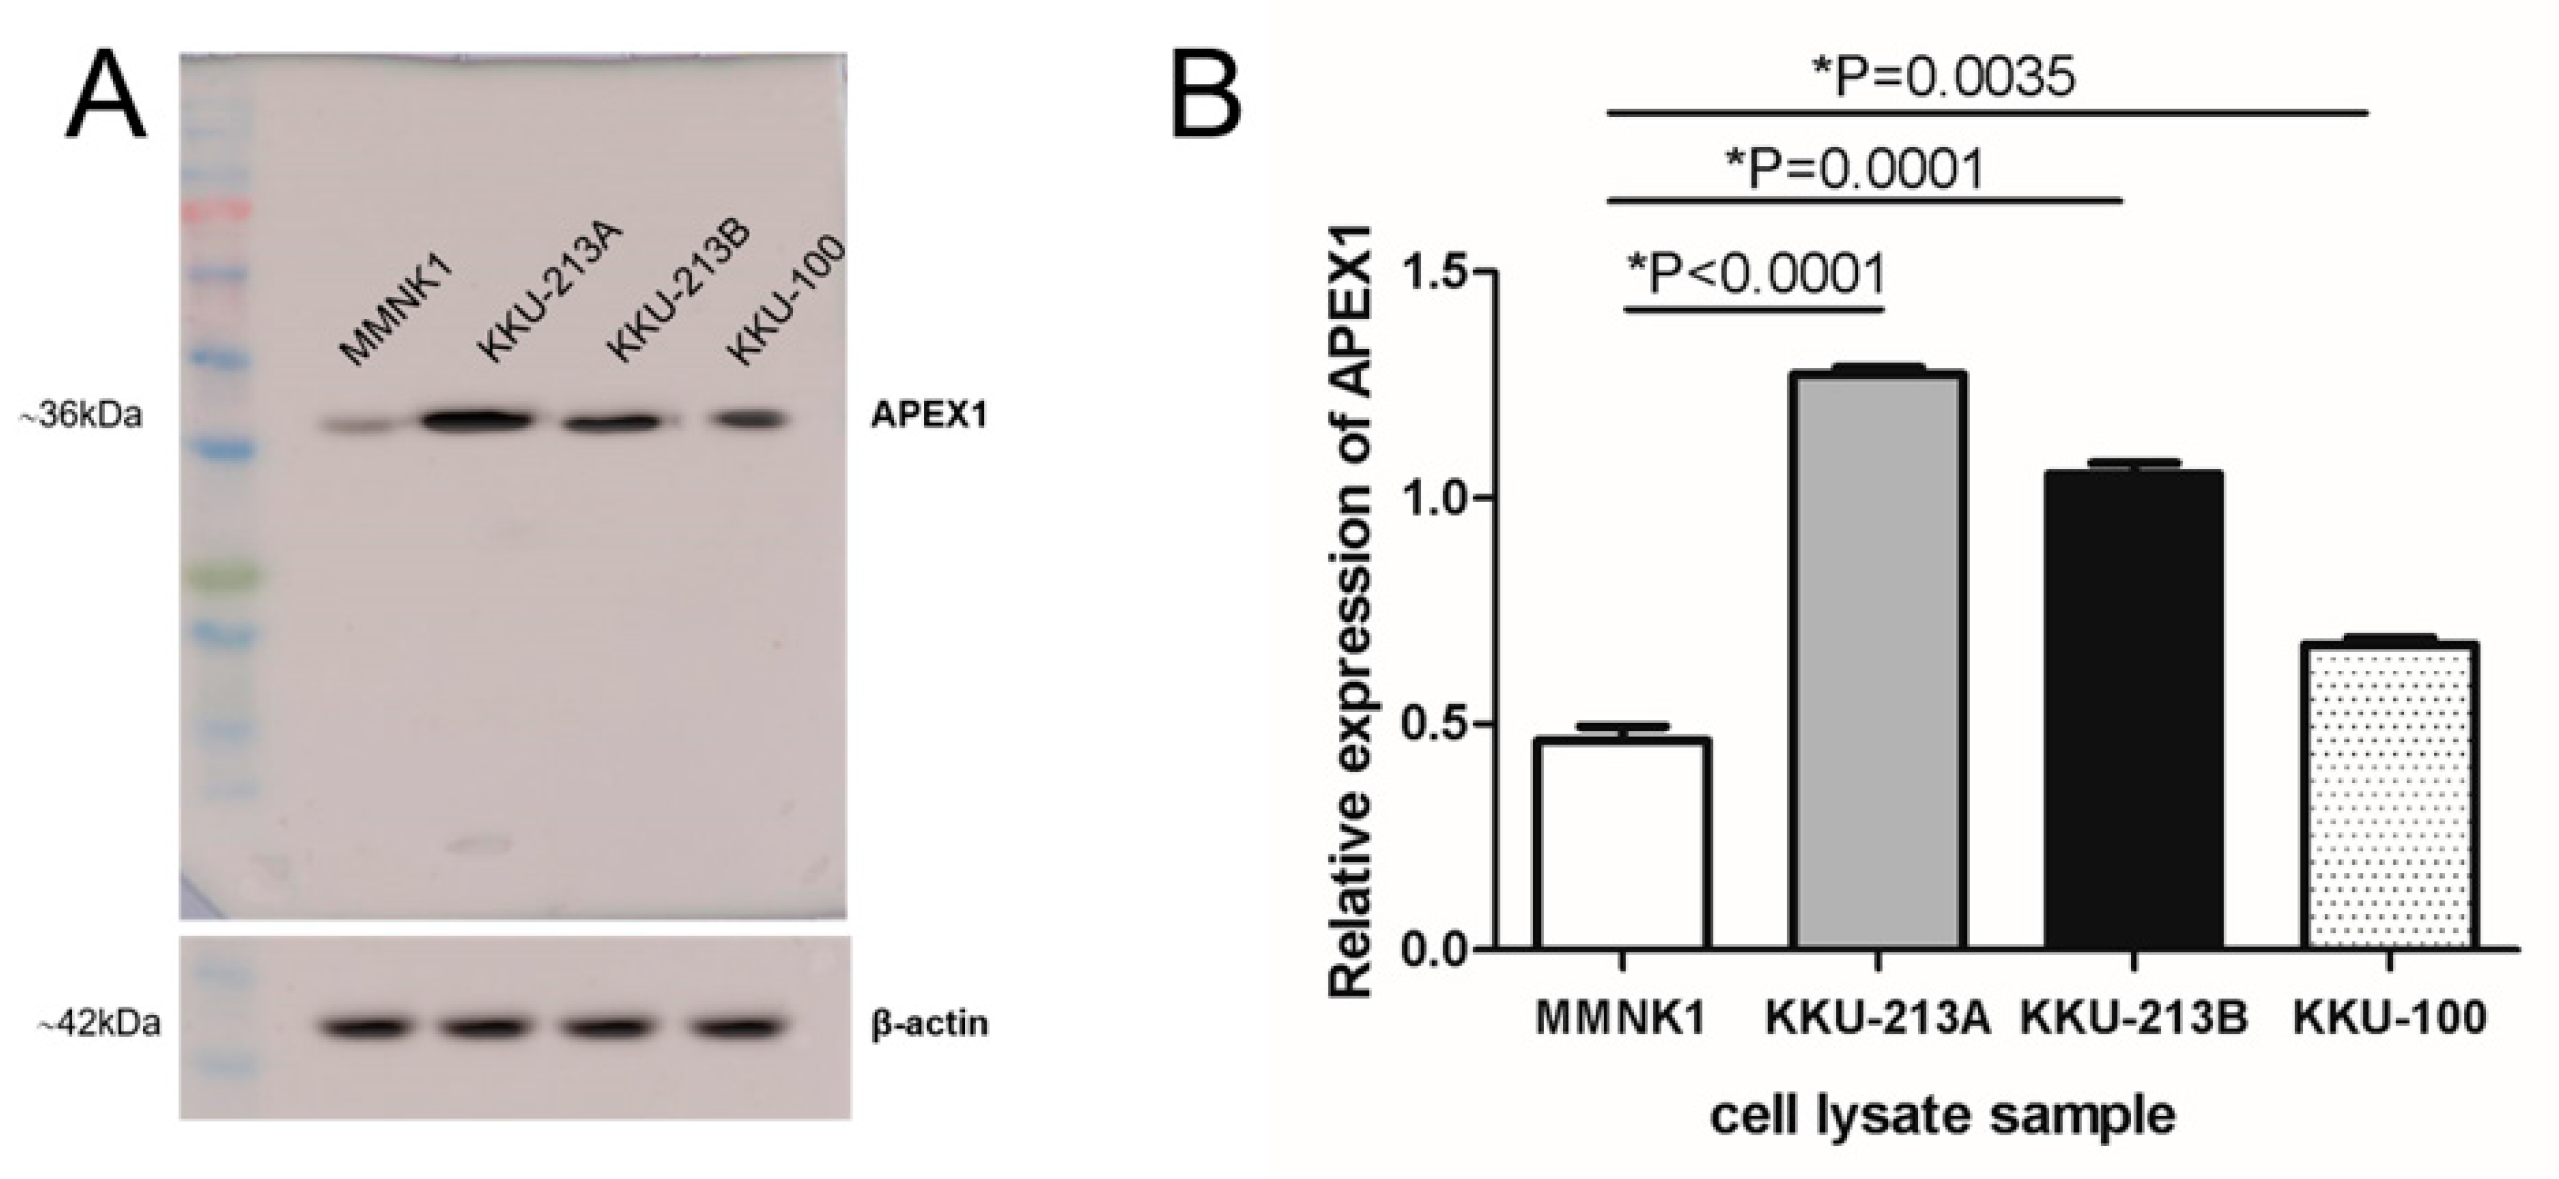
Abstract
:1. Introduction
2. Results
2.1. Expression of APEX1 in Cell Lines
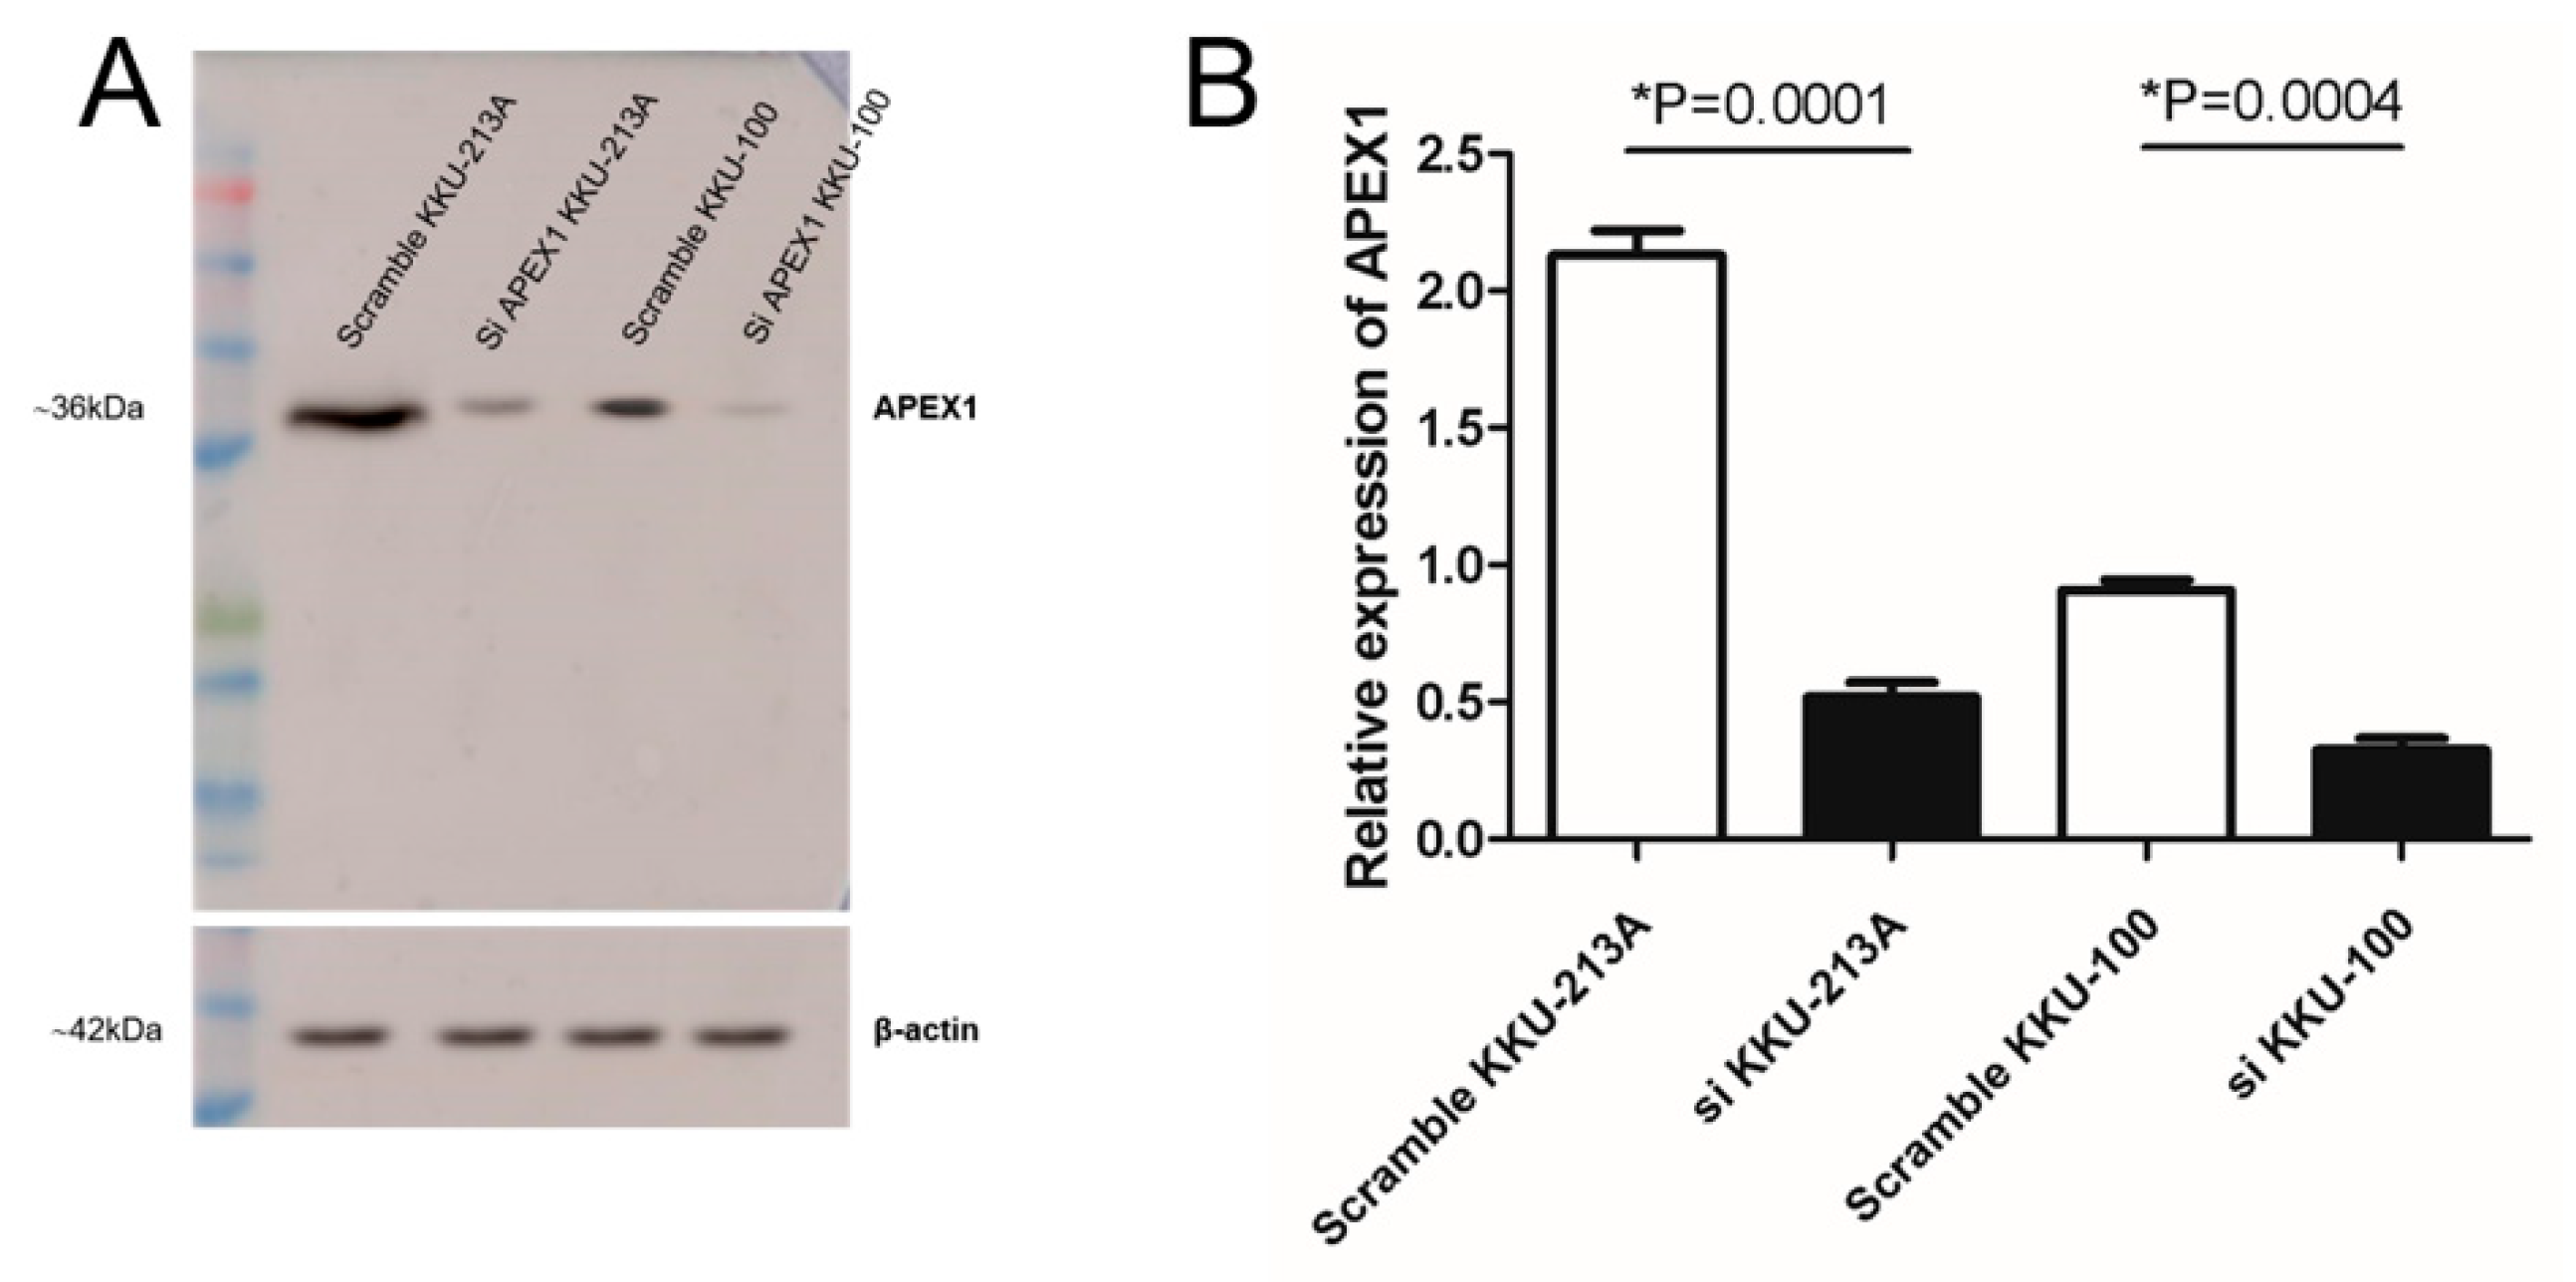
2.2. Silencing of APEX1 in CCA Cell Lines
2.3. Protein Expression Patterns of APEX1-Gene-Silenced and Scramble-Treated KKU-213A and KKU-100 Cell Lines
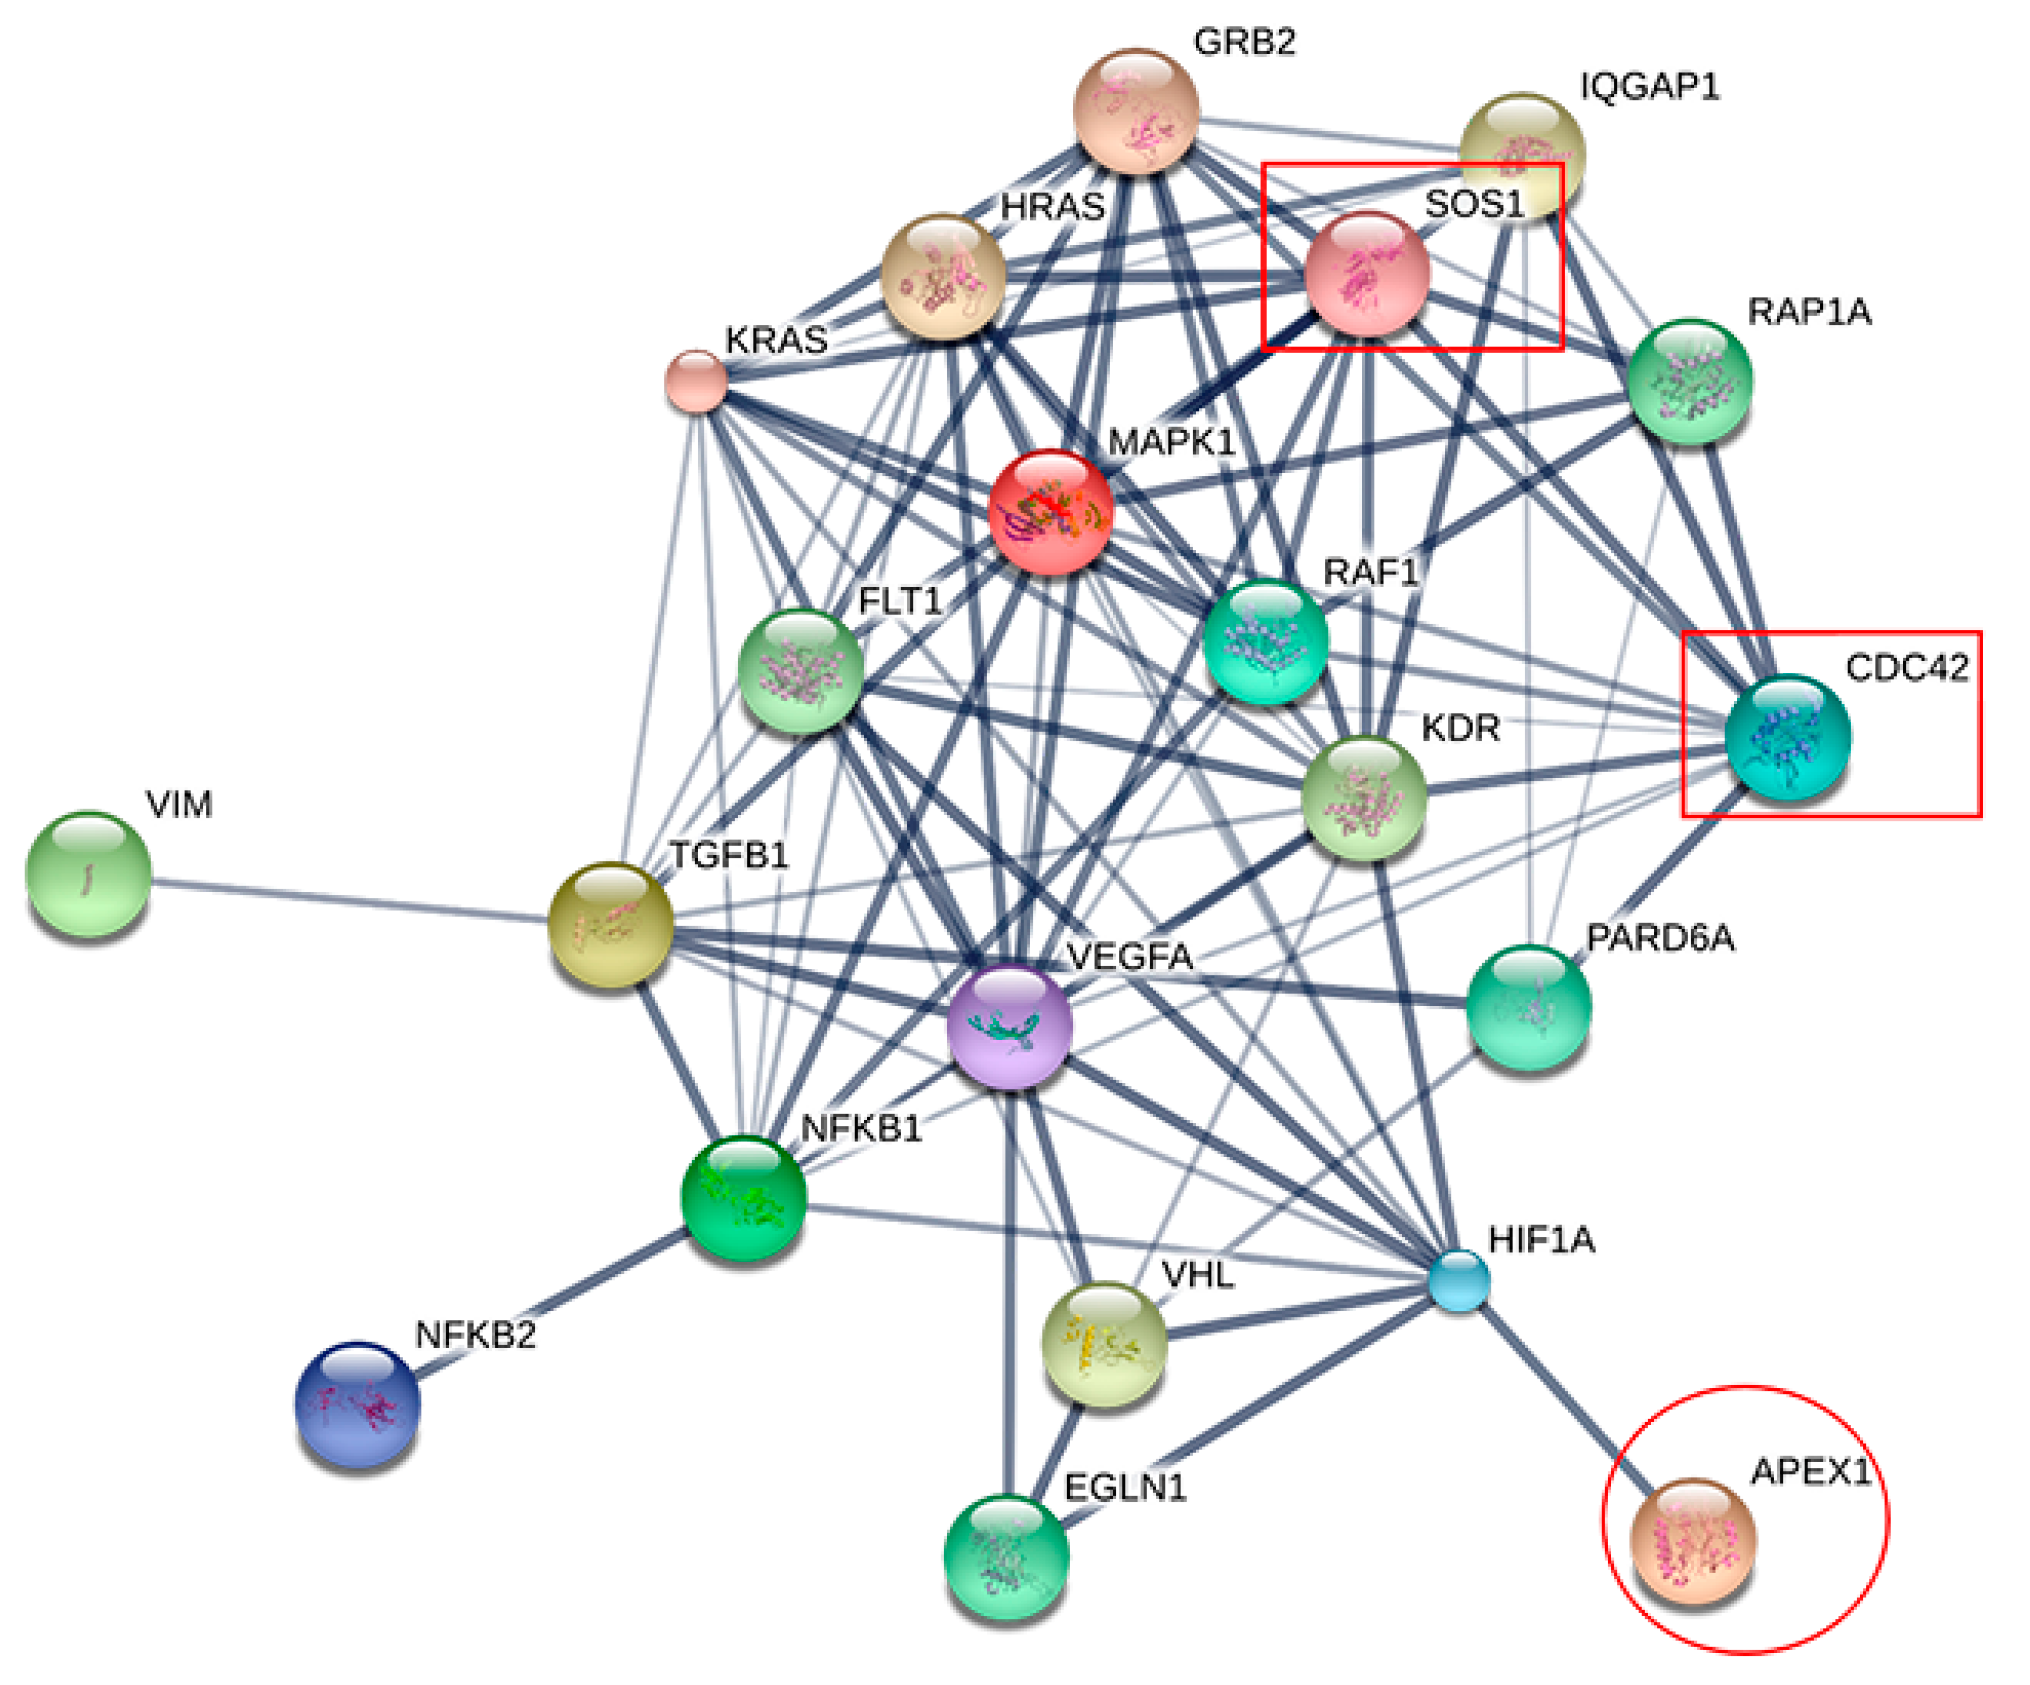
2.4. Prediction of APEX1-Related Signaling Pathway
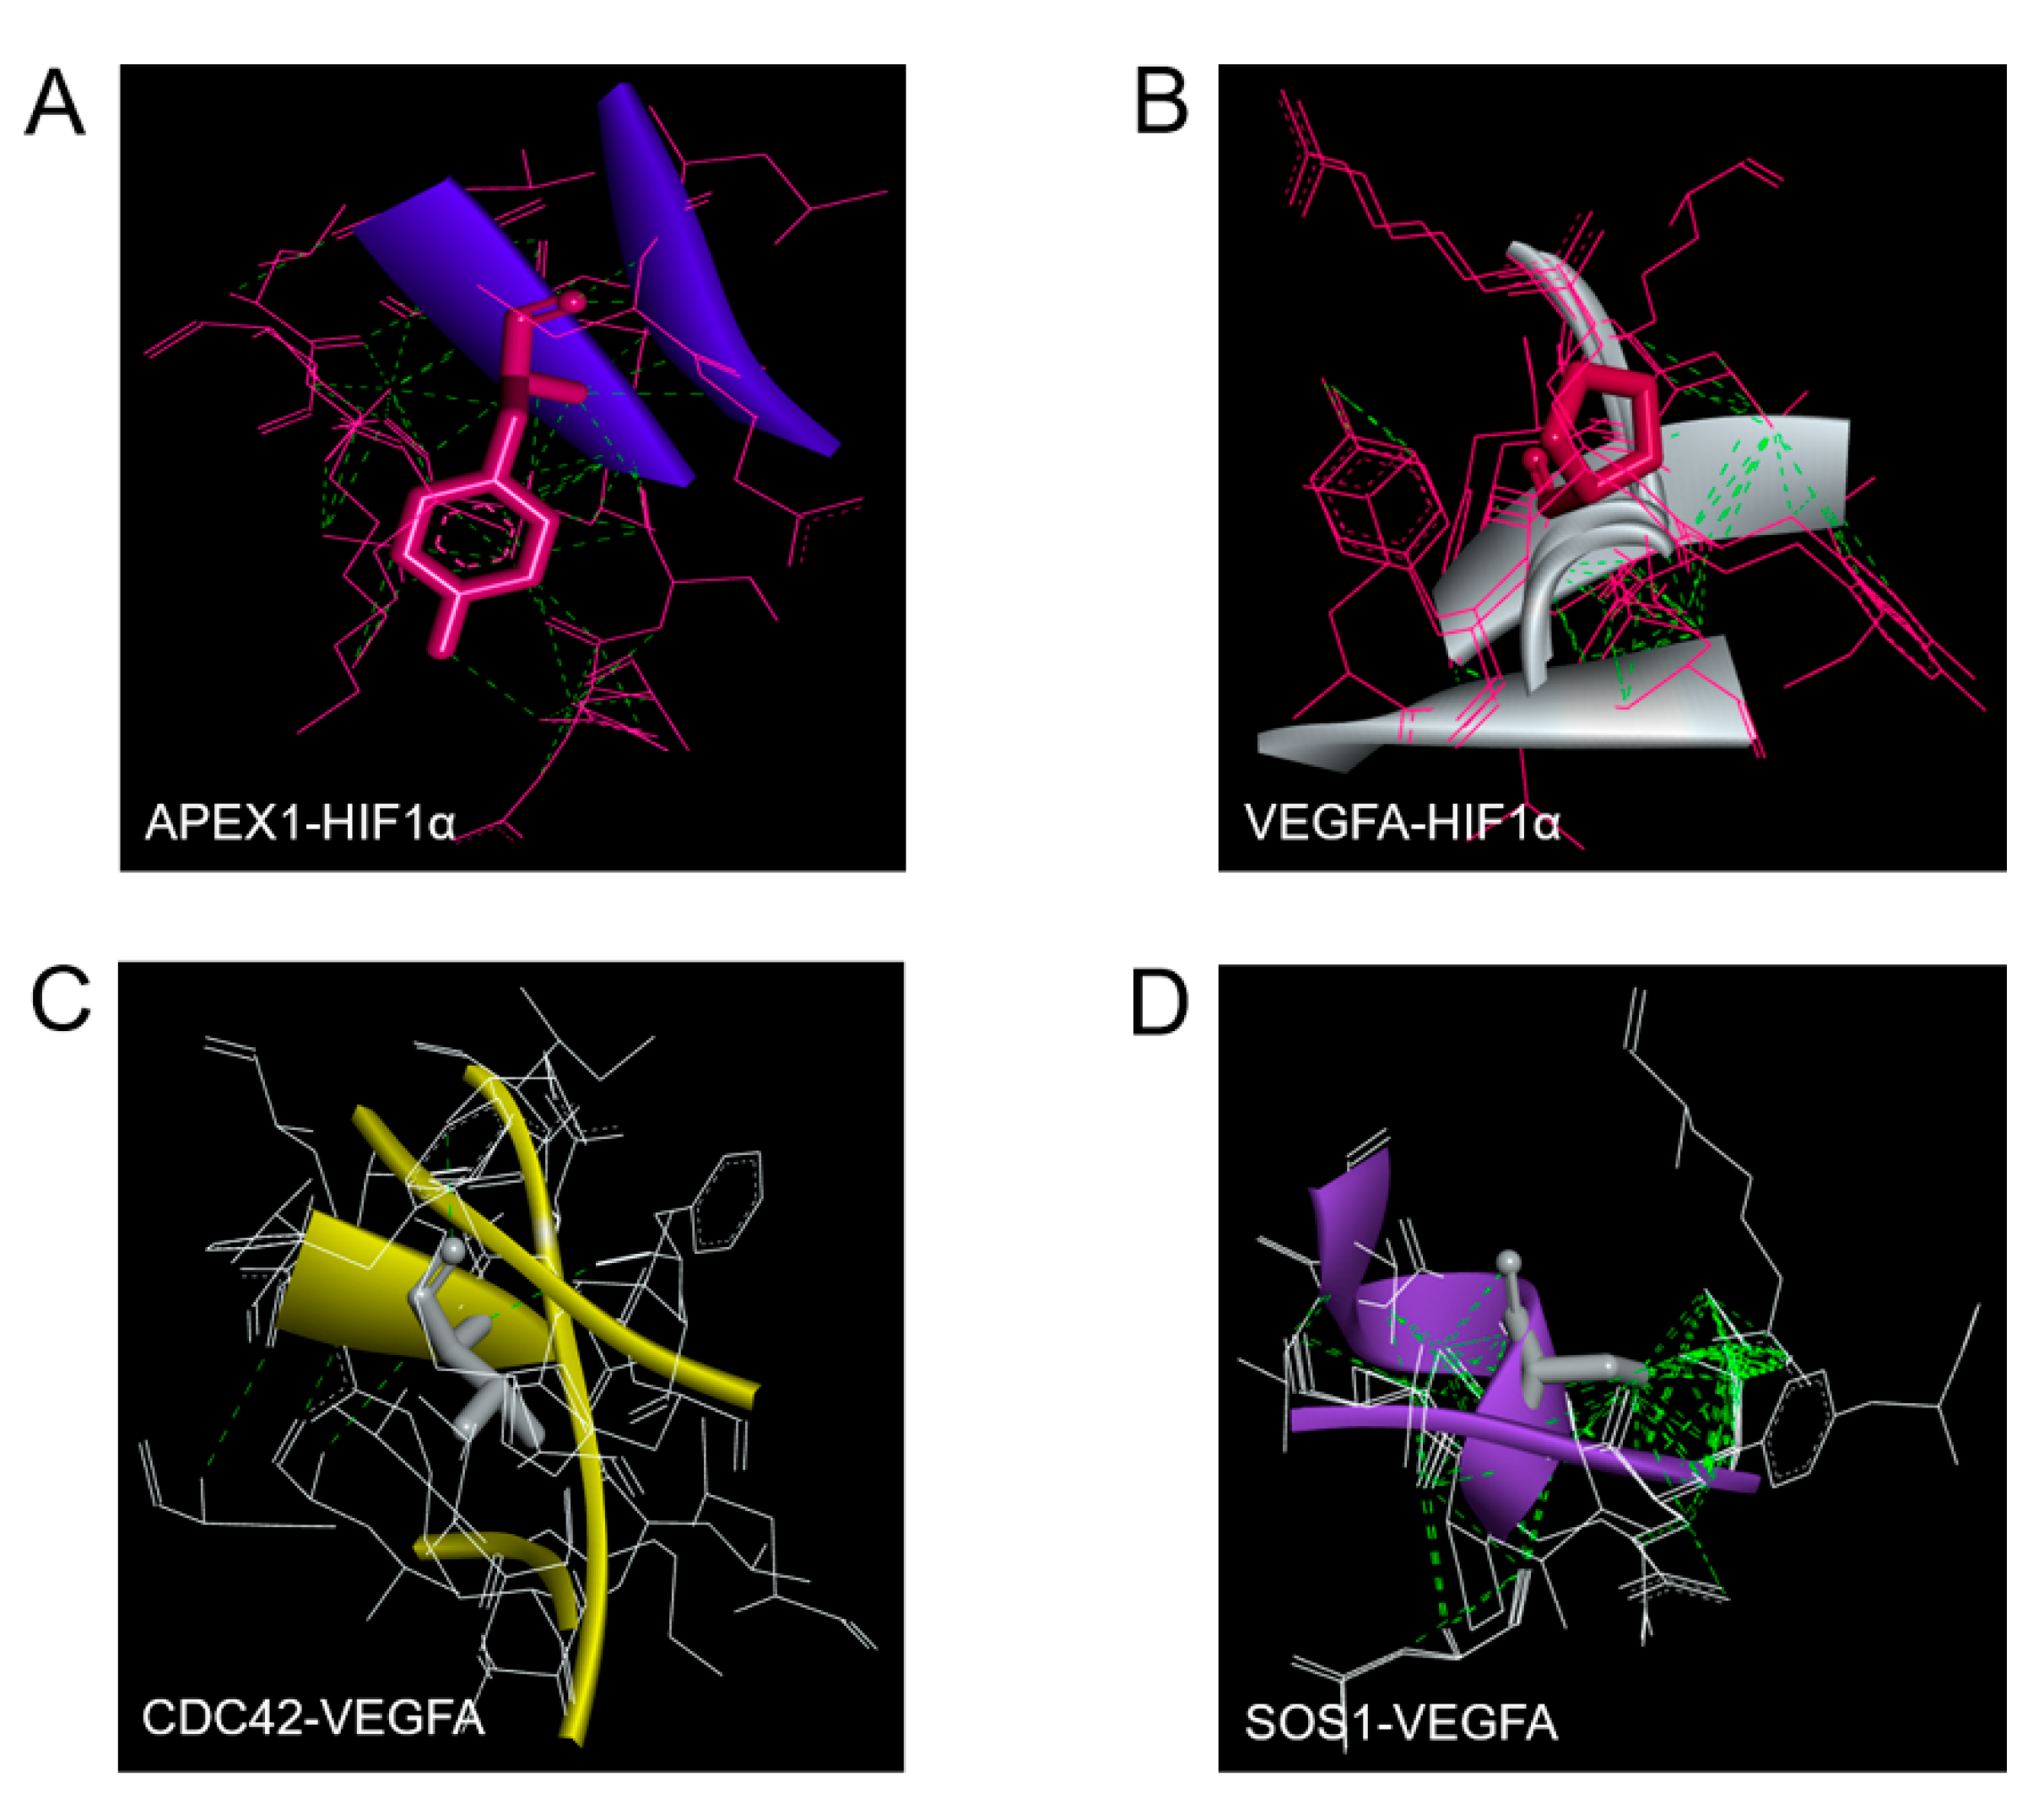
2.5. Molecular Docking of APEX1 and Related Proteins
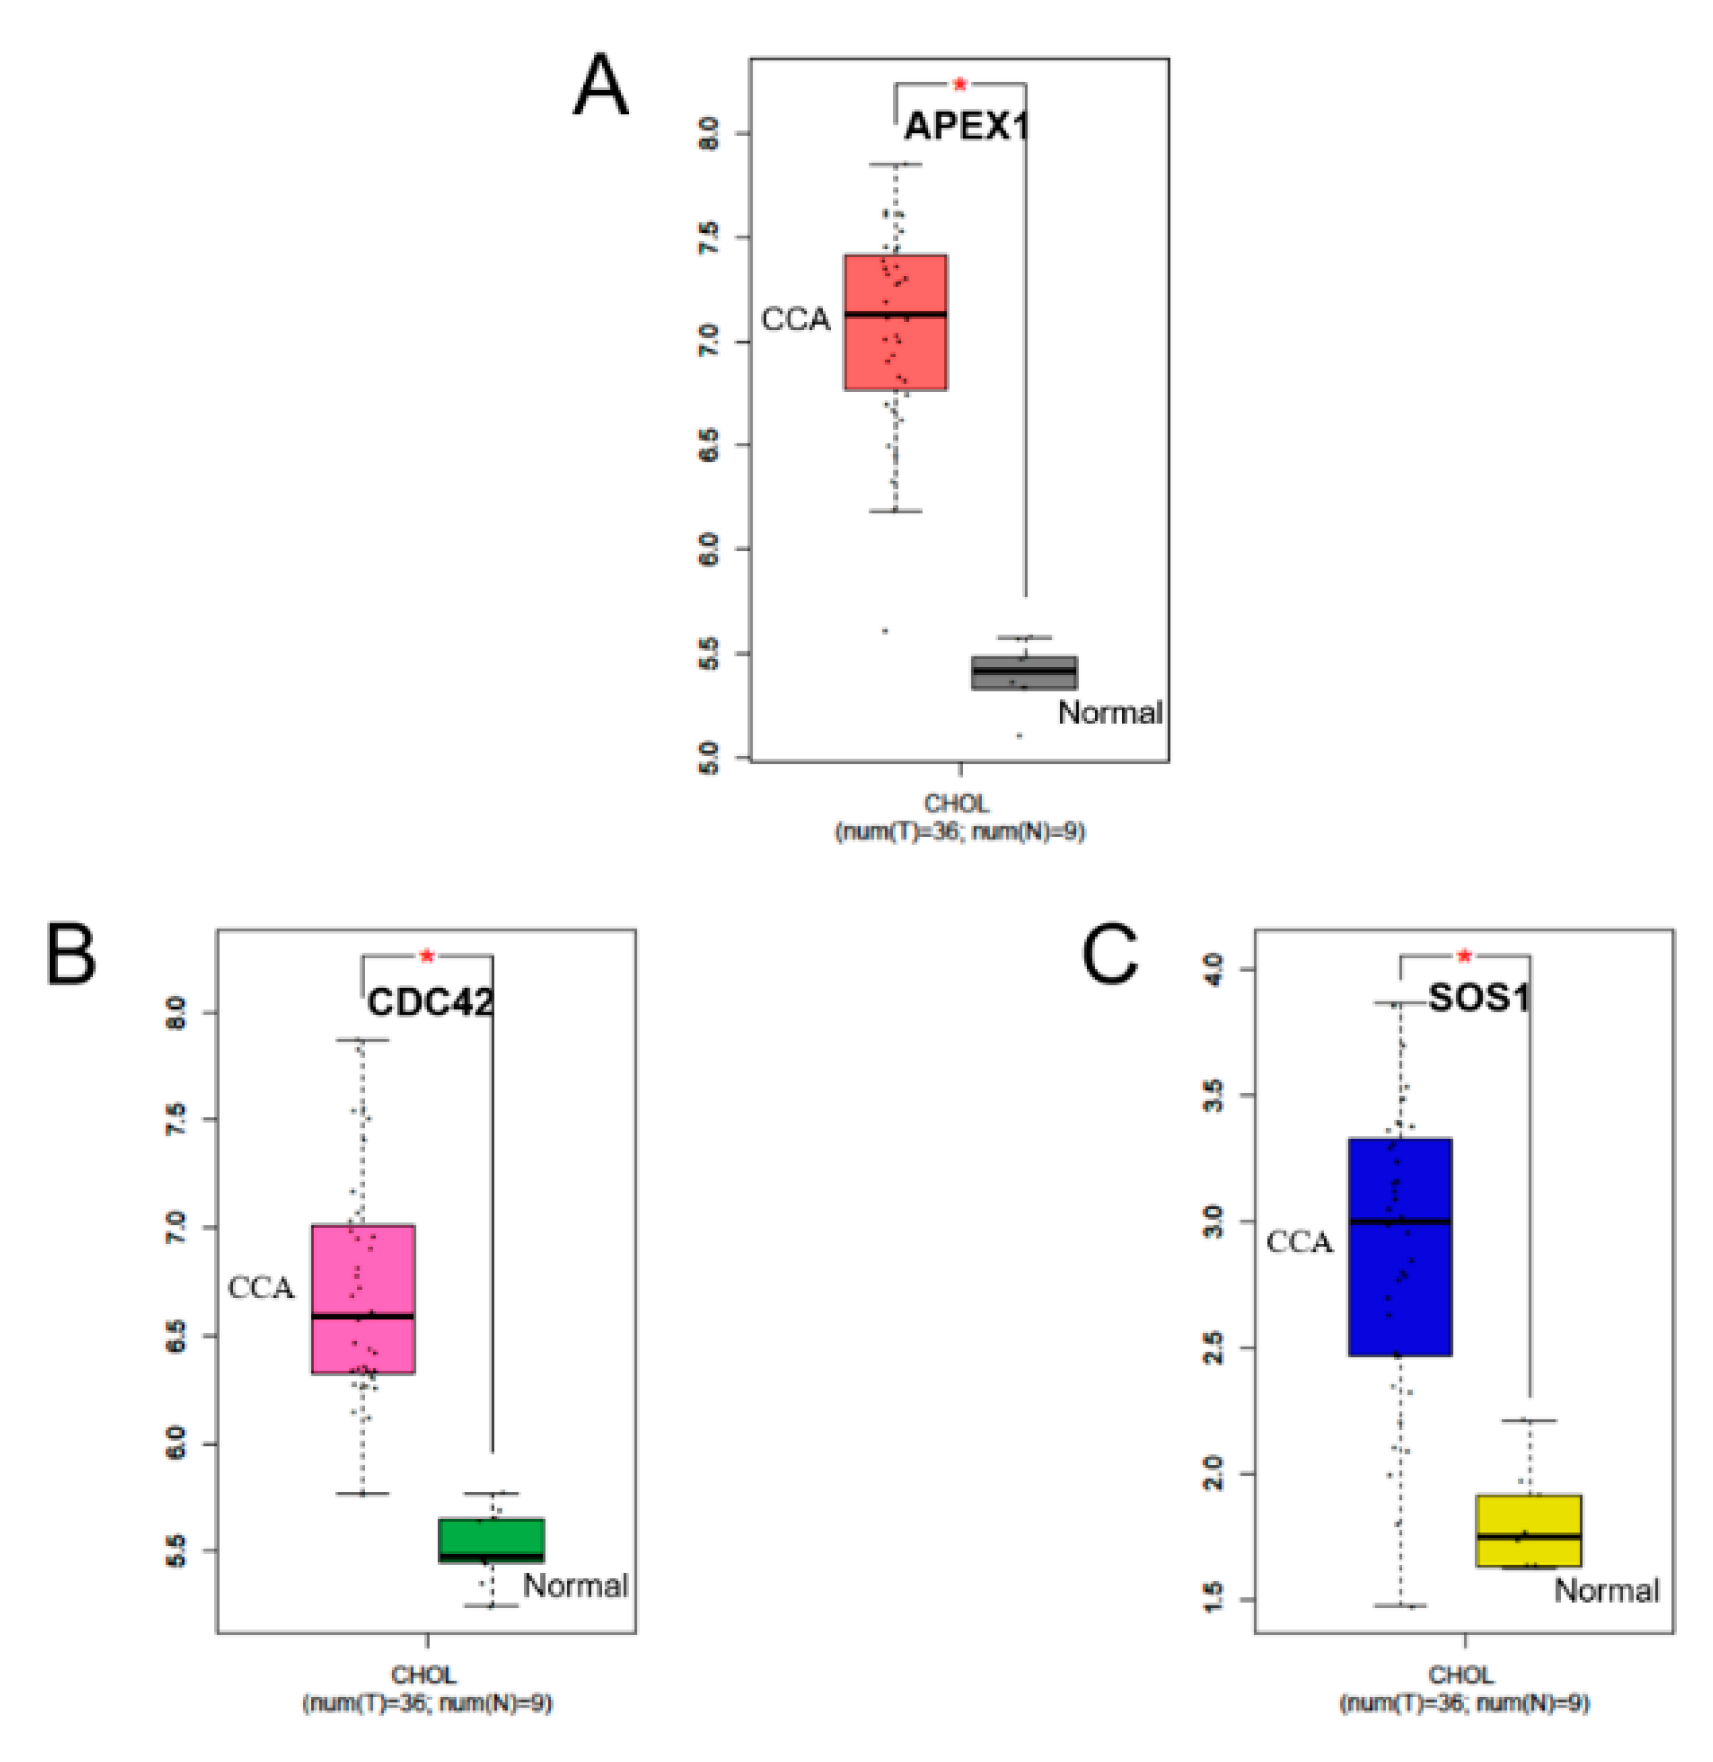
2.6. RNA Expression Levels of APEX1 and Related Protein Genes
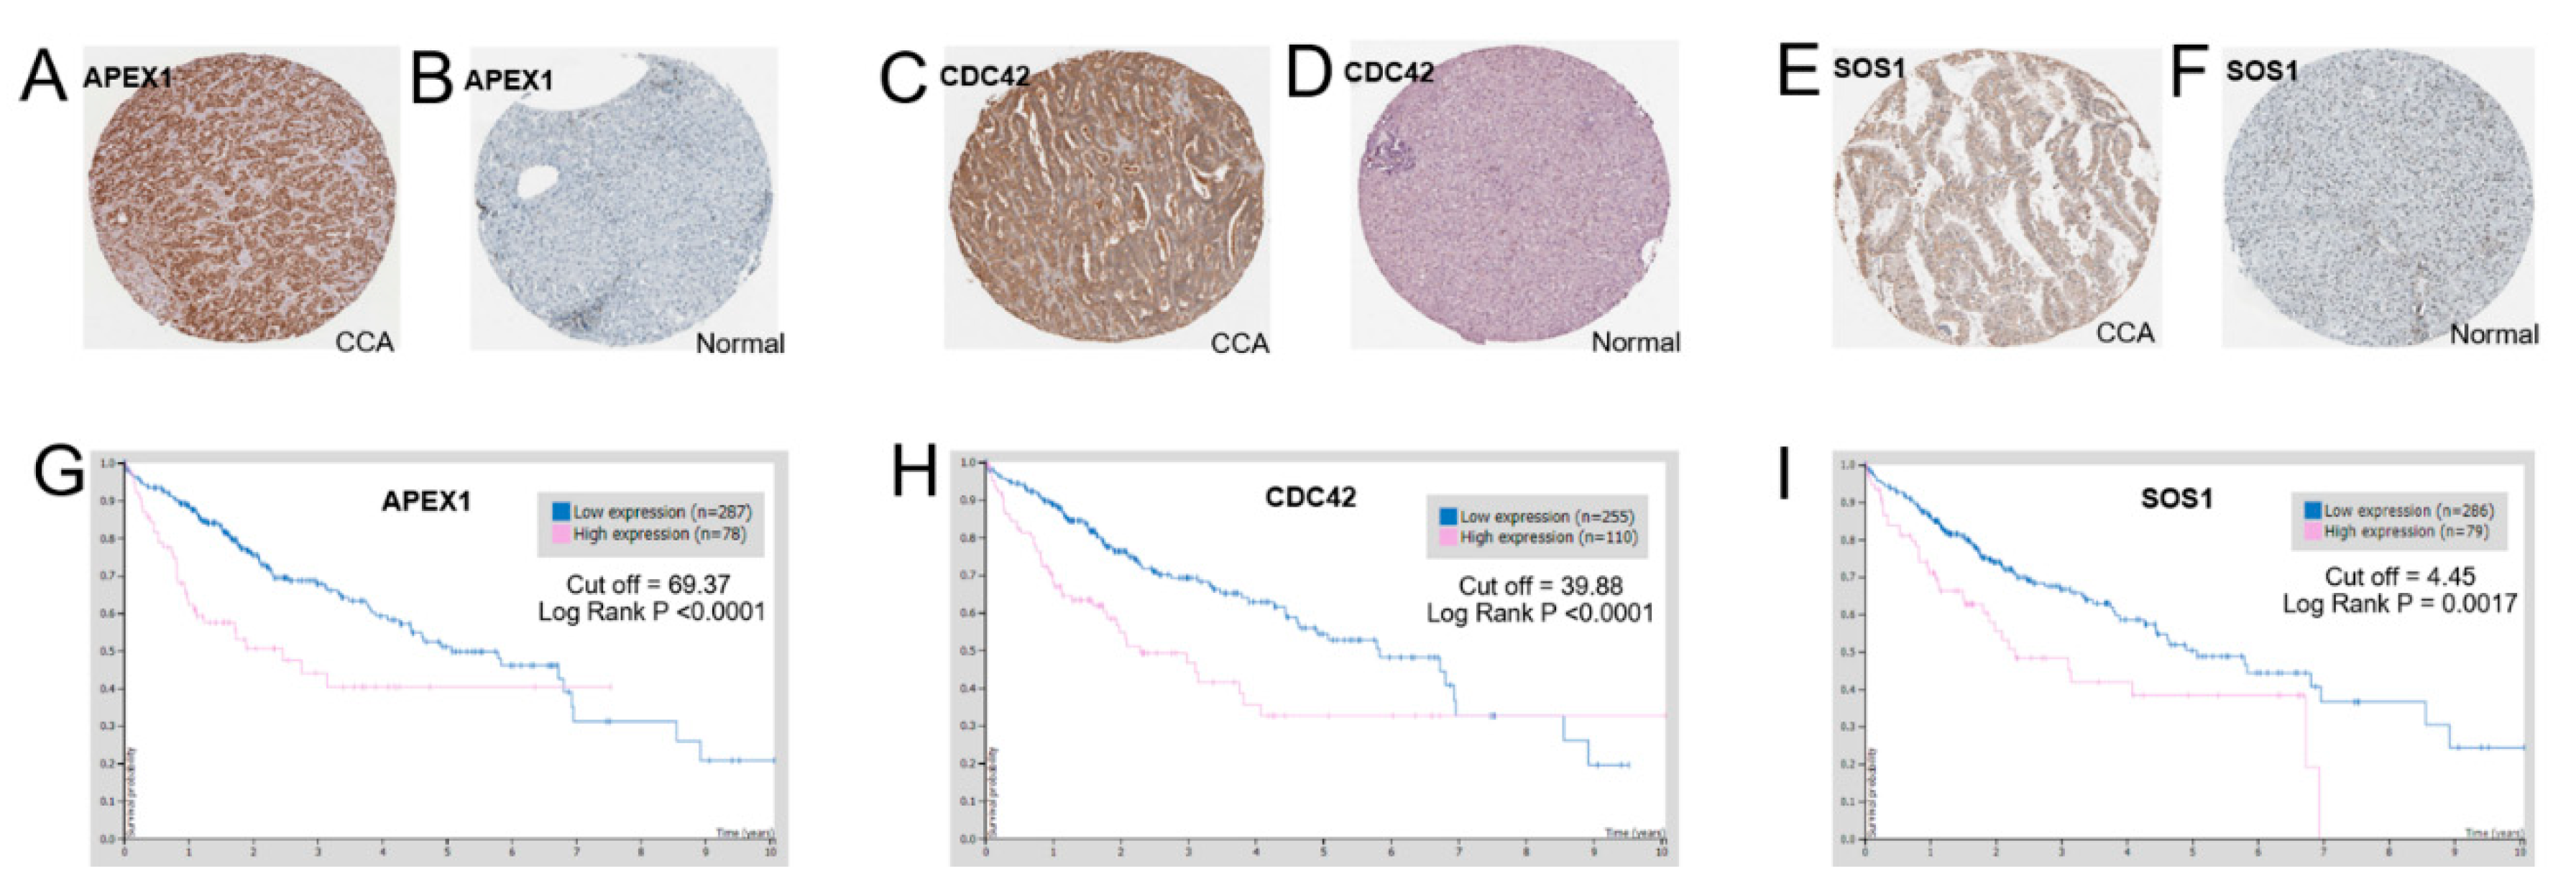
2.7. Protein Expression Levels of APEX1 and Related Proteins in CCA Tissues
3. Discussion
4. Materials and Methods
4.1. Human Cell Lines
4.2. Western Blot Analysis
4.3. Transient Silencing of APEX1 Gene Using siRNA
4.4. Gel Formation and Tryptic Digestion
4.5. Liquid Chromatography-Tandem Mass Spectrometry (LC/MS-MS)
4.6. Protein Quantitation and Identification
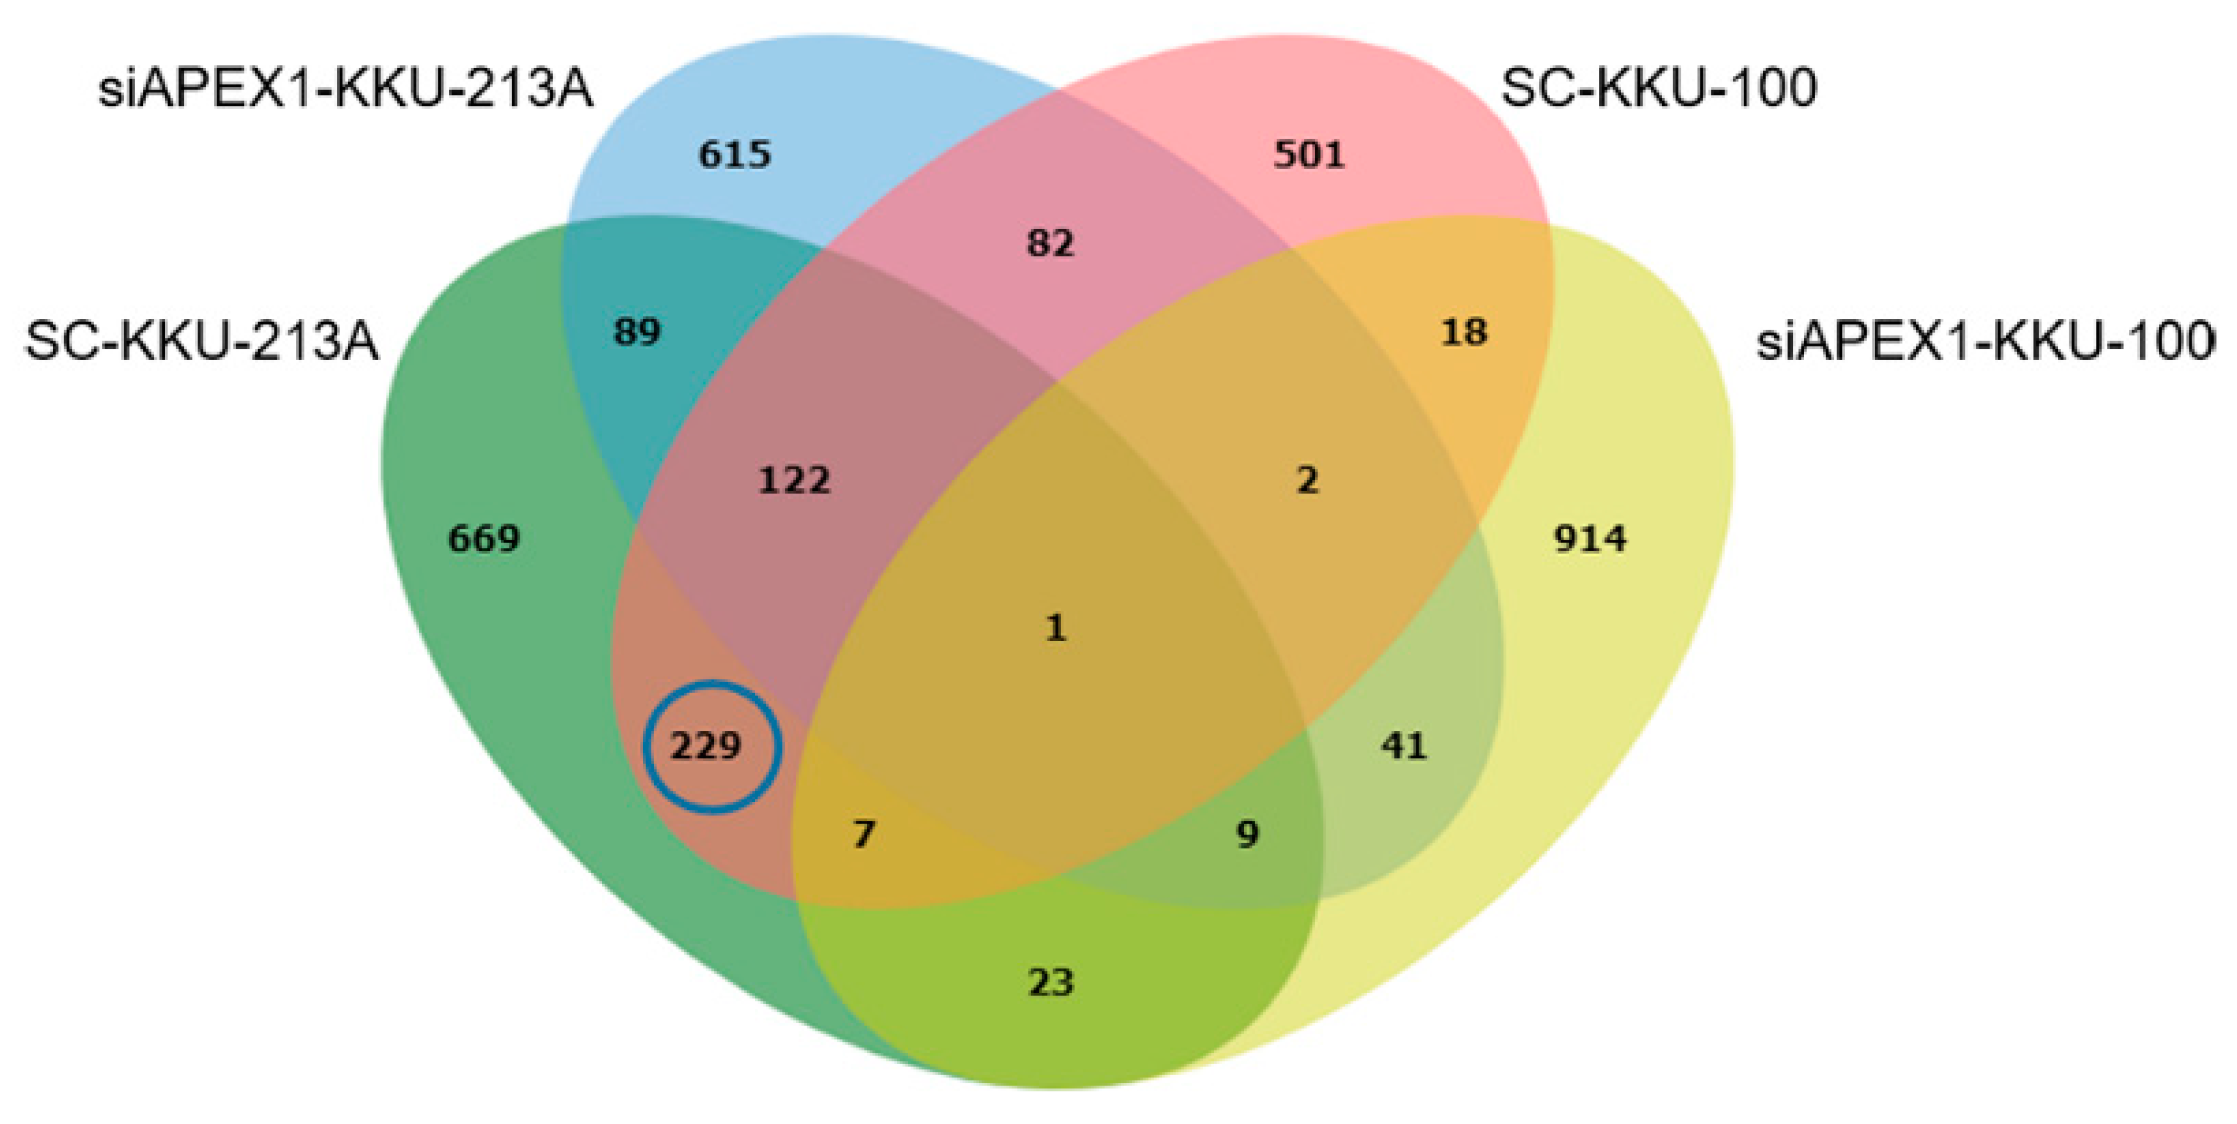
4.7. Selection of Candidate Proteins Using Bioinformatics Tool
4.8. Prediction of APEX1 Signaling Pathway
4.9. Molecular Docking
4.10. Evaluation of RNA Expression Levels in Tissue
4.11. Protein Expression in Tissue and Survival Analysis
5. Conclusions
Supplementary Materials
Author Contributions
Funding
Institutional Review Board Statement
Informed Consent Statement
Data Availability Statement
Acknowledgments
Conflicts of Interest
Sample Availability
References
- Bhudhisawasdi, V.; Khuntikeo, N.; Chur-in, S.; Pugkhem, A.; Talabnin, C.; Wongkham, S. Cholangiocarcinoma: Experience of Srinagarind Hospital. Srinagarind Med. J. 2012, 2, 331–339. [Google Scholar]
- Banales, J.M.; Cardinale, V.; Carpino, G.; Marzioni, M.; Andersen, J.B.; Invernizzi, P.; Lind, G.E.; Folseraas, T.; Forbes, S.J.; Fouassier, L.; et al. Expert consensus document: Cholangiocarcinoma: Current knowledge and future perspectives consensus statement from the European Network for the Study of Cholangiocarcinoma (ENS-CCA). Nat. Rev. Gastroenterol. Hepatol. 2016, 13, 261–280. [Google Scholar] [CrossRef]
- Kamsa-ard, S.; Luvira, V.; Suwanrungruang, K.; Vatanasapt, P.; Wiangnon, S. Risk Factors for Cholangiocarcinoma in Thailand: A Systematic Review and Meta-Analysis. Asian Pac. J. Cancer Prev. APJCP 2018, 19, 605–614. [Google Scholar] [CrossRef]
- Cillo, U.; Fondevila, C.; Donadon, M.; Gringeri, E.; Mocchegiani, F.; Schlitt, H.J.; Ijzermans, J.N.M.; Vivarelli, M.; Zieniewicz, K.; Olde Damink, S.W.M.; et al. Surgery for cholangiocarcinoma. Liver Int. Off. J. Int. Assoc. Study Liver 2019, 39 (Suppl. 1), 143–155. [Google Scholar] [CrossRef] [Green Version]
- Jaklitsch, M.; Petrowsky, H. The power to predict with biomarkers: Carbohydrate antigen 19-9 (CA 19-9) and carcinoembryonic antigen (CEA) serum markers in intrahepatic cholangiocarcinoma. Transl. Gastroenterol. Hepatol. 2019, 4, 23. [Google Scholar] [CrossRef]
- He, C.B.; Zhang, Y.; Song, Y.D.; Wang, J.; Xing, K.L.; Lin, X.J.; Li, S.P. Preoperative CEA levels are supplementary to CA19-9 levels in predicting prognosis in patients with resectable intrahepatic cholangiocarcinoma. J. Cancer 2018, 9, 3117–3128. [Google Scholar] [CrossRef] [PubMed]
- Macias, R.I.; Banales, J.M.; Sangro, B.; Muntane, J.; Avila, M.A.; Lozano, E.; Perugorria, M.J.; Padillo, F.J.; Bujanda, L.; Marin, J.J. The search for novel diagnostic and prognostic biomarkers in cholangiocarcinoma. Biochim. Biophys. Acta Mol. Basis Dis. 2018, 1864, 1468–1477. [Google Scholar] [CrossRef] [PubMed]
- Tummanatsakun, D.; Proungvitaya, T.; Roytrakul, S.; Limpaiboon, T.; Wongkham, S.; Wongkham, C.; Silsirivanit, A.; Somintara, O.; Sangkhamanon, S.; Proungvitaya, S. Serum Apurinic/Apyrimidinic Endodeoxyribonuclease 1 (APEX1) Level as a Potential Biomarker of Cholangiocarcinoma. Biomolecules 2019, 9, 413. [Google Scholar] [CrossRef] [Green Version]
- Lee, Y.R.; Joo, H.K.; Jeon, B.H. The Biological Role of Apurinic/Apyrimidinic Endonuclease1/Redox Factor-1 as a Therapeutic Target for Vascular Inflammation and as a Serologic Biomarker. Biomedicines 2020, 8, 57. [Google Scholar] [CrossRef] [Green Version]
- Bhakat, K.K.; Mantha, A.K.; Mitra, S. Transcriptional regulatory functions of mammalian AP-endonuclease (APE1/Ref-1), an essential multifunctional protein. Antioxid. Redox Signal. 2009, 11, 621–638. [Google Scholar] [CrossRef] [PubMed] [Green Version]
- Yoo, D.G.; Song, Y.J.; Cho, E.J.; Lee, S.K.; Park, J.B.; Yu, J.H.; Lim, S.P.; Kim, J.M.; Jeon, B.H. Alteration of APE1/ref-1 expression in non-small cell lung cancer: The implications of impaired extracellular superoxide dismutase and catalase antioxidant systems. Lung Cancer 2008, 60, 277–284. [Google Scholar] [CrossRef] [PubMed]
- Jiang, X.; Shan, J.; Dai, N.; Zhong, Z.; Qing, Y.; Yang, Y.; Zhang, S.; Li, C.; Sui, J.; Ren, T.; et al. Apurinic/apyrimidinic endonuclease 1 regulates angiogenesis in a transforming growth factor beta-dependent manner in human osteosarcoma. Cancer Sci. 2015, 106, 1394–1401. [Google Scholar] [CrossRef] [PubMed] [Green Version]
- Wei, X.; Li, Q.; Li, Y.; Duan, W.; Huang, C.; Zheng, X.; Sun, L.; Luo, J.; Wang, D.; Zhang, S.; et al. Prediction of survival prognosis of non-small cell lung cancer by APE1 through regulation of Epithelial-Mesenchymal Transition. Oncotarget 2016, 7, 28523–28539. [Google Scholar] [CrossRef]
- Fishel, M.L.; Kelley, M.R. The DNA base excision repair protein Ape1/Ref-1 as a therapeutic and chemopreventive target. Mol. Asp. Med. 2007, 28, 375–395. [Google Scholar] [CrossRef]
- Tang, Z.; Li, C.; Kang, B.; Gao, G.; Zhang, Z. GEPIA: A web server for cancer and normal gene expression profiling and interactive analyses. Nucleic Acids Res. 2017, 45, W98–W102. [Google Scholar] [CrossRef] [Green Version]
- Uhlen, M.; Fagerberg, L.; Hallstrom, B.M.; Lindskog, C.; Oksvold, P.; Mardinoglu, A.; Sivertsson, A.; Kampf, C.; Sjostedt, E.; Asplund, A.; et al. Proteomics. Tissue-based map of the human proteome. Science 2015, 347, 1260419. [Google Scholar] [CrossRef]
- Wang, D.; Luo, M.; Kelley, M.R. Human apurinic endonuclease 1 (APE1) expression and prognostic significance in osteosarcoma: Enhanced sensitivity of osteosarcoma to DNA damaging agents using silencing RNA APE1 expression inhibition. Mol. Cancer Ther. 2004, 3, 679–686. [Google Scholar]
- Wang, D.; Zhong, Z.Y.; Li, M.X.; Xiang, D.B.; Li, Z.P. Vector-based Ape1 small interfering RNA enhances the sensitivity of human osteosarcoma cells to endostatin in vivo. Cancer Sci. 2007, 98, 1993–2001. [Google Scholar] [CrossRef]
- Jou, J.; Diehl, A.M. Epithelial-mesenchymal transitions and hepatocarcinogenesis. J. Clin. Investig. 2010, 120, 1031–1034. [Google Scholar] [CrossRef] [PubMed] [Green Version]
- Reymond, N.; Im, J.H.; Garg, R.; Vega, F.M.; Borda d’Agua, B.; Riou, P.; Cox, S.; Valderrama, F.; Muschel, R.J.; Ridley, A.J. Cdc42 promotes transendothelial migration of cancer cells through beta1 integrin. J. Cell Biol. 2012, 199, 653–668. [Google Scholar] [CrossRef] [PubMed] [Green Version]
- Aguilar, B.J.; Zhao, Y.; Zhou, H.; Huo, S.; Chen, Y.H.; Lu, Q. Inhibition of Cdc42-intersectin interaction by small molecule ZCL367 impedes cancer cell cycle progression, proliferation, migration, and tumor growth. Cancer Biol. Ther. 2019, 20, 740–749. [Google Scholar] [CrossRef] [PubMed]
- Hillig, R.C.; Sautier, B.; Schroeder, J.; Moosmayer, D.; Hilpmann, A.; Stegmann, C.M.; Werbeck, N.D.; Briem, H.; Boemer, U.; Weiske, J.; et al. Discovery of potent SOS1 inhibitors that block RAS activation via disruption of the RAS-SOS1 interaction. Proc. Natl. Acad. Sci. USA 2019, 116, 2551–2560. [Google Scholar] [CrossRef] [PubMed] [Green Version]
- Timofeeva, O.A.; Zhang, X.; Ressom, H.W.; Varghese, R.S.; Kallakury, B.V.; Wang, K.; Ji, Y.; Cheema, A.; Jung, M.; Brown, M.L.; et al. Enhanced expression of SOS1 is detected in prostate cancer epithelial cells from African-American men. Int. J. Oncol. 2009, 35, 751–760. [Google Scholar]
- Shinde, A.; Hardy, S.D.; Kim, D.; Akhand, S.S.; Jolly, M.K.; Wang, W.H.; Anderson, J.C.; Khodadadi, R.B.; Brown, W.S.; George, J.T.; et al. Spleen Tyrosine Kinase-Mediated Autophagy Is Required for Epithelial-Mesenchymal Plasticity and Metastasis in Breast Cancer. Cancer Res. 2019, 79, 1831–1843. [Google Scholar] [CrossRef] [Green Version]
- Shinde, A.; Paez, J.S.; Libring, S.; Hopkins, K.; Solorio, L.; Wendt, M.K. Transglutaminase-2 facilitates extracellular vesicle-mediated establishment of the metastatic niche. Oncogenesis 2020, 9, 16. [Google Scholar] [CrossRef] [PubMed] [Green Version]
- Sripa, B.; Seubwai, W.; Vaeteewoottacharn, K.; Sawanyawisuth, K.; Silsirivanit, A.; Kaewkong, W.; Muisuk, K.; Dana, P.; Phoomak, C.; Lert-Itthiporn, W.; et al. Functional and genetic characterization of three cell lines derived from a single tumor of an Opisthorchis viverrini-associated cholangiocarcinoma patient. Human cell 2020, 33, 695–708. [Google Scholar] [CrossRef]
- Sripa, B.; Leungwattanawanit, S.; Nitta, T.; Wongkham, C.; Bhudhisawasdi, V.; Puapairoj, A.; Sripa, C.; Miwa, M. Establishment and characterization of an opisthorchiasis-associated cholangiocarcinoma cell line (KKU-100). World J. Gastroenterol. 2005, 11, 3392–3397. [Google Scholar] [CrossRef] [PubMed]
- Maruyama, M.; Kobayashi, N.; Westerman, K.A.; Sakaguchi, M.; Allain, J.E.; Totsugawa, T.; Okitsu, T.; Fukazawa, T.; Weber, A.; Stolz, D.B.; et al. Establishment of a highly differentiated immortalized human cholangiocyte cell line with SV40T and hTERT. Transplantation 2004, 77, 446–451. [Google Scholar] [CrossRef] [Green Version]
- Tyanova, S.; Temu, T.; Cox, J. The MaxQuant computational platform for mass spectrometry-based shotgun proteomics. Nat. Protoc. 2016, 11, 2301–2319. [Google Scholar] [CrossRef] [PubMed]
- Tyanova, S.; Temu, T.; Sinitcyn, P.; Carlson, A.; Hein, M.Y.; Geiger, T.; Mann, M.; Cox, J. The Perseus computational platform for comprehensive analysis of (prote)omics data. Nat. Methods 2016, 13, 731–740. [Google Scholar] [CrossRef]
- Bardou, P.; Mariette, J.; Escudie, F.; Djemiel, C.; Klopp, C. jvenn: An interactive Venn diagram viewer. BMC Bioinform. 2014, 15, 293. [Google Scholar] [CrossRef] [Green Version]
- Szklarczyk, D.; Santos, A.; von Mering, C.; Jensen, L.J.; Bork, P.; Kuhn, M. STITCH 5: Augmenting protein-chemical interaction networks with tissue and affinity data. Nucleic Acids Res. 2016, 44, D380–D384. [Google Scholar] [CrossRef] [PubMed]
- Morris, G.M.; Huey, R.; Lindstrom, W.; Sanner, M.F.; Belew, R.K.; Goodsell, D.S.; Olson, A.J. AutoDock4 and AutoDockTools4: Automated docking with selective receptor flexibility. J. Comput. Chem. 2009, 30, 2785–2791. [Google Scholar] [CrossRef] [Green Version]
- Rizvi, S.M.; Shakil, S.; Haneef, M. A simple click by click protocol to perform docking: AutoDock 4.2 made easy for non-bioinformaticians. EXCLI J. 2013, 12, 831–857. [Google Scholar] [PubMed]
- Berman, H.M.; Westbrook, J.; Feng, Z.; Gilliland, G.; Bhat, T.N.; Weissig, H.; Shindyalov, I.N.; Bourne, P.E. The Protein Data Bank. Nucleic Acids Res. 2000, 28, 235–242. [Google Scholar] [CrossRef] [PubMed] [Green Version]
- Tsai, H.H.; Tsai, C.J.; Ma, B.; Nussinov, R. In silico protein design by combinatorial assembly of protein building blocks. Protein Sci. A Publ. Protein Soc. 2004, 13, 2753–2765. [Google Scholar] [CrossRef] [Green Version]
- Bordogna, A.; Pandini, A.; Bonati, L. Predicting the accuracy of protein-ligand docking on homology models. J. Comput. Chem. 2011, 32, 81–98. [Google Scholar] [CrossRef] [Green Version]
- Coutsias, E.A.; Seok, C.; Dill, K.A. Using quaternions to calculate RMSD. J. Comput. Chem. 2004, 25, 1849–1857. [Google Scholar] [CrossRef] [PubMed]


Publisher’s Note: MDPI stays neutral with regard to jurisdictional claims in published maps and institutional affiliations. |
© 2021 by the authors. Licensee MDPI, Basel, Switzerland. This article is an open access article distributed under the terms and conditions of the Creative Commons Attribution (CC BY) license (https://creativecommons.org/licenses/by/4.0/).
Share and Cite
Tummanatsakun, D.; Proungvitaya, T.; Roytrakul, S.; Proungvitaya, S. Bioinformatic Prediction of Signaling Pathways for Apurinic/Apyrimidinic Endodeoxyribonuclease 1 (APEX1) and Its Role in Cholangiocarcinoma Cells. Molecules 2021, 26, 2587. https://doi.org/10.3390/molecules26092587
Tummanatsakun D, Proungvitaya T, Roytrakul S, Proungvitaya S. Bioinformatic Prediction of Signaling Pathways for Apurinic/Apyrimidinic Endodeoxyribonuclease 1 (APEX1) and Its Role in Cholangiocarcinoma Cells. Molecules. 2021; 26(9):2587. https://doi.org/10.3390/molecules26092587
Chicago/Turabian StyleTummanatsakun, Doungdean, Tanakorn Proungvitaya, Sittiruk Roytrakul, and Siriporn Proungvitaya. 2021. "Bioinformatic Prediction of Signaling Pathways for Apurinic/Apyrimidinic Endodeoxyribonuclease 1 (APEX1) and Its Role in Cholangiocarcinoma Cells" Molecules 26, no. 9: 2587. https://doi.org/10.3390/molecules26092587