Assaying Chromatin Accessibility Using ATAC-Seq in Invertebrate Chordate Embryos
 Marta Silvia Magri1*†
  Sandra Jiménez-Gancedo1†
  Stephanie Bertrand2
  Alicia Madgwick3
  Hector Escrivà2
  Patrick Lemaire3
  José Luis Gómez-Skarmeta1*
- 1Centro Andaluz de Biología del Desarrollo, CSIC-Universidad Pablo de Olavide-Junta de Andalucía, Seville, Spain
- 2Sorbonne Université, CNRS, UMR 7232, Biologie Intégrative des Organismes Marins, Observatoire Océanologique, Banyuls-sur-Mer, France
- 3Centre de Recherche en Biologie Cellulaire de Montpellier, CNRS, UMR 5237, Université de Montpellier, Montpellier, France
Cis-regulatory elements (CREs) are non-coding DNA regions involved in the spatio-temporal regulation of gene expression. Gene regulatory changes drive animal development and play major roles during evolution of animal body plans. Therefore, we believe that determining CREs at different developmental stages and across animal lineages is critical to understand how evolution operates through development. The Assay for Transposase-Accessible Chromatin followed by high-throughput sequencing (ATAC-seq) is a powerful technique for the study of CREs that takes advantage of Tn5 transposase activity. Starting from fewer than 105 cells, in a 1-day procedure, it is possible to detect, at a genome-wide level, CREs located in open chromatin regions with high resolution. Here, we describe a detailed step-by-step ATAC-seq protocol for invertebrate chordate marine embryos. We have successfully applied this technique to amphioxus and two species of tunicate embryos. We also show an easy workflow to analyze data generated with this technique. Moreover, we point out that this method and our bioinformatic pipeline are efficient to detect CREs associated with Wnt signaling pathway by simply using embryos treated with a drug that perturbs this pathway. This approach can be extended to other signaling pathways and also to embryo mutants for critical genes. Our results therefore demonstrate the power of ATAC-seq for the identification of CREs that play essential functions during animal development in a wide range of invertebrate or vertebrate animals.
Introduction
During embryonic development, cellular cross-talks must be tightly coordinated to allow the proper formation of the different tissues in the developing organism. These cross-talks are mediated by a limited number of pleiotropic signaling pathways that precisely control gene expression. Developmental genes are among the main targets of these signaling pathways. Accordingly, the expression of these genes is precisely regulated in space and time by the combined action of different pathways. However, how developmental genes integrate these multiple inputs is largely unexplored.
Cis-regulatory elements (CREs) are non-coding DNA regions involved in the regulation of gene expression. These CREs, mainly constituted of enhancers and promoters, contain DNA binding sites for transcription factors (TFs). TFs binding at CREs facilitate the recruitment of the RNA polymerase II machinery at the promoter of target genes, triggering their expression. Signaling pathways operate through different families of TFs. Therefore, identification of the CREs bound by these TFs that respond to signaling pathways would help to unravel how developmental genes integrate these signals (Spitz and Furlong, 2012; Long et al., 2016).
In the last years, the identification of CREs has been boosted by the emergence of next-generation sequencing. Among the new available techniques, we selected the Assay for Transposase-Accessible Chromatin followed by high-throughput sequencing (ATAC-seq; Buenrostro et al., 2013). ATAC-seq is a simple, easy-to-use, and efficient technique for identification of CREs actively bound by TFs in most tissues and organs of different species (Bogdanović et al., 2016; Sebé-Pedrós et al., 2016; Kittelmann et al., 2018; Marlétaz et al., 2018; Ruiz et al., 2018; Madgwick et al., 2019). The assay is based on the hyperactive Tn5 transposase, which preferentially integrates into open chromatin regions, where it cuts DNA into fragments and simultaneously attaches sequencing Illumina adapters to the fragment ends, facilitating the direct construction of the sequencing library (Figure 1A). Sequencing reads are used to infer regions of increased accessibility such as promoters or enhancers, discriminating them from regions occupied by nucleosomes. Unlike ChIP-seq and DNAse-seq, ATAC-seq enables obtaining, in a 1-day procedure, DNA libraries with genome-wide information from fewer than 105 cells. Thus, this technique permits identification of open chromatin regions, offering a much more precise and realistic picture of how functional CREs are distributed in the genome. Moreover, applying this protocol to embryos at specific embryonic stages or to isolated populations of cells allows efficient exploration of the dynamics of regulatory activity across the different developmental stages and tissues. Finally, comparing orthologous regulatory regions in related species will give us the opportunity to find functionally conserved enhancers that are maintained at equivalent genomic positions, even though their sequences have diverged. Consequently, these studies move us closer to studying how changes at CREs are associated with gene expression differences during development and how they contribute to the evolution of novel morphological traits.
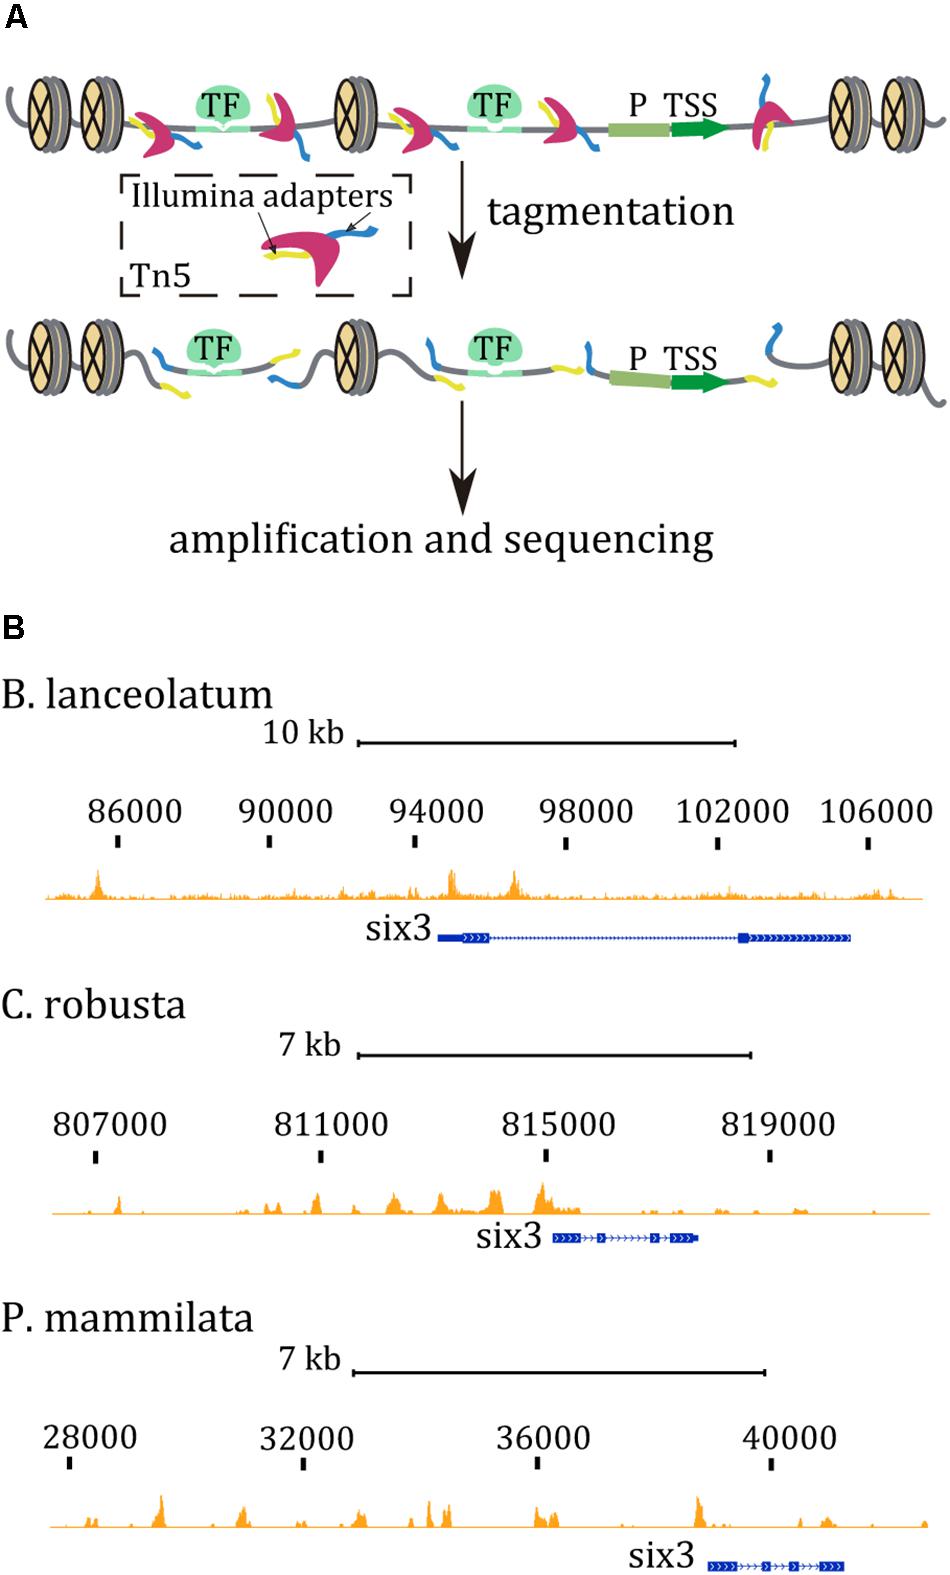
Figure 1. (A) ATAC-seq cartoon reaction. The Tn5 transposase (dark pink) inserts two sequencing adapters (yellow and blue) only in accessible regions, between nucleosomes and binding sites for proteins (green), such as transcription factors (TF). Promoter regions (P) and transcription start sites (TSS) are also considered open chromatin regions. Tn5 generates sequencing fragments that can be amplified by PCR. (B) ATAC-seq tracks in the six3 region from chordates embryos at late gastrula stage. ATAC-seq tracks are marked in orange while the gene model is represented in blue. Mapped sequenced reads, <130 bp, identify discrete open chromatin regions mostly upstream the body gene region.
Here, we provide a step-by-step protocol with the aim of unifying species-specific procedures recently published (Marlétaz et al., 2018; Madgwick et al., 2019). We also provide detailed information about the handling of embryos, such as in vitro fertilization, and about how to obtain the optimal cell lysates specific for each organism. Starting from the cell lysate, the subsequent protocol steps are common for all the organisms used. Then, we propose an easy-to-follow workflow for basic bioinformatic analysis applicable to biological questions, such as identifying differential ATAC-seq signal across development or in embryos with perturbed signaling pathways. To demonstrate the robustness of our analysis, we used recently published ATAC-seq data from wild-type (wt) Ciona embryos at the 112-cell stage and embryos treated with CHIR-99021 (Madgwick et al., 2019), a pharmacological activator of the Wnt/β-catenin pathway (Naujok et al., 2014; Wu et al., 2015). This pathway has an ancestral function during primary body axis formation in both bilaterians and non-bilaterians (Petersen and Reddien, 2009; Imai et al., 2000; Creyghton et al., 2010; Loh et al., 2016). Our novel analysis reveals that the ATAC-seq peaks that are more accessible in the embryos treated with the Wnt agonist are enriched for TFs binding motifs (TFBMs) linked with this pathway. Accordingly, these potential CREs are associated with genes that play critical roles during development.
Our results strongly suggest that combining ATAC-seq with embryo perturbation experiments is a powerful method for identification of biological significant CREs critical for embryo development in multiple animal models.
Materials and Equipment
Reagents
• 4′-6-Diamidino-2-phenylindole dilactate, DAPI (Invitrogen Thermo Fisher Scientific, San Diego, CA, United States, catalog no.: D3571)
• 4-(2-Hydroxyethyl)piperazine-1-ethanesulfonic acid, HEPES (Sigma-Aldrich Merck, catalog no.: H3375)
• Gentamycin (Gibco Thermo Fisher Scientific, San Diego, CA, United States, catalog no.: 15750060)
• IGEPAL CA-630 (Sigma-Aldrich Merck, catalog no.: I8896)
• Low-melting-point agarose
• MinElute PCR purification kit (Qiagen, catalog no.: 28004)
• Nebnext High-Fidelity 2× PCR master mix (New England Biolabs, Ipswich, MA, United States, catalog no.: M0541S)
• Nextera DNA library Prep kit (Illumina, Cambridge, United Kingdom, catalog no.: FC-121-1030)
• N,N-Dimethylformamide, C3H7NO (Sigma-Aldrich Merck, catalog no.: D4551)
• Primers for library amplification. Complete list of primers is available in Supplementary Table 1 of Buenrostro et al. (2013).
• QubitTM dsDNA BR assay kit (Invitrogen Thermo Fisher Scientific, San Diego, CA, United States, catalog no.: Q32850)
• SYBRTM Green I Nucleic Acid Gel Stain 10,000× concentrate in DMSO (Invitrogen Thermo Fisher Scientific, San Diego, CA, United States, catalog no.: S7563)
• Trypsin from porcine pancreas lyophilized powder (Sigma-Aldrich, catalog no.: T4799).
Materials
• 0.45-μm bottle top filters with PES membrane (Nalgene Thermo Fisher Scientific, San Diego, CA, United States, catalog no.: 295-4545)
• Cell counting chamber
• 0.2 μm cellulose acetate syringe filter (Sigma-Aldrich Merck, catalog no.: CLS431219)
• Filter tips
• 200-μl PCR tubes
• Petri dish 90 × 14 mm
• 1.5-ml polypropylene DNA low binding conical microcentrifuge tubes
• qPCR consumables, products are specific to the instrument
• Soda-lime glass disposable Pasteur pipettes (VWR, catalog no.: 612-1701)
• Rapid-FlowTM Sterile Disposable Filter Units with 0.2-μm PES Membrane (Nalgene Thermo Fisher Scientific, San Diego, CA, United States, catalog no.: 595-4520)
• 500-μl thin-walled PCR tubes (Invitrogen Thermo Fisher Scientific, San Diego, CA, United States, catalog no.: Q32856).
Animal Samples
Branchiostoma lanceolatum
Branchiostoma lanceolatum adults were collected during their breading season in the coast of Argelès-sur-mer, France, according to the previously described method (Fuentes et al., 2004).
Ciona intestinalis and Phallusia mammillata
Adult animals of Ciona intestinalis (previously C. intestinalis type B; Caputi et al., 2007) and Phallusia mammillata were collected from the wild by the marine service provided by Centre de Ressources Biologiques Marines in Roscoff, France.
Solutions
Attention: all solutions described are prepared with milli-Q quality water, unless otherwise specified.
• NaOH 1 M.
• HEPES 0.5 M pH 8 (500 ml): Dissolve 59.58 g HEPES in 400 ml of water and adjust to pH 8 by adding drops of 1 M NaOH. Complete the volume up to 500 ml with water.
• Artificial sea water-HEPES (ASWH): NaCl 500 mM, Kcl 9 mM, CaCl2 10 mM, MgCl2 24.5 mM, MgSO4 24.5 mM, NaHCO3 2.15 mM, HEPES 5 mM, pH 8.
To prepare 1 L of ASWH, dissolve 29.22 g NaCl, 0.67 g KCl, 1.11 g CaCl2, 2.33 g MgCl2, 2.95 g MgSO4, and 0.18 g NaHCO3 in 1 L of water. Next, add 1 ml of HEPES. Sterilize through 0.2-μm PES membrane and add 0.05 g/L of gentamycin.
Comments: ASWH may be kept at 18°C to use it with ascidian embryos.
• Filtered seawater: filter natural seawater through bottle top filter with 0.45-μm PES membrane.
Comments: filtered seawater may be kept at 19°C to use it with B. lanceolatum embryos.
• 1% Agarose in ASWH
• 0.8% Agarose in filtered seawater
• DAPI 1000×.
Comments: 1-ml aliquots can be long term stored at −20°C. The stock solution must be diluted 1:100 with distillated water to reach 10×.
• 20% IGEPAL CA-630 (1 ml): dissolve 200 μl OF IGEPAL CA-630 in 800 μl of water.
Tips: IGEPAL CA-630 is a detergent difficult to dissolve. Use a platform rocker or vertical rotator to help to dissolve the detergent. Some hours are needed to obtain a homogeneous solution.
Comments: 20% IGEPAL CA-630 is stored for 1 week at room temperature.
• MgCl2 1 M
• NaCl 4 M
• Tris–HCl 2 M, pH 7.5
• Lysis buffer: 10 mM Tris–HCl, pH 7.4, 10 mM NaCl, 3 mM MgCl2, and 0.1% IGEPAL CA-630
To prepare 1 ml of lysis buffer, mix 5 μl of Tris–HCl 2 M, pH 7.5, 2.5 μl NaCl 4 M, 3 μl MgCl2 1 M, 5 μl 20% IGEPAL CA-630, and 984.5 μl of water.
Tips: the lysis buffer must be prepared fresh and kept on ice while using it.
• Sodium acetate 3 M, pH 5.3.
• 2× Tagmentation buffer: as alterative to the TD buffer provided by the Nextera kit, a tagmentation buffer can be prepared as follows: 20 mM Tris(hydroxymethyl)aminomethane; 10 mM MgCl2; 20% (vol/vol) dimethylformamide.
To prepare 10 ml of tagmentation buffer, mix 100 μl of Tris–HCl 2 M pH 7.5, 100 μl MgCl2 1 M, and 6 ml of water. Finally, add 2 ml N,N-dimethylformamide and increase the volume up to 10 ml with water. Sterilize the solution by filtration using a 0.2-μm cellulose acetate syringe filter.
Tips: TAPS-NaOH 2 M, pH 8.5, can be used as an alternative to Tris–HCl to prepare the buffer.
Comments: 2× tagmentation buffer may be kept at −20°C no longer than 6 months.
• 0.1% Trypsin in ASWH.
Comments: this solution may be kept at −20°C for long-term storage.
Equipment
• Real-Time PCR Detection System
• Incubator with accurate temperature settings in an interval from 5 to 60°C
• QubitTM 3.0 Fluorometer (Invitrogen Thermo Fisher Scientific, San Diego, CA, United States)
• Refrigerated centrifuge
• Thermal cycler
• Compound fluorescence microscope with UV filter.
Software and Bioinformatic Tools
• Bedtools version 2.26.01
• Bowtie2 version 2.2.62
• DESeq2 version 1.18.13
• Homer version 4.9.14
• IDR version 2.0.35
• MACS2 version 2.1.1.201603096
• PHANTER7
• R version 3.4.2 “Short summer”8
• Samtools version 1.39.
Genome and Annotation
B. lanceolatum
Genome assembly was generated and described in Marlétaz et al. (2018). UCSC hub and annotation files are accessible at http://amphiencode.github.io/ (Table 1).
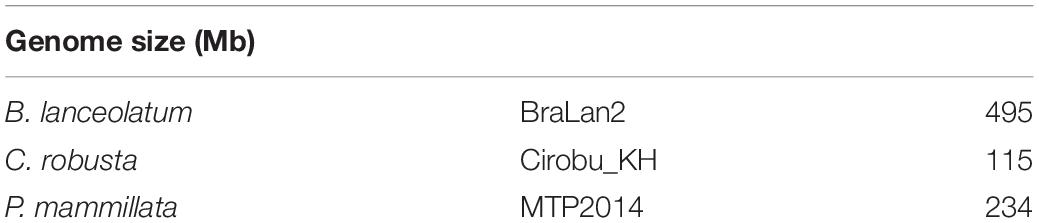
Table 1. Genomes.
C. intestinalis and P. mammillata
C. intestinalis and P. mammillata genome are available for users in http://www.aniseed.cnrs.fr/ (Table 1). For the analysis described in the results section, Apr. 2011; Kyoto KH/ci3 Ciona robusta was used. Genome and the transcription start site (TSS) information were downloaded from UCSC Genome Browser10.
Procedure
In vitro Fertilization
B. lanceolatum samples
To obtain B. lanceolatum eggs and fertilize them, follow the protocol previously described (Fuentes et al., 2004, 2007). Around 30 min after fertilization, collect the embryos in Petri dishes coated with a thin layer of 0.8% agarose and filled with filtered seawater. Dechorionate embryos manually by pipetting them toward the border of the dish. Incubate embryos at 19°C. Check the development of the embryos 3 h after fertilization. Gently transfer healthy embryos to a new Petri dish with filtered seawater using tips with cut ends, previously incubated for several hours in filtered seawater.
C. intestinalis and P. mammillata samples
To obtain ascidian embryos, incubate eggs from both species with activated sperm for 8 min. Phallusia eggs needed to be dechorionated prior fertilization by incubation in 0.1% trypsin in ASWH, while Ciona eggs were dechorionated after fertilization (Christiaen et al., 2009). Keep developing embryos at 18°C in ASWH in a Petri dish coated with a thin layer of 1% agarose melted in ASWH.
Collection of Embryos
We recommend starting ATAC-seq experiments with 100,000–180,000 cells for amphioxus and tunicate species. Use half of the cells (50,000–90,000 cells) for the actual tagmentation step and use the rest of the cells to estimate the number of nuclei in each sample. Optimizing the number of cells to use for the transposition is crucial, since it strongly affects library quality. In fact, using too few cells per experiment leads to over-transposition, while using too many cells produces incomplete transposition and over-sized DNA fragments.
B. lanceolatum samples
Keep embryos at 19°C until they reach the desired developmental stage. Take the appropriate number of embryos according to their developmental stage (Table 2) and transfer them to a 1.5 ml microtube.
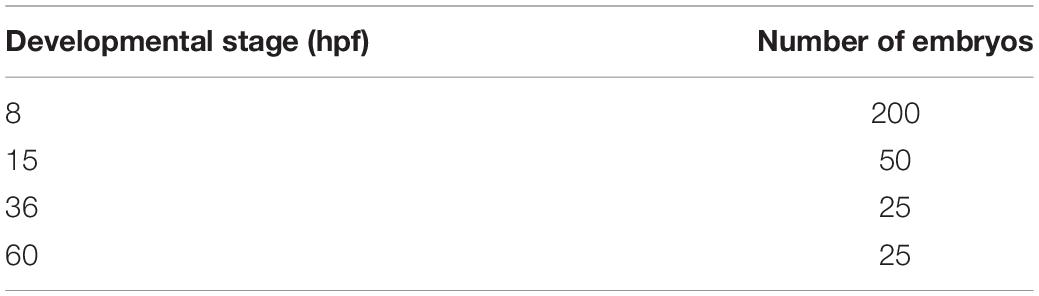
Table 2. Number of B. lanceolatum embryos, according to developmental stages, to achieve recommended cell number (100,000–180,000 cells) for ATAC-seq.
C. instestinalis and P. mammillata samples
(i) Keep Ciona and Phallusia embryos at 18°C until they reach the desired stage (Hotta et al., 2007). Collect embryos from the Petri dish and transfer them to a 1.5-ml microtube with 200 μl of ASWH at the bottom. To get a sufficient number of cells, we estimated that the number of dechorionated embryos in a packed volume of 100 μl was in the order of 10,000–20,000. Table 3 shows the volume of embryos collected depending on the developmental stage.
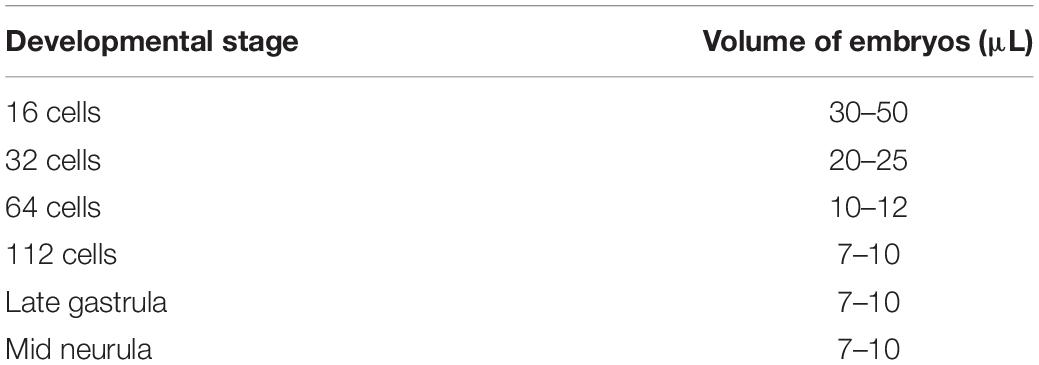
Table 3. Volume of collected ascidian embryos for the estimation of the recommended cell number (100,000–180,000 cells) needed for ATAC-seq.
Attention: avoid air bubbles while pipetting since exposure of embryos to air dismantles embryonic structures.
(ii) Swirl the dish to group embryos, collect them using a glass Pasteur pipette (see Note 1), and transfer them to the 1.5-ml microtube with ASWH.
Attention: from here, keep samples on ice, and use gloves and filter tips.
Cell Lysis
B. lanceolatum samples
(i) Centrifuge the sample at maximum speed at 4°C for 1 min and carefully discard supernatant.
(ii) Add 50 μl of cold lysis buffer and lyse the cells by pipetting up and down with P200 micropipette. For optimal cell lysis, proceed immediately to next step.
(iii) Transfer 8 μl of lysate in three new 1.5-ml microtubes and centrifuge them at 500 × g at 4°C for 10 min. During this 10 min, use the remaining 26 μl to count the cells for transposition: add 2.6 μl of 10× DAPI to 26 μl of the remaining sample and place 10–12 μl of the mix in a cell counting chamber and count cells in a compound fluorescence microscope using UV light.
(iv) Remove supernatant carefully. Use the amount of sample needed to reach the optimal number of cells for the assay and continue with tagmentation step.
C. instestinalis and P. mammillata samples
Immediately place the microtube in a cold centrifuge and spin it at 500 × g and 4°C for 5 min to pellet the embryos. Remove the supernatant carefully.
(i) Wash twice with 200 μl of ASWH by spinning down the cells at 500 × g and 4°C for 5 min.
(ii) Resuspend the pellet in 100 μl of cold lysis buffer and pipet up and down with a P200 micropipette. The lysate should be clear. Lysing Ciona and Phallusia embryos by pipetting can be difficult at early stages like 16-cell and 32-cell stages due to the large amount of yolk per cell. This may take around 3 min of vigorous pipetting with a P200 micropipette. For optimal cell lysis, incubate the cells no longer than indicated and proceed immediately to the next step.
(iii) Transfer 50, 20, and 10 μl of the lysate into new 1.5-ml microtubes and centrifuge them at 500 × g at 4°C for 10 min. Meanwhile, use the remaining 20 μl to count the cells to estimate the number of cells to use in the transposition reaction: add 2 μl of 10× DAPI to 20 μl of the remaining sample. Load the mix in a cell counting chamber and count cells in a compound fluorescence microscope using UV light.
(iv) Remove supernatant carefully with a micropipette. Use the aliquots required (50, 20, and 10 μl) to reach 50,000–90,000 nuclei required in the tagmentation step.
Attention: at this step, the nuclear pellet is hard to see. Avoid touching the bottom of the microtube, where the nuclei are pelleted, to not remove them.
The following procedures can be applied to all samples, regardless of species.
Tagmentation
(1) Keep samples on ice. Prepare tagmentation reaction mix (50 μl) by combining:
25 μl 2× TD tagment DNA buffer
2.5 μl TDE1 tagment DNA enzyme
22.5 μl autoclaved milli-Q water
(2) Gently resuspend the nuclear pellet in the tagmentation reaction mix by pipetting. If more than one aliquot is used to achieve the required cell number, resuspend aliquots by using the same 50-μl tagmentation reaction mix.
(3) Incubate the tagmentation reaction at 37°C for 30 min.
(4) Purify fragmented DNA by using the Qiagen MinElute PCR purification kit, following the manufacturer’s instructions. Firstly, add 2.5 μl of 3 M sodium acetate pH 5.3 to the sample (see Note 2) prior to purification, then continue with the instructions. Elute tagmented DNA in 20 μl of Elution Buffer (see Note 3).
Comment: purified DNA fragments can be stored at −20°C or immediately subjected to the library preparation step (Steps 5 or 6).
Library Preparation
(5) (Optional step) Determine the optimal PCR cycle number for the final ATAC library preparation. The optimal number of cycles is the Ct number obtained performing a qPCR plus one cycle more. Ct number is increased one cycle more to scale reaction and keep ATAC library preparation in exponential phase (see Notes 4, 5).
(I) To do that, prepare the following PCR mix (10 μl):
1 μl tagmented DNA
1 μl forward primer 5 μM (see Note 5)
1 μl reverse primer 5 μM (see Note 5)
1 μl SYBR Green I Nucleic Acid Gel Stain 10×
5 μl NEBNext High-Fidelity 2× PCR Master Mix
1 μl autoclaved milli-Q water
(II) Perform qPCR with the following thermocycling conditions:
(1) 72°C, 5 min
(2) 98°C, 30 s
(3) 98°C, 10 s
(4) 63°C, 30 s
(5) 72°C, 1 min
(6) Repeat steps 3–5, 25 times
(7) Hold at 4°C
(6) To generate the ATAC library, prepare the following PCR mix (50 μl):
19 μl tagmented DNA
1 μl autoclaved milli-Q water
2.5 μl forward primer 25 μM (see Note 5)
2.5 μl reverse primer 25 μM (see Note 5)
25 μl NEBNext High-Fidelity 2× PCR Master Mix.
Comment: if Step 5 was omitted, use all 20 μl of eluted DNA from Step 6 and do not add autoclaved milli-Q water in the PCR reaction mix.
(7) Amplify DNA fragments with the following thermocycling conditions:
(1) 72°C, 5 min
(2) 98°C, 30 s
(3) 98°C, 10 s
(4) 63°C, 30 s
(5) 72°C, 1 min
(6) Repeat Steps 3–5, estimated number of cycles
(7) Hold at 4°C
(8) Purify amplified library using Qiagen MinElute PCR purification kit, following the manufacturer’s instructions. Firstly, add 2.5 μl of 3 M sodium acetate pH 5.3 to each sample (see Note 2) and then continue with the instructions. Elute the purified DNA library in 20 μl Elution Buffer (see Note 3).
Comment: purified DNA can be stored at −20°C.
Quality Controls
(9) Use 1 μl of amplified DNA library to measure DNA sample concentration using Qubit dsDNA BR Assay kit with 500-μl thin-walled tubes. Follow manufacturer’s instructions (see Note 6).
(10) Run 2–5 μl of the amplified DNA library on 2% agarose gel to check tagmentation. A smear covering 100 bp to 1 kb should be observed. Depending on the quality of the library, besides nucleosome-free fragments (<200 bp), a mono- (200 bp) and di-nucleosome (400 bp) band pattern may be observed.
DNA Library Sequencing
(11) The required sequencing depth for the generation of a genome-wide profile with good footprinting signal depends on the genome size of the organism under study. In our experiments, we have used between 40 and 100 million paired-end reads per DNA library.
Data Analysis
The data used was obtained from B. lanceolatum (GSE106428), C. intestinalis (PRJNA474983), and P. mammillata datasets (PRJNA474750). After sequencing, align paired-end reads without adapter sequences against the reference genome using Bowtie2 (Langmead and Salzberg, 2012) with -X 2000 –no-mixed — no-unal parameters. This procedure allows the retention of reads that are separated <2 kb. Then, remove PCR artifacts and duplicates using the tool rmdup, available in the Samtools toolkit (Li et al., 2009). In order to detect the position where transposase binds to the DNA, corresponding to accessible chromatin, read start sites need to be offset by +4 or by -5 bp in the plus or minus strand, respectively. Select read pairs that have an insert <130 bp, since they correspond to nucleosome-free reads. Next, generate BigWig files using genomecov from Bedtools (Quinlan and Hall, 2010) and wigtoBigWig tool from UCSC. These files can be uploaded to a genome browser, in order to explore the data. Call peaks using filtered read files using the MACS2 tool (Zhang et al., 2008). The parameters of this peak calling are –nomodel –shift -45 –extsize 100 and the genome size of the correspondent organism. For each of these peak callings, select the first 500,000 peaks ranked by p-value. Use the irreproducible discovery rate (IDR) framework (Li et al., 2011) for the identification of high confidence peaks based on replicate information, with the following parameters: –input-file-type narrowpeak –rank p.value –soft-idr-threshold 0.1 and the peak calling coming from MACS2. Select high confidence peaks with and IDR global value of 0.01 for further analysis. The proportion of reads inside peaks can be calculated with intersectBed from Bedtools (Quinlan and Hall, 2010), using the high confidence set of peaks as reference and the filtered reads as query, using the parameter -c.
Use the R package DESeq2 (Love et al., 2014) to assess differences between the accessibility of peaks between wt and a test condition. For each comparison, merge all the high confidence peaks of each condition that is going to be analyzed. Then, compute the number of reads inside the peaks for each experimental replicate. Select those peaks that show a p-value under 0.05 as differentially accessible peaks. Then, differentially accessible peaks can be associated with their putative target genes using “Genomic Regions Enrichment of Annotations Tool” (GREAT; McLean et al., 2010) or the closestBED tool (Quinlan and Hall, 2010) utility from BEDtools. For the analysis described in the section “Results,” we used the latter one with the parameters -D ref -iu -non-amecheck -k 1. The consecutive gene ontology (GO) analysis can be performed with PANTHER (Mi et al., 2019). Finally, to find TFBM enrichment in ATAC-seq peaks use the script FindMotifsGenome.pl from HOMER software (Heinz et al., 2010), selecting the set of desired TFBMs with the parameter -mset. As background model, merge high confidence peaks from all ATAC-seq datasets.
Anticipated Results
ATAC-seq assays have been performed in wt embryos of amphioxus and tunicates at different developmental stages mentioned in Tables 2, 3, respectively. ATAC-seq data can be easily visualized in a genome browser. For instance, ATAC-seq tracks generated in amphioxus and the equivalent stage in tunicate embryos are shown in Figure 1B. Interestingly, the ATAC-seq signal in the six3 region identified discrete regions in all three cases. There are more prominent accessible chromatin regions upstream of the six3 gene rather than downstream. In all cases, an ATAC signal is overlapping the TSS or promoter region of the six3 gene. The number of peaks per experiment and the percentage of mapped reads in these peaks are shown in Table 4. In B. lanceolatum samples, the number of peaks was between 16,000 and 48,000, while in both tunicate species, it was between 3,000 and 10,000. The percentage of nucleosome-free reads found in peaks was quite variable in all samples of the three species, but similar between most replicates.
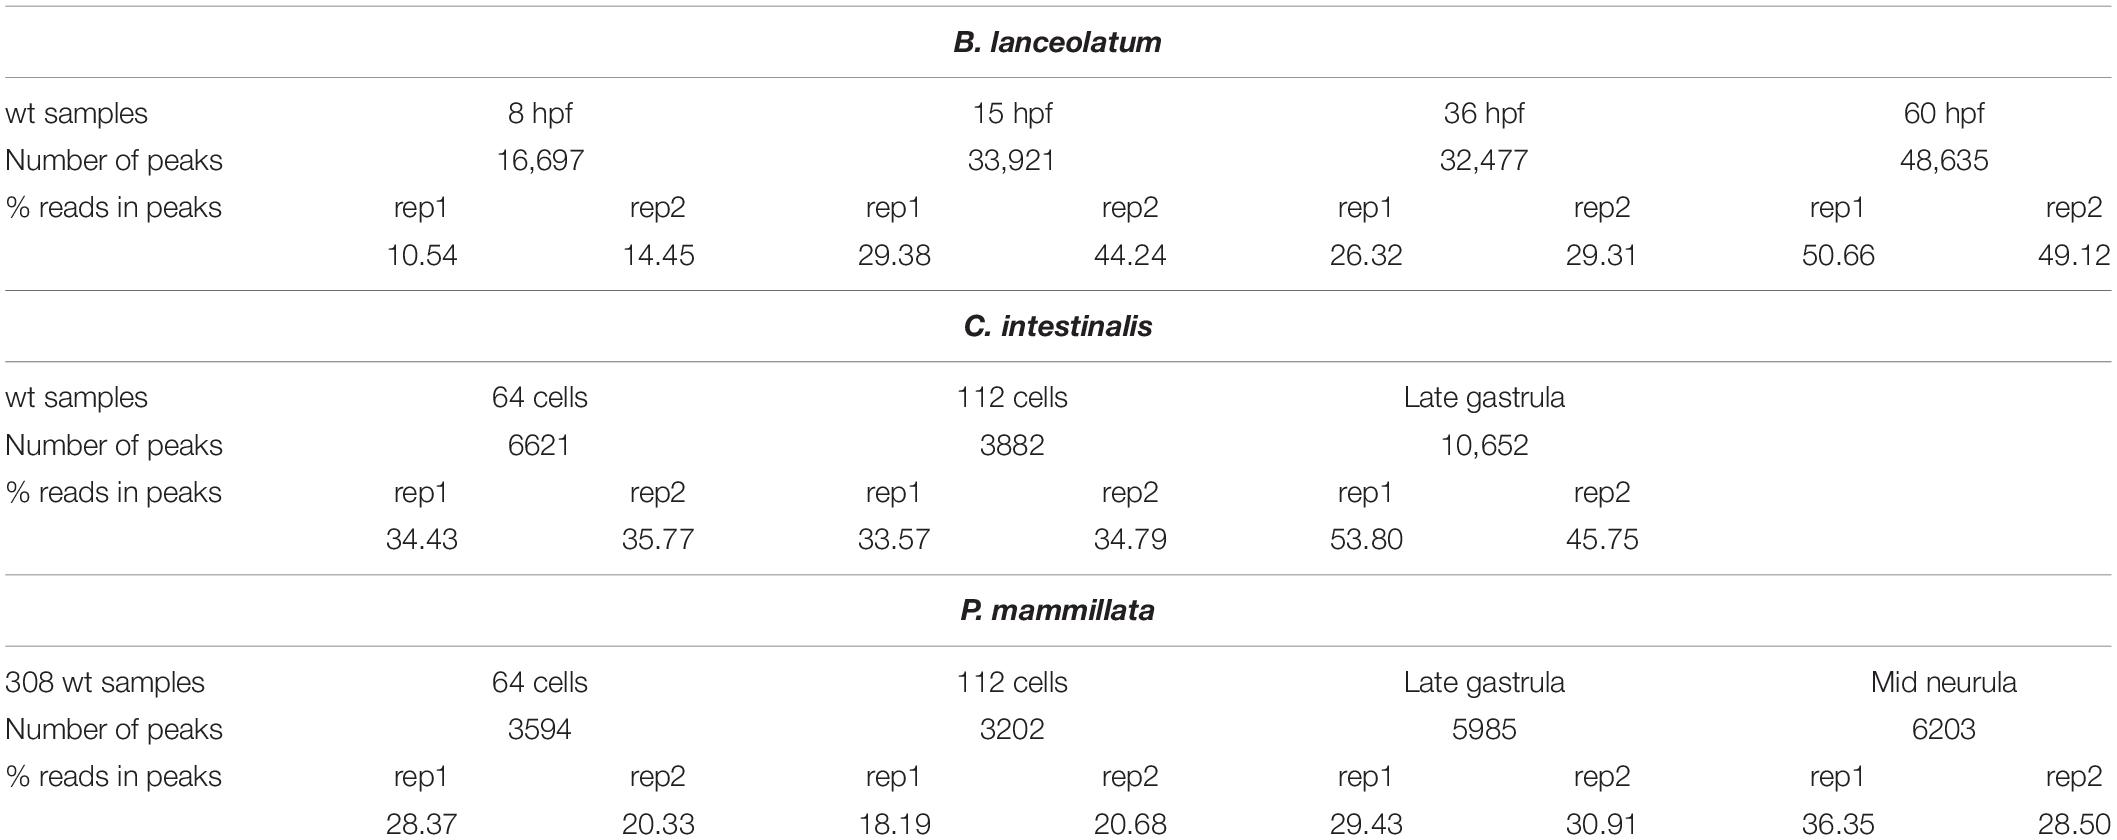
Table 4. Number of conservative peaks obtained by IDR framework and percentage of nucleosome-free reads in conservative peaks.
We also provide an example of using ATAC-seq for the identification of CREs controlled by the Wnt signaling pathway. For that, we used recently generated ATAC-seq libraries from Ciona embryos at the 112-cell stage as a control and embryos treated with 4 μM CHIR-99021, a GSK3 inhibitor acting as an activator of the canonical Wnt pathway (Madgwick et al., 2019). Here, we showed further bioinformatic analysis that allows the identification of differential ATAC-seq peaks between control and treated embryos, the TFBMs enrichment in those peaks, and the GO of the associated genes.
By genome-wide searching for peaks that are differentially accessible between untreated and treated embryos upon Wnt activation, we find 57 more accessible and 40 less accessible ATAC-seq peaks. In fact, we identified two discrete regions in the nkx2.1 locus, which were significantly affected by the treatment (Figure 2A). GO analysis of the genes associated with more accessible chromatin regions underlined the role of Wnt activation in embryo development, as expected. In contrast, genes associated with less accessible ATAC-seq peaks were mostly related to metabolic processes (Figure 2B). Our GO analysis was consistent with differentially expressed gene analysis obtained with another GSK3 inhibitor, known as BIO (Wu et al., 2015). Enrichment analysis, used to predict potential TFBMs in differentially accessible ATAC-seq peaks, showed that Fox, Tcf, and Nkx TFBMs were the most represented in the set of more accessible ATAC-seq peaks (Figure 2C). The enrichment of Tcf, which is an effector TF of the canonical Wnt signaling pathway, validating that the treatment indeed promoted this pathway. On the contrary, Gata motifs were found enriched in the set of less accessible peaks (Figure 2C), confirming the previously reported antagonism between Gata and Wnt in Ciona (Imai et al., 2016).
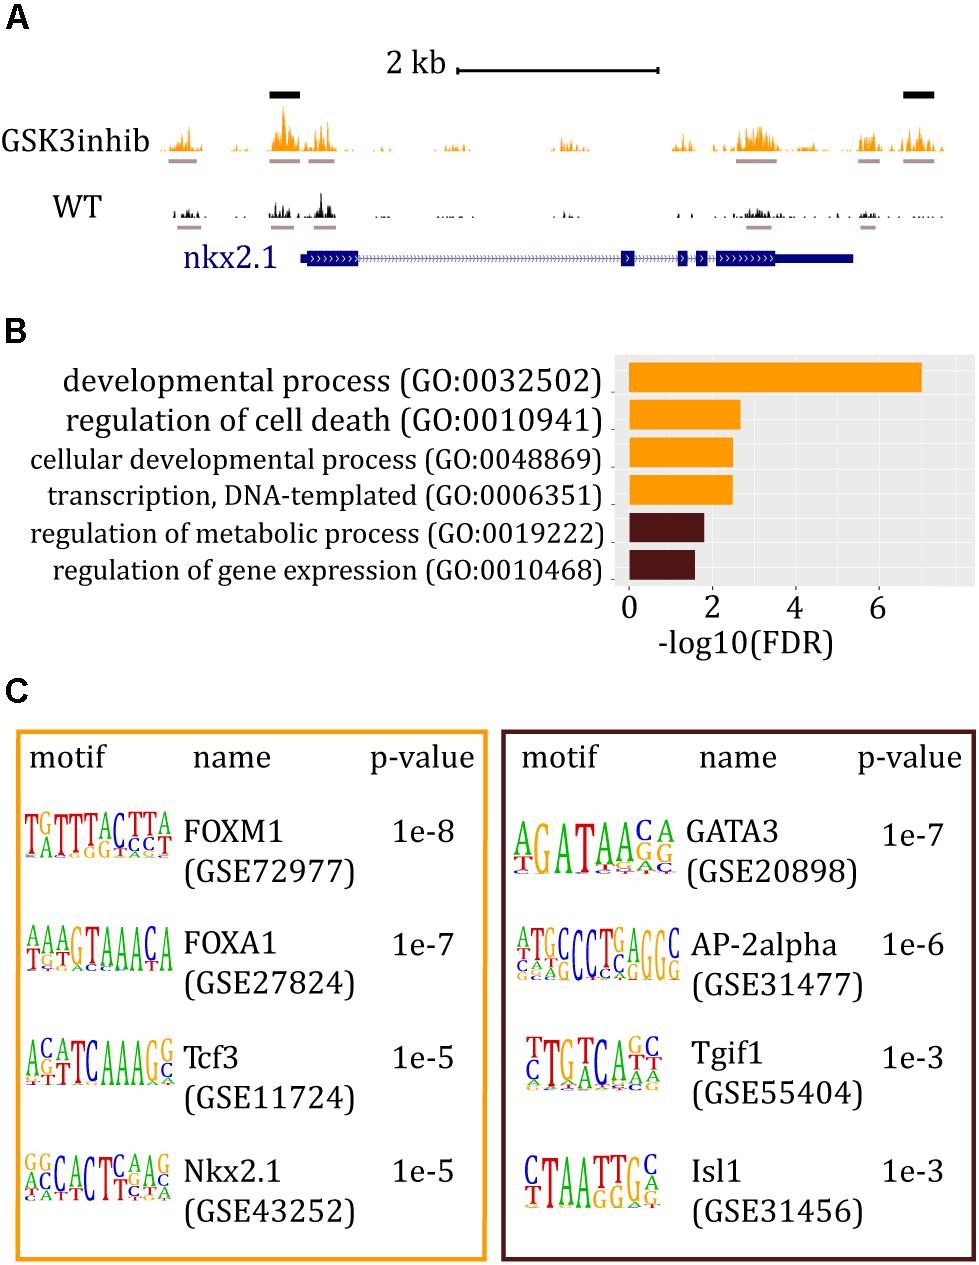
Figure 2. ATAC-seq data and analysis of Ciona embryos at the 112-cell stage after Wnt/β-catenin signaling pathway was altered. (A) Snapshot from the UCSC Browser of Ciona genome showing the ATAC-seq signal around the nkx2.1 gene. The gene model is represented in blue. ATAC-seq track of embryos treated with a GSK3 inhibitor is shown in orange whereas ATAC-seq track of wt embryos is in black. Gray bars mark called peaks, whereas black bars indicate peaks that are significantly higher in treated embryos. (B) Most relevant GO results generated by PANTHER. In orange: GO term bars related to genes associated with chromatin regions significantly more accessible in embryos where the activity of Wnt pathway was increased. In brown: GO term bars related to genes associated with more accessible chromatin regions in wt embryos. (C) HOMER results for peaks differentially represented between wt and the perturbed condition. In the orange box: known motif enrichment results of peaks significantly more represented when Wnt/β-catenin signaling pathway was increased. In the brown box: known motif enrichment results of peaks significantly more represented in wt embryos.
Conclusion
Here, we present a comprehensive ATAC-seq protocol that is highly efficient for the identification of cis-regulatory regions operating during embryogenesis in several marine species. The main advantages of ATAC-seq are the short experimental time and the low amount of starting material needed. We show that this protocol nicely works in embryos from three species, B. lanceolatum, C. intestinalis, and P. mammillata. Moreover, protocols for embryo collection and for experimental procedure are described in detail. Our results pointed out the robustness of the experimental procedure in marine invertebrate embryos and the great utility of the ATAC-seq technique. Since we have succeeded in generating data from the different species tested at diverse developmental stages, we consider this protocol applicable to other species and/or stages. Indeed, in our laboratory, we have successfully applied this method on two different echinoderms and one hemichordate species. Additionally, we present some bioinformatic tools that can be used to analyze and visualize ATAC-seq data (Figure 1B) and, more importantly, identify regulatory regions that respond to alterations in signaling pathways (Figure 2).
Our work demonstrates that performing ATAC-seq in embryos treated with drugs that perturb signaling pathways is a powerful strategy for the genome-wide identification of CREs mediating the activity of different signaling pathways. Indeed, our laboratory is currently successfully applying this approach to study multiple signaling pathways in several invertebrate and vertebrate species. Therefore, one of the major goals of this protocol is to facilitate and encourage the community to use this approach to study their favorite systems and pathways.
Notes
(1) Glass Pasteur pipettes are previously dipped in milli-Q water overnight in order to avoid embryos sticking to the glass.
(2) 3 M sodium acetate, pH 5.3, decreases the pH of the samples. This helps to recover a high quantity of DNA fragments during the purification step, according to the MinElute PCR purification kit manufacturer’s instructions. It is important to not add pH indicator in the binding buffer, because it interferes with downstream sequencing.
(3) Warming the Elution Buffer at 37°C before use is recommended.
(4) To obtain good quality ATAC-seq libraries in this work, we determined that 13–15 PCR cycles were optimal. However, to avoid experimental variations and PCR artifacts, it is recommended to determine the optimal PCR cycle number in every experiment independently.
(5) A complete list of PCR primers complementary to Nextera adaptors is available in Supplementary Table 1 of Buenrostro et al. (2013). In order to multiplex different samples in the same sequencing lane, variable barcoded reverse primers need to be used.
(6) A minimum concentration of 20 ng/μl is recommended for next-generation sequencing.
DATA AVAILABILITY STATEMENT
All datasets generated for this study are included in the article/supplementary material.
Author Contributions
SJ-G, SB, HE, and JG-S developed the protocol for B. lanceolatum samples. MM, PL, and JG-S designed the protocol for C. intestinalis and P. mammillata, and conceived and designed experiments in C. intestinalis embryos. MM and AM performed the ATAC-seq assays in Ciona and Phallusia embryos. SJ-G and MM executed the bioinformatic analysis of B. lanceolatum, C. intestinalis, and P. mammillata ATAC-seq data. MM performed the computational analysis of differential ATAC-seq data of Ciona and data interpretation, and wrote the draft of the manuscript. SJ-G wrote the sections related to the ATAC-seq assays in B. lanceolatum samples. All authors contributed to the manuscript revision.
Funding
This project has received funding from the European Research Council (ERC) under the European Union’s Horizon 2020 Research and Innovation Program (Grant Agreement No. 740041), the Spanish Ministerio de Economía y Competitividad (Grant No. BFU2016-74961-P), and the Andalusian Government (Grant No. BIO-396). This work was also supported by the institutional grant Unidad de Excelencia María de Maeztu (MDM-2016-0687 to the Department of Gene regulation and morphogenesis of Centro Andaluz de Biología del Desarrollo) and by the EMBO short-term fellowship. The laboratory of HE and SB was supported by the Centre National de la Recherche Scientifique (CNRS) and the Agence Nationale de la Recherche (Grant No. ANR-16-CE12-0008-01).
Conflict of Interest
The authors declare that the research was conducted in the absence of any commercial or financial relationships that could be construed as a potential conflict of interest.
Acknowledgments
We thank the members of P. Lemaire and H. Escrivà laboratories for assistance with C. intestinalis, P. mammillata, and B. lanceolatum manipulation, for helping designing the protocol for these organisms. We specially thank Ignacio Maeso for helpful discussion about B. lanceolatum embryos and all members of the Gómez-Skarmeta laboratory for comments about the manuscript and help with data analysis.
Footnotes
- ^ https://github.com/arq5x/bedtools2/releases/
- ^ http://bowtie-bio.sourceforge.net/bowtie2/index.shtml
- ^ https://bioconductor.org/packages/release/bioc/html/DESeq2.html
- ^ http://homer.ucsd.edu/homer/motif/
- ^ https://github.com/nboley/idr
- ^ https://pypi.org/project/MACS2/
- ^ http://www.pantherdb.org/
- ^ https://www.r-project.org/
- ^ http://www.htslib.org/
- ^ https://genome-euro.ucsc.edu/cgi-bin/hgTables?hgsid=231102165_vTWE7h7DGoTv0QlthOAGgKbTLi14
References
Bogdanović, O., Smits, A. H., de la Calle-Mustienes, E., Tena, J. J., Ford, E., Williams, R., et al. (2016). Active DNA demethylation at enhancers during the vertebrate phylotypic period. Nat. Genet. 48, 417–426. doi: 10.1038/ng.3522
Buenrostro, J. D., Giresi, P. G., Zaba, L. C., Chang, H. Y., and Greenleaf, W. J. (2013). Transposition of native chromatin for fast and sensitive epigenomic profiling of open chromatin, DNA-binding proteins and nucleosome position. Nat. Methods 10, 1213–1218. doi: 10.1038/nmeth.2688
Caputi, L., Andreakis, N., Mastrototaro, F., Cirino, P., Vassillo, M., and Sordino, P. (2007). Cryptic speciation in a model invertebrate chordate. Proc. Natl. Acad. Sci. U.S.A. 104, 9364–9369. doi: 10.1073/pnas.0610158104
Christiaen, L., Wagner, E., Shi, W., and Levine, M. (2009). Isolation of sea squirt (Ciona) gametes, fertilization, dechorionation, and development. Cold Spring Harb. Protoc. 4, 1–7. doi: 10.1101/pdb.prot5344
Creyghton, M. P., Cheng, A. W., Welstead, G. G., Kooistra, T., Carey, B. W., Steine, E. J., et al. (2010). Histone H3K27ac separates active from poised enhancers and predicts developmental state. Proc. Natl. Acad. Sci. U.S.A. 107, 21931–21936. doi: 10.1073/pnas.1016071107
Fuentes, M., Benito, E., Bertrand, S., Paris, M., Mignardot, A., Godoy, L., et al. (2007). Insights into spawning behavior and development of the European amphioxus (Branchiostoma Lanceolatum). J. Exp. Zool. Part B 308, 484–493. doi: 10.1002/jez.b.21179
Fuentes, M., Schubert, M., Dalfo, D., Candiani, S., Benito, E., Gardenyes, J., et al. (2004). Preliminary observations on the spawning conditions of the European Amphioxus (Branchiostoma Lanceolatum) in captivity. J. Exp. Zool. Part B 302, 384–391. doi: 10.1002/jez.b.20025
Heinz, S., Benner, C., Spann, N., Bertolino, E., Lin, Y. C., Laslo, P., et al. (2010). Simple combinations of lineage-determining transcription factors prime cis-regulatory elements required for macrophage and B cell identities. Mol. Cell 38, 576–589. doi: 10.1016/j.molcel.2010.05.004
Hotta, K., Mitsuhara, K., Takahashi, H., Inaba, K., Oka, K., Gojobori, T., et al. (2007). A web-based interactive developmental table for the Ascidian Ciona intestinalis, including 3D real-image embryo reconstructions: I. from fertilized egg to hatching Larva. Dev. Dyn. 236, 1790–1805. doi: 10.1002/dvdy.21188
Imai, K., Takada, N., Satoh, N., and Satou, Y. (2000). (Beta)-catenin mediates the specification of endoderm cells in Ascidian embryos. Development 127, 3009–3020.
Imai, K. S., Hudson, C., Oda-Ishii, I., Yasuo, H., and Satou, Y. (2016). Antagonism between β-Catenin and Gata.a sequentially segregates the germ layers of Ascidian embryos. Development 143, 4167–4172. doi: 10.1242/dev.141481
Kittelmann, S., Buffry, A. D., Franke, F. A., Almudi, I., Yoth, M., Sabaris, G., et al. (2018). Gene regulatory network architecture in different developmental contexts influences the genetic basis of morphological evolution. PLoS Genet. 14:e1007375. doi: 10.1371/journal.pgen.1007375
Langmead, B., and Salzberg, S. L. (2012). Fast gapped-read alignment with Bowtie 2. Nature Methods 9, 357–359. doi: 10.1038/nmeth.1923
Li, H., Handsaker, B., Wysoker, A., Fennell, T., Ruan, J., Homer, N., et al. (2009). The sequence alignment/Map format and SAMtools. Bioinformatics 25, 2078–2079. doi: 10.1093/bioinformatics/btp352
Li, Q., Brown, J. B., Huang, H., and Bickel, P. J. (2011). Measuring reproducibility of high-throughput experiments. Ann. Appl. Stat. 5, 1752–1779. doi: 10.1214/11-AOAS466
Loh, K. M., Van Amerongen, R., and Nusse, R. (2016). Generating cellular diversity and spatial form?: wnt signaling and the evolution of multicellular animals. Dev. Cell 38, 643–655. doi: 10.1016/j.devcel.2016.08.011
Long, H. K., Prescott, S. L., and Wysocka, J. (2016). Ever-changing landscapes: transcriptional enhancers in development and evolution. Cell 167, 1170–1187. doi: 10.1016/j.cell.2016.09.018
Love, M. I., Huber, W., and Anders, S. (2014). Moderated estimation of fold change and dispersion for RNA-Seq data with DESeq2. Genome Biol. 15, 1–21. doi: 10.1186/s13059-014-0550-8
Madgwick, A., Magri, M. S., Dantec, C., Gailly, D., Fiuza, U. M., Guignard, L., et al. (2019). Evolution of embryonic cis-regulatory landscapes between divergent Phallusia and Ciona ascidians. Dev. Biol. 448, 71–87. doi: 10.1016/j.ydbio.2019.01.003
Marlétaz, F., Firbas, P. N., Maeso, I., Tena, J. J., Bogdanovic, O., Perry, M., et al. (2018). Amphioxus functional genomics and the origins of vertebrate gene regulation. Nature 564, 64–70. doi: 10.1038/s41586-018-0734-6
McLean, C. Y., Bristor, D., Hiller, M., Clarke, S. L., Schaar, B. T., Lowe, C. B., et al. (2010). GREAT improves functional interpretation of Cis-regulatory regions. Nat. Biotechnol. 28, 495–501. doi: 10.1038/nbt.1630
Mi, H., Muruganujan, A., Ebert, D., Huang, X., and Thomas, P. D. (2019). PANTHER Version 14: more Genomes, a new PANTHER GO-slim and improvements in enrichment analysis tools. Nucleic Acids Res. 47, D419–D426. doi: 10.1093/nar/gky1038
Naujok, O., Lentes, J., Diekmann, U., Davenport, C., and Lenzen, S. (2014). Cytotoxicity and activation of the wnt/beta-catenin pathway in mouse embryonic stem cells treated with four GSK3 inhibitors. BMC Res. 7:273. doi: 10.1186/1756-0500-7-273
Petersen, C. P., and Reddien, P. W. (2009). Wnt signaling and the polarity of the primary body axis. Cell 139, 1056–1068. doi: 10.1016/j.cell.2009.11.035
Quinlan, A. R., and Hall, I. M. (2010). BEDTools: a flexible suite of utilities for comparing genomic features. Bioinformatics 26, 841–842. doi: 10.1093/bioinformatics/btq033
Ruiz, J. L., Tena, J. J., Bancells, C., Cortés, A., Gómez-Skarmeta, J. L., and Gomez-Díaz, E. (2018). Characterization of the accessible genome in the human malaria parasite Plasmodium falciparum. Nucleic Acids Res. 46, 9414–9431. doi: 10.1093/nar/gky643
Sebé-Pedrós, A., Ballaré, C., Parra-Acero, H., Chiva, C., Tena, J. J., Sabidó, E., et al. (2016). The dynamic regulatory genome of capsaspora and the origin of animal multicellularity. Cell 165, 1224–1237. doi: 10.1016/j.cell.2016.03.034
Spitz, F., and Furlong, E. M. (2012). Transcription factors: from enhancer binding to developmental control. Nat. Rev. Genet. 13, 613–626. doi: 10.1038/nrg3207
Wu, Y., Liu, F., Liu, Y., Liu, X., Ai, Z., Guo, Z., et al. (2015). GSK3 inhibitors CHIR99021 and 6-Bromoindirubin-3’-Oxime inhibit MicroRNA maturation in mouse embryonic stem cells. Sci. Rep. 5, 22–24. doi: 10.1038/srep08666
Keywords: ATAC-seq, cis-regulatory elements, invertebrate chordates, amphioxus, tunicates, development, evolution
Citation: Magri MS, Jiménez-Gancedo S, Bertrand S, Madgwick A, Escrivà H, Lemaire P and Gómez-Skarmeta JL (2020) Assaying Chromatin Accessibility Using ATAC-Seq in Invertebrate Chordate Embryos. Front. Cell Dev. Biol. 7:372. doi: 10.3389/fcell.2019.00372
Received: 24 September 2019; Accepted: 16 December 2019;
Published: 24 January 2020.
Edited by:
Pantelis Hatzis, Alexander Fleming Biomedical Sciences Research Center, GreeceReviewed by:
Linda Z. Holland, University of California, San Diego, United StatesSepand Rastegar, Karlsruhe Institute of Technology (KIT), Germany
Copyright © 2020 Magri, Jiménez-Gancedo, Bertrand, Madgwick, Escrivà, Lemaire and Gómez-Skarmeta. This is an open-access article distributed under the terms of the Creative Commons Attribution License (CC BY). The use, distribution or reproduction in other forums is permitted, provided the original author(s) and the copyright owner(s) are credited and that the original publication in this journal is cited, in accordance with accepted academic practice. No use, distribution or reproduction is permitted which does not comply with these terms.
*Correspondence: Marta Silvia Magri, marta.s.magri@gmail.com; José Luis Gómez-Skarmeta, jlgomska@upo.es
†These authors have contributed equally to this work