


Abstract
Gene fusion represents a class of molecular aberrations in cancer and has been exploited for therapeutic purposes. In this paper we describe TumorFusions, a data portal that catalogues 20 731 gene fusions detected in 9966 well characterized cancer samples and 648 normal specimens from The Cancer Genome Atlas (TCGA). The portal spans 33 cancer types in TCGA. Fusion transcripts were identified via a uniform pipeline, including filtering against a list of 3838 transcript fusions detected in a panel of 648 non-neoplastic samples. Fusions were mapped to somatic DNA rearrangements identified using whole genome sequencing data from 561 cancer samples as a means of validation. We observed that 65% of transcript fusions were associated with a chromosomal alteration, which is annotated in the portal. Other features of the portal include links to SNP array-based copy number levels and mutational patterns, exon and transcript level expressions of the partner genes, and a network-based centrality score for prioritizing functional fusions. Our portal aims to be a broadly applicable and user friendly resource for cancer gene annotation and is publicly available at http://www.tumorfusions.org.
INTRODUCTION
One of the consequences of genomic rearrangements in cancer is the generation of chimeric genes where segments of two distinct genes are aberrantly fused together. These fusions can be truncating, disrupting the function of one or either genes, or they can activate proto-oncogenes thus drive neoplasia growth (1). Transcript fusions are relatively infrequent compared to somatic single nucleotide variants and DNA copy number alterations but are among the most commonly targeted molecular abnormalities in cancer. Approved therapies such as crizotinib (ALK and ROS in non-small cell lung cancer), sunitinib (RET in renal cell carcinoma), all-trans retinoic acid (PML-RARα in acute myeloid leukemia) and dasatinib (ABL in chronic myeloid leukemia) target genes activated as a result of transcript fusions. Pertinent fusions for which clinical trials are ongoing include those targeting ETS family members in prostate cancer, TRK family members in various cancers, FGFR2/3 in various cancers and BRAF in multiple cancer types.
Traditional methods to identify gene fusion were mostly through cytogenetics, fluorescence in situ hybridization and PCR (1). Over the past decades, high throughput measurement of RNA expression and RNA structural variation through microarrays and sequencing have opened up ways to detect somatic transcript chimeras in a comprehensive manner, leading to numerous novel oncogenic fusions were discovered including but not limited to TMPRSS2-ERG, FGFR3-TACC3 and DNAJB1-PRKACA (2–5). The datasets made available through The Cancer Genome Atlas (TCGA) research network represent an unparalleled public resource for fusion discovery. In fact, fusion identification has become a standard analysis performed by every working group for every cancer type included in TCGA (6–8). Our group and others have previously reported pan-cancer analysis of transcript fusion frequencies (9–11). Here, we describe our results on expanding our pan-cancer analysis from 13 to 33 tumor types, including a large cohort of non-neoplastic tissues and whole genome sequencing on >500 cancer samples to validate our findings. Our results can be accessed through our TumorFusions web data portal (http://www.tumorfusions.org), which enables researchers to query and review fusions in an interactive manner.
MATERIALS AND METHODS
TCGA DNA and RNA sequencing data were downloaded from Cancer Genomics Hub (CGHub, https://cghub.ucsc.edu). Copy number segmentation data and gene expression data were downloaded from Firehose (https://gdac.broadinstitute.org/). Of 689 normal samples, we excluded 41 samples because they clustered with tumor samples in unsupervised hierarchical clustering (all genes, ward’s method). The resulting panel of normal samples (n = 648) were subjected to the same fusion detection pipeline and were used as controls to filter out potential germline fusion events and artifacts. We applied PRADA (12) to all RNAseq samples for data preprocessing and fusion calling. We required at least two discordant read pairs and one junction spanning read as the minimum criteria to call a fusion candidate. All fusion candidates were subject to six additional filters (Supplementary Methods). We integrated three resources including Mitelman (13), ChimerPub (11) and Cosmic fusions (14) to build a positive control fusion list (the white list). Each fusion on the list had support from at least three independent publications, leading to a list of 321 unique gene–gene fusions. Of these 321, 38 fusions were detected in our dataset. The 283 gene–gene combinations that were not detected in the TCGA dataset may reflect the relatively small diversity of cancer types profiled by TCGA compared to the literature.
Of the 9966 tumor samples included in our RNAseq analysis, TCGA has performed whole genome sequencing on 561 tumor samples and their matching germlines. We used SpeedSeq to process whole genome sequencing data and called DNA structural variants with default parameters on all 561 tumor samples and matching normal (15). Germline events were filtered out by comparing with matched normal samples. We scanned the intersection between the edge of confident interval from structure variants and fusion events. Three confidence levels were assigned once the structural variant was found in the proximity of a fusion. When using copy number data from SNP arrays to validate fusions, we required a 100 Kb window to the expected orientation for both partner genes. More details can be found in the Supplementary Methods.
Fusion transcript centrality score was calculated based on domain-based fusion model using default parameters (https://bmsr.usc.edu/software/targetgene/), to predict the oncogenic driver in which partner genes act as hubs in a cancer pathway network (16).
RESULTS
Fusion identification and validation
We analyzed mRNA sequencing data from 9966 cancer samples and 689 non-neoplastic samples from The Cancer Genome Atlas (TCGA) (Figure 1 and Supplementary Table S1). We included non-neoplastic samples in our analysis to establish a list of transcript fusions detected due to sequencing artefacts and germline copy number polymorphisms. Non-neoplastic samples in TCGA are frequently obtained through tissue biopsy adjacent to the location of the cancer and is therefore at risk of being contaminated with tumor cells. We used unsupervised clustering of cancer and normal samples to identify 41 normal samples that were at risk for cancer cell contamination, which were excluded from further analysis. Preprocessing, including read alignment to both genome and transcriptome, and fusion detection were carried out using our Pipeline for RNAseq Data Analysis (PRADA) (12). Processing of the 55 terabyte TCGA dataset resulted in the identification a total of 56 198 and 3838 raw fusion events in 9966 cancer samples and 648 normal samples, respectively. The inclusion of panel of normal samples was important as this resulted in the filtering of 13 844 fusion predictions, likely resulting from putative germline events or common artifacts introduced by misalignment. An example of a germline polymorphism resulting in fusions between TFG and GPR128 (n = 9, 1%) on chr3q12.2 which were associated with focal copy number changes in the germline and represent an example of a germline polymorphism (17) resulting in a transcribed fusion gene. Following the filtering of fusions detected in normal samples, we applied six filters controlling for sequence similarity of the partner genes, transcriptional allelic fraction, dubious junctions, germline events and presence in non-neoplastic tissue. This finally resulted in a list of 20 731 high confidence fusion events, averaging two fusions per sample (Supplementary Table S2).
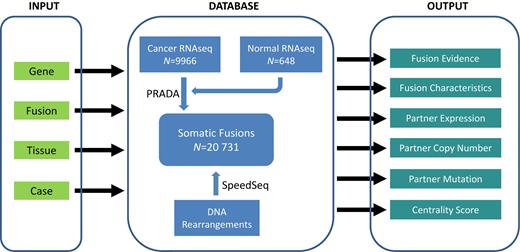
The diagram of TumorFusions portal and its main features. The portal can be separated into three components, and the major features of each component are highlighted in rectangle. ‘Tissue’ in INPUT represents a TCGA cancer type.
We next used two sources of DNA data to validate the fusion calls. In the first approach we called somatic DNA rearrangements from whole genome sequencing (WGS) data for 561 cancer samples and their matched normal. Raw reads alignment and structural variant calling were performed using the SpeedSeq suite with the same parameters across the cases (15). We aligned the genomic coordinates of transcript fusion junctions to the DNA coordinates of structural variant junctions. In the case of the 5′ partner, if the fusion junction was located between the structural variant junction and the start of the gene, we considered the fusion junction matching with the structural variant. Similarly for the 3′ partner, if the fusion junction fell between the structural variant junction and the end of the gene, we considered the transcript fusion to match the structural variant. We found 1679 of 2585 fusions (65%) observed in these 561 samples to be associated with structural variants. Of these fusion related structural variants, the majority were translocations (50%), followed by deletions (20%), inversions (20%) or duplication (10%) (Supplementary Figure S1). In the second validation step, we used DNA copy number profiles estimated by Affymetrix SNP 6.0 arrays, making use of the property of structural variants to be associated with changes in DNA copy number levels. Changes in DNA copy number are reflected as different DNA segments in the SNP6 data. We mapped the genomic position of transcript fusions and compared these to the genomic coordinates of DNA segment boundaries. While the accuracy of this method may be less than WGS-inferred genomic rearrangements, we took advantage of the large number of cases with an available Affymetrix SNP6.0 array profile (n = 9825). We found that 54% of fusions were supported by at least one DNA breakpoint near the fusion junction (100 kb window). The difference in percentages of fusions supported by a DNA level alteration likely reflected the sensitivity differences between SNP arrays and DNA sequencing. For benchmarking purposes, we curated a list of 321 known fusions (Supplementary Table S1) by integrating Mitelman (13), ChimerPub (11) and Cosmic fusions (14). We applied the same validation strategies to this list and observed validation rates of 68 and 52%, respectively, for sequencing-based and array-based approaches. These similar rates suggest our fusion calls were likely enriched for bona fide fusions. We note that the absence of DNA evidence may result from events such as trans-splicing (18), or may reflect the complexity of calling structural variants leading to reduced sensitivity and specificity (19). Improving the accuracy and sensitivity of structural variant and transcript fusion detection methods may further impact the percentage of fusions associated with structural variants.
Portal update
In Table 1 we summarize data volume and new features of the portal. Notably all cases, including those analyzed in our original paper (10), were processed in a uniform pipeline thus the updated portal did not just inherit calls from the previous version (Supplementary Table S3). The increased number of normal samples gave us better ability to differentiate somatic from germline fusions.
A summary of portal update since its first publication in 2015
| FusionPortal | |
|---|---|
| Cancer types | 33 |
| Number of cancer samples | 9966 |
| Number of normal samples | 648 |
| Number of fusions | 20 731 |
| WGS validation included | yes |
| Centrality score | yes |
| Fusions found in normal searchable | yes |
| IGV link provided | yes |
| Mutation pattern link provided | yes |
| Partner gene expression provided | yes |
| Exon expression provided | yes |
IGV: Iintegrative Genomic Viewer.
| FusionPortal | |
|---|---|
| Cancer types | 33 |
| Number of cancer samples | 9966 |
| Number of normal samples | 648 |
| Number of fusions | 20 731 |
| WGS validation included | yes |
| Centrality score | yes |
| Fusions found in normal searchable | yes |
| IGV link provided | yes |
| Mutation pattern link provided | yes |
| Partner gene expression provided | yes |
| Exon expression provided | yes |
IGV: Iintegrative Genomic Viewer.
The portal provides four search modes, by fusion, gene, sample and cancer type. The set of fusion transcripts detected in the 648 non-neoplastic samples is separately available for querying. Once a fusion of interest is selected, the portal displays all instances of this fusion found in the 9966 cancer samples. The full list of fusions in cancer and non-cancer samples is available as a supplementary table to this paper (Supplementary Table S2) and through the download option on the portal. The returned table provides links to copy number and somatic mutation patterns hosted at cBio portal (http://www.cbioportal.org) and the Broad Institute (http://www.tumorportal.org), a feature that allows users to intuitively assess the significance of alterations in the partner genes in the specific cancer type. The detail page contains all supporting evidence of the fusion found in RNAseq, including the number of discordant read pairs and junction spanning reads. Two images embedded in the page illustrate the expression abundances of the two partner genes and their exon level expressions, respectively. An example page is shown in Supplementary Figure S2. An important addition to the fusion detail page is centrality score, a metric calculated based on a neighboring gene network to reflect the functional consequence of a fusion gene (16).
Another addition to the portal is a summary page where the top frequent fusions and partner genes are highlighted and ready for browsing. The list includes several recurrent fusions that are currently under intensive clinical testing such as FGFR3-TACC3 and ETV6-NTRK3. This page also hosts quick guide links to the most frequent fusion events for each cancer type.
Novel insights from the new fusion portal
Since all fusions were identified by the same criteria, we had the opportunity to examine their distributions across human cancer. The median number of fusions per sample was generally low, however, cases with high number of fusions were observed in many cancer types such as sarcoma, stomach cancer, breast cancer and endometrial carcinoma (Supplementary Figure S3). The majority of the 20 731 fusions were singletons (n = 17 238, 83.2%). Among the 1205 recurrent fusions, 850 were found in only two cases. These data suggest that gene fusions are frequently not selected for but represent collateral DNA rearrangement damage. The most frequent recurrent fusions were lineage specific, such as TMPRSS2-ERG in prostate cancer, CCDC6-RET in thyroid cancer, and PML-RARA and CBFB-MYH1 in acute leukemia. In contrast FGFR3-TACC3 (n = 36), PTPRK-RSPO3 (n = 9) and EML4-ALK (n = 7) were found across multiple originating tissues (Figure 2 and Supplementary Table S2). We identified 2003 fusions involving a kinase, which included 1130 fusions in which the kinase gene was the 5′ partner, 914 where kinase was the 3′ partner, and 41 fusions in which both partners were a kinase. For those fusions (n = 1052) were we were able to retrieve the relative position of the kinase domains to the fusion breakpoint from the Human Protein Reference Database (20), 90% (366/405) of the 3′ partners lost their kinase domains, in contrast to 50% (326/647) for 5′ partners. The difference was statistically different (P < 2.2e-16, chi-square test). Transcript fusions of kinase genes that result in loss of the kinase domain may have the purpose of (de-) activating other gene functionalities, and possible biases in our analysis as a result of the lack of kinase domain position information needs to be considered. The most frequent, novel kinase fusion was TMEM87B-MERTK found in seven cases. Mutations in MERTK has been associated with retinal degeneration as well as various human cancers (21).
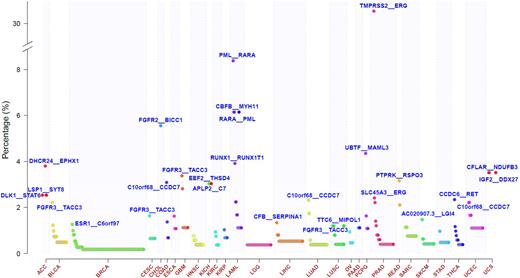
Frequency of recurrent fusions across 33 cancer types. Y-axis represents percentage of cohort wherein the fusion is found. Only recurrent fusions are shown in the figure. The top frequent fusion in each cancer type is labeled and space permitting known cancer fusions are additionally shown.
Breaking fusions down into their separate gene partners, we found that other than TMPRSS2 and ERG, recurring fusion partner genes were usually found in more than one tissue of origin (Figure 3). TRK fusions, targeting of which by larotrectinib has recently shown promising clinical efficacy (22), were found in 28 cases across 11 cancer types. Other fusions with potential clinical relevance included BRAF associated fusions in 30 cases from 11 cancer types, for which sorafenib may provide a therapeutic advantage (23); MET fusions in 20 cases from 10 tumor types which may respond to crizotinib (24), and ROS1 fusions in six cases of lung adenocarcinoma and glioblastoma (25). In aggregate 7470 genes were found in fusions in more than one sample, as either 5′ or 3′ partner gene, representing about 30% of the annotated genes in the human genome.
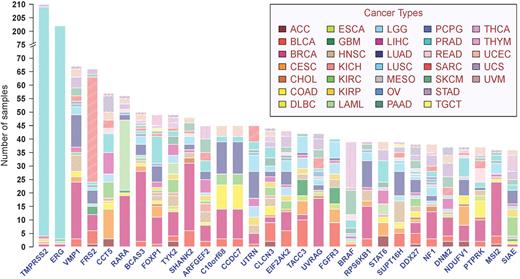
Top frequent partner genes in recurrent fusion transcripts across 33 cancer types. Y-axis represents frequency of partner genes in the pan-cancer cohort.
The centrality score measures the functional effects fusion genes and we found that known driver fusions from our curated list had significantly higher centrality scores than other fusions (P < 2.2e-16, t-test; Supplementary Figure S4). Notable novel recurrent fusions with high centrality scores include ERC1-RET (n = 3), ERBB2-PPP1R1B (n = 4) and KLK2-FGFR2 (n = 3).
To gain insight into the underlying DNA mechanisms, we examined the mapping between fusions and DNA rearrangements in cases where both data were available. While 57% of fusions (n = 962) were mapped to a single structural variant, 21% (n = 348) were associated with three or more structural variants. Such fusion events likely resulted from complex DNA rearrangement events. We found a significant enrichment for chromosome arm 12q fusions in sarcoma (adjusted P < 0.001, Chi-square test) (Supplementary Figure S5), seen previously in glioblastoma (26). The 12q13–15 growth factor signaling gene FRS2 was frequently involved as the 5′ partner (Supplementary Figure S6), nominating FRS2 as a relevant target in this disease (27). Pertaining to sarcomas with a complex 12q (21%), we counted how many cases harbored excessive fusions since this complex karyotype may generate more fusion transcripts. The median number of fusions per case across the pan-cancer dataset was two and we applied a conservative arbitrary cutoff (n ≥ 20) to designate samples as having an excessive number of fusions. In the sarcoma cohort, 9% of cases showed more fusions than 20 fusions, compared to 2% in other cancers, identifying sarcoma as especially transcript fusion-prone (P = 1.78e-21, Chi-square test; Supplementary Figure S3).
DISCUSSION
Technological advances allow testing the oncogenicity of these fusion events in a high throughput manner (28) and clinical trial design is evolving towards adaptive design across cancer baskets (29), supported by our ongoing characterization of transcript fusions. The fusion portal serves as an interface for researchers to access our rigorously and conservatively attained fusion list. It allows users to query a gene of interest as to whether it is involved in a fusion, and if so how the gene is mutated in both nucleotide sequence and copy number; it allows the assessment of the frequency of a fusion in adult cancer thus informs basket trials; it enables the inspection of breakpoints of the fusion, and links copy number alteration to transcriptional consequences. Our portal provides an important layer of annotation to samples included in The Cancer Genome Atlas that to date has been difficult to access. The portal pinpoints fusions to specific TCGA cases thus facilitates integrative analyses wherein fusions can be taken into account (30). This feature distinguishes our fusion portal from several other fusion databases as it complements alterations such as nucleotide mutation and DNA dosage alteration on the same set of samples cataloged by other resources such as cBio (http://www.cbioportal.org) and the tumor portal of the Broad Institute (http://www.tumorportal.org). Recently ChimerDB was updated to include more than 5000 TCGA cases (11). Our portal almost doubles that size, and our uniform identification pipeline could provide an independent source of querying TCGA for fusion events. Although the tumor fusion portal is currently built upon TCGA data, it is not bound to TCGA and expansion beyond TCGA is currently being scheduled. This includes but is not limited to pediatric cancers, in which fusion genes frequently are tumor initiating events, cancer cell lines available through the cancer cell line encyclopedia (31) and to integrate with published cancer cell line fusion resources (32). The future addition of cell line data will help researchers identify model systems wherein an endogenous fusion can be tested and manipulated.
We anticipate to add more features to the portal, in addition to data volume expansion. A particularly intriguing direction is to include details of the DNA rearrangement events underlying each fusion in contrast to just using the DNA data as a validation approach. This direction entails better integration of more whole genome sequencing data, a task that can be further facilitated by the continuous development of rearrangement calling tools.
AVAILABILITY
The TumorFusions web data portal is publicly available at http://www.tumorfusions.org. No registration is required.
SUPPLEMENTARY DATA
Supplementary Data are available at NAR Online.
ACKNOWLEDGEMENTS
This study is in whole or partially based upon data generated by The Cancer Genome Atlas project established by the NCI and NHGRI. Information about TCGA and the investigators and institutions that constitute the TCGA research network can be found at http://cancergenome.nih.gov. The authors thank Jinzhen Chen and Boyd Sally for their IT support. We also thank Dr. Nicolas Stransky for insights in filtering fusions seen in non-neoplastic samples.
FUNDING
National Institutes of Health [R01CA19012, R21 CA198320 to R.G.W.V., P50CA127001 to R.G.W.V., Z.S.]; Cancer Prevention and Research Institute of Texas [R140606 to R.G.W.V.]; Cancer Center Support Grants [P30CA16672, P30CA034196]. Funding for open access charge: National Institutes of Health [R01CA19012, R21CA198320, P50CA127001].
Conflict of interest statement. None declared.
REFERENCES
Author notes
These authors contributed equally to the paper as first authors.

Comments