


Abstract
The data and tools in PANTHER—a comprehensive, curated database of protein families, trees, subfamilies and functions available at http://pantherdb.org—have undergone continual, extensive improvement for over a decade. Here, we describe the current PANTHER process as a whole, as well as the website tools for analysis of user-uploaded data. The main goals of PANTHER remain essentially unchanged: the accurate inference (and practical application) of gene and protein function over large sequence databases, using phylogenetic trees to extrapolate from the relatively sparse experimental information from a few model organisms. Yet the focus of PANTHER has continually shifted toward more accurate and detailed representations of evolutionary events in gene family histories. The trees are now designed to represent gene family evolution, including inference of evolutionary events, such as speciation and gene duplication. Subfamilies are still curated and used to define HMMs, but gene ontology functional annotations can now be made at any node in the tree, and are designed to represent gain and loss of function by ancestral genes during evolution. Finally, PANTHER now includes stable database identifiers for inferred ancestral genes, which are used to associate inferred gene attributes with particular genes in the common ancestral genomes of extant species.
INTRODUCTION
PANTHER is a database of gene families, including a phylogenetic tree for each family in which nodes of the tree are annotated with gene attributes. The three types of gene attribute currently annotated in PANTHER are ‘subfamily membership’, ‘protein class’ and ‘gene function’. As described in more detail below, these tree node annotations are used to divide families into subfamilies, and to infer functions for subfamilies or for individual genes in the tree. In addition to gene attributes, internal nodes are also annotated by the type of evolutionary event they represent, e.g. speciation, gene duplication or horizontal gene transfer.
Perhaps the most important application of PANTHER is the inference of gene function for uncharacterized genes from any organism. The PANTHER website provides tools for functional analysis of lists of genes or proteins. Gene lists can be analyzed graphically in terms of sortable functional classes, pie or bar charts; or analyzed statistically by overrepresentation or enrichment tests. The overrepresentation test takes a list of genes and finds functional classes that are overrepresented (or underrepresented) in the list compared with some reference list, e.g. a list of all genes in a genome. The enrichment test takes a list of genes, each with a numerical value, optimally this list is genome wide (i.e. there is a value for as many genes in a genome as possible); it then finds functional classes for which the genes of that class have values that are non-randomly selected from the genome-wide distribution of values. In addition, the PANTHER trees are being annotated with gene ontology (GO) (1) terms as part of the GO reference genome project (2,3), and these annotations are being deposited directly into the GO database.
The PANTHER database and tools have had considerable longevity, and their utility shows no sign yet of obsolescence [Figure 1 (4–6)]. Initially developed starting in 1998 in preparation for analysis of the first human genome sequence, PANTHER has undergone continual improvement to the point where the data generation processes now bear little resemblance to those reported in the initial publications (7,8). While the major improvements have been reported piecemeal in subsequent publications (9–11), the lack of an up-to-date, detailed description of the entire PANTHER pipeline may make it difficult for users to understand the current contents. In the following sections, we describe the current PANTHER processes, as well an overview of the website tools focusing on recent enhancements to the user interface.
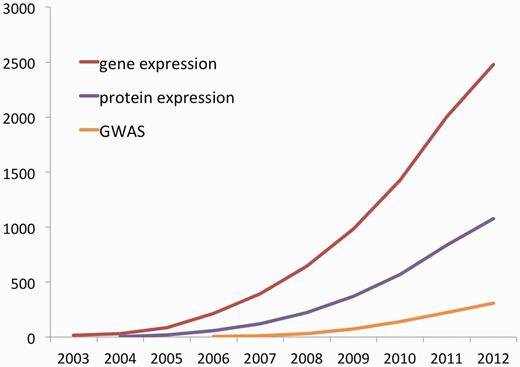
Cumulative citations of PANTHER for different research applications. All searches have an exclusion filter to remove false positives, which includes terms such as ‘panther publishing’, ‘panther informatics’, ‘black panther’ and 15 other terms. Data from Google Scholar as of 1 October 2012, so figures for 2012 will appear artificially low.
PANTHER PROTEIN LIBRARY DATA GENERATION PROCESS
The overall process of PANTHER Protein Library data generation can be divided into three major steps: family clustering, phylogenetic tree building and annotation of tree nodes (Figure 2).
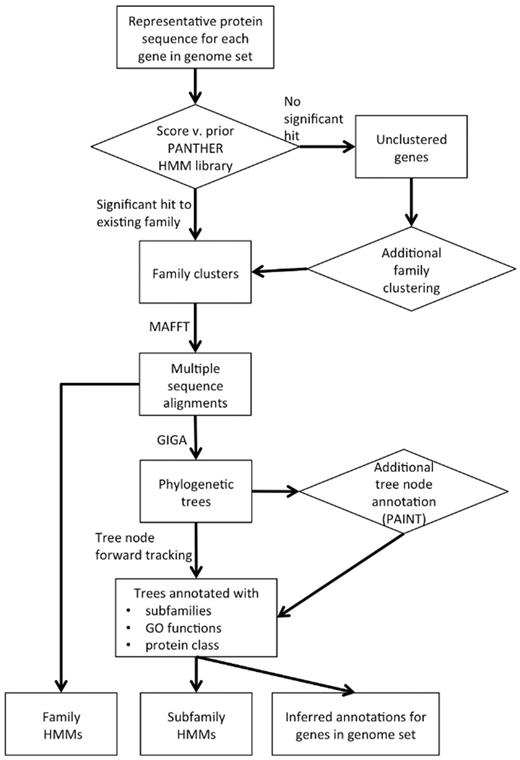
PANTHER data generation process overview.
Family clustering
Sequence set
Starting with PANTHER version 7.0, PANTHER trees are intended to represent gene family evolution across a broad selection of fully sequenced genomes. Thus, there is one sequence entry per gene (a protein sequence) so the trees can be annotated with events in genome evolution such as speciation and gene duplication. The set of genomes are chosen based on two main criteria: (i) they include all the major experimental model organisms so that functional information determined in those organisms can be integrated and propagated to less well studied genomes; (ii) they include a broad taxonomic range of other genomes, preferably fully sequenced and annotated, and especially in key phylogenetic positions that help to relate the experimental model organisms to each other. Starting with version 8.0, PANTHER uses the reference proteome set maintained by the UniProt resource (http://www.ebi.ac.uk/reference_proteomes/). The 2012 reference proteome release includes 79 genomes. PANTHER 8.0 also includes three additional genomes from PANTHER 7.2 that are not yet available as complete genomes from UniProt (Ashbya gossypii, Caenorhabditis briggsae and Oryza sativa). The single, representative protein sequence for each gene is chosen to be the curated Swiss-Prot entry whenever possible, and otherwise is the longest available sequence. Together, these sets comprise 991 985 protein-coding genes. Figure 3 summarizes the phylogenetic distribution of genomes included in the PANTHER reference trees.
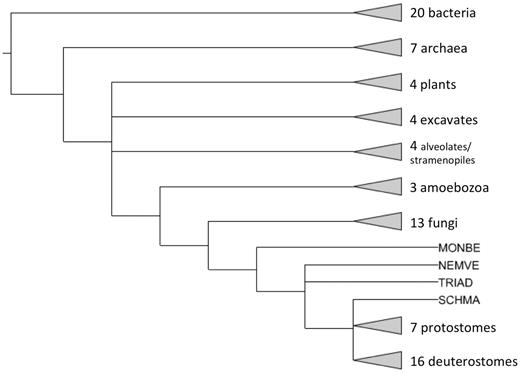
Phylogenetic distribution of genomes in PANTHER reference trees. Triangles at the end of branches represent clades with more than one genome, whereas other branch tips represent single genomes. MONBE (Monosiga brevicollis, choanoflagellate), NEMVE (Nematostella vectensis, sea anemone), TRIAD (Trichoplax adhaerens, placozoan) and SCHMA (Schistosoma mansoni, trematode).
Family clusters
PANTHER families have been refined over a period of many years. The basic requirements for a family currently are: (i) that the family is of sufficient size, namely families must contain at least five total members (in PANTHER 7.2), including at least one gene from a GO ‘reference genome’ (human, mouse, rat, chicken, zebrafish, Drosophila melanogaster, Caenorhabditis elegans, budding yeast, fission yeast, Dictyostelium discoideum, Arabidopsis thaliana and Escherichia coli) and (ii) that they have a sequence alignment of adequate quality to support phylogenetic inference. We assess the multiple sequence alignment by assessing alignment length (at least 30 sites aligned across 75% or more of family members) and quality (the derived HMM must be able to recognize with statistical significance the sequences used to train it). To create the families for a new release, all protein sequences in the new set are scored against the HMMs from the previous release using InterProScan (12), and assigned to the family with best score (viz. the lowest expectation or E-value) below a significance threshold (E < 0.001). In each release, we may remove, split or merge families based on feedback from users or the InterPro Consortium, which is integrating PANTHER models into the InterPro resource. In PANTHER version 8.0, a total of 642 319 genes are included in the family clusters, which accounts for 64.8% of the total sequences in the gene set. The exact statistics for each genome can be found at http://www.pantherdb.org/panther/summaryStats.jsp, but in summary, because of the bias in the model organism set, the coverage currently tends to highest for animal genomes, lower for other eukaryotes and lowest for prokaryotes. Compared with previous versions of PANTHER, the coverage of non-animal genomes in particular has increased substantially. Approximately 1000 families were added in version 7.2, in collaboration with the InterPro group at the European Bioinformatics Institute, using the CluSTr algorithm (13) to define the new families. In version 8.0, we have also removed a substantial number of families, primarily small families comprised of sequence fragments, which did not pass our quality checks but were erroneously released in version 7.0. The HMMs from these spurious families do not even recognize their training sequences, so their presence in version 7 would have been invisible to most users.
Phylogenetic tree building and ortholog inference
For each family, we first construct a multiple sequence alignment using the default setting of MAFFT (14). The alignments are masked such that any column is removed if it aligns fewer than 75% of the sequences (this is a weighted percentage such that sequences with greater similarity to other sequences in the alignment are given lower weights to account for the phylogenetic biases in the sequence set). The masked alignments are then used as input for the GIGA program (15). GIGA uses the known species tree to guide tree construction, and at each step of the algorithm attempts to reconcile the gene tree in terms of a model of speciation and gene duplication events. In the output tree from GIGA, internal tree nodes are labeled as to whether the divergence at that node is inferred to be a speciation or duplication event. Thus, even though protein sequences are used in the reconstruction of evolutionary relationships (see previous section), the trees should be interpreted as evolutionary trees of genes, where internal nodes represent genes inferred to have been present in the genomes of ancestral species that were the last common ancestors for the species in the gene set. This approach has practical advantages for annotation of gene function, at the expense of strict accuracy in some rare but important evolutionary scenarios. The strict adherence to the species tree means that higher-level functions like most biological processes, that often have lineage-specific variations, can be represented properly by gene tree annotation. It also has practical advantages for inferring the gene complement of ancestral genomes. On the other hand, cases (such as incomplete lineage sorting and some instances of gene conversion) in which the locus history is actually expected to diverge from the species tree, will not be represented accurately.
For each extant gene (leaf) in the tree, orthologs are inferred from the tree topology. Orthology is a pairwise relationship: two genes (from different genomes) are orthologs if they derive from the same gene in the common ancestor genome (16). Thus in the phylogenetic gene trees in PANTHER, two genes are orthologs if their last common ancestor is a speciation node. A file of all orthologs is available on the PANTHER ftp site, and orthologs of each gene are displayed at the bottom of gene pages on the PANTHER website. Note that if one or more gene duplication events occur in the gene tree following speciation, a gene can have more than one ortholog in another species. In this case, PANTHER reports multiple orthologs but it also uses the PANTHER tree to automatically define a ‘least diverged’ ortholog (LDO) pair: the ‘equivalent’ genes in the two species. Formally, the LDO in PANTHER is defined as the one orthologous pair that has the shortest tree branch length (protein sequence divergence) immediately following each post-speciation duplication event.
Annotation of tree nodes
Each node in a PANTHER tree can be annotated with ‘heritable attributes,’ and in the current version of PANTHER three different types of heritable attribute are used to annotate tree nodes: subfamily membership, gene function and protein class membership. These node annotations become annotations of the primary sequences that were used to construct the tree (the ‘leaves’ of the tree), by simply applying the evolutionary principle of inheritance: annotations of each tree node are inherited by (or ‘propagated to’) its descendant nodes. This captures the primarily conservative mode of evolution. Importantly, however, tree node annotations can also capture the loss of an attribute that would otherwise have been inherited. In this way, divergence of attributes can be represented. This annotation paradigm has been described in detail (3).
Annotation of subfamilies, GO functions and protein classes
Initial annotation
Annotation of these attributes is performed primarily by manual review by an expert curator with extensive software assistance. Curators define subfamilies by selecting a node in the tree and annotating the node with a subfamily name [subfamily names are commonly taken from Swiss-Prot (17) protein names]. The software then assigns a subfamily identifier to the subfamily, and automatically infers subfamily members by inheritance from the annotated node. In the current PANTHER version, each node of the tree can belong to only one subfamily, so each node inherits the subfamily name only from its most recent annotated ancestor. Formally, PANTHER represents this information as subfamily membership gain and loss events during evolution. An example is shown in Figure 4, in which P73 subfamily membership is inferred to have been gained (or founded) at the annotated node. All descendants of this node inherit this membership, except for nodes that are also descendants of the node annotated with P63 or P53. At the annotated P53 node (which gains P53 subfamily membership), P73 subfamily membership is inferred to have been lost. Thus descendants of this ancestral P53 are also inferred to be members of only the P53 subfamily. Note that this model can also represent membership of a node in more than one subfamily; in Figure 4, if we removed the loss event, P53 subfamily members would also be members of the P73 subfamily.
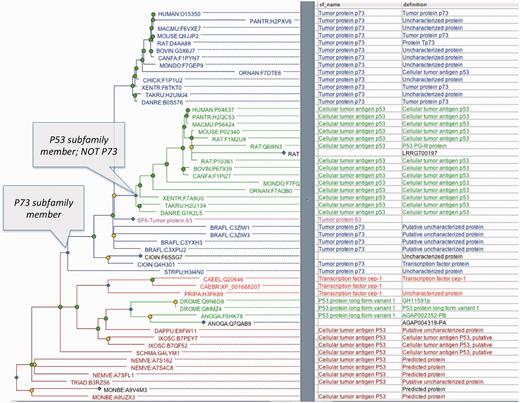
Example subfamily annotations, for P73 and P53 subfamilies (PTHR11447). The P73 subfamily (blue) includes descendants of the annotated P73 node, except for more recent subfamilies such as the P53 subfamily (green) and P63 subfamily (pink, collapsed SF8).
PANTHER employs this same model of evolutionary gain and loss of attributes, to annotations of gene function and protein class. For gene function, terms are taken from the GO to describe molecular function, cellular component and biological process. Note that each tree node annotation—an association between a GO term and a specific tree node—is considered to be independent of other annotations; thus, different terms can be propagated to different sets of descendants. Figure 5 shows an example for the mutS homolog family, in which the attribute of double-stranded DNA binding is inferred to have been present in the last common ancestor of the entire family, while involvement in crossover is inferred to have evolved in the common ancestors of the MSH4 and MSH5 clades but no other clades. For protein class, terms are taken from the PANTHER Protein Class ontology. Protein class derives from the PANTHER/X ontology (7) and represents common grouping terms for families and subfamilies. Because groups of protein families and subfamilies are often referred to by the functions common to most members, protein class terms overlap to some degree with GO molecular function terms, but in many cases are distinct. The ‘zinc finger transcription factor’ (PC00244) class, for example, combines both the function of most members of the group with a class of structural motifs based on zinc binding, and does not appear in the GO.
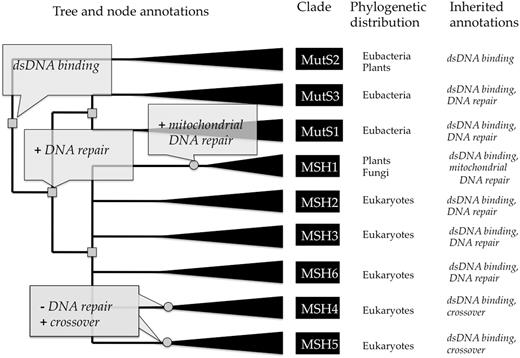
Example tree annotations of gene function, for the MutS homolog family (PTHR11361). The tree is annotated with functional ‘gains’ (indicated by plus) and ‘losses’ (indicated by minus). Inferred gene duplications are indicated by small gray squares, and annotated speciation events by small gray circles. Based on the distribution of experimental GO annotations from the literature for genes in model organisms (not shown here), the curator has inferred that the common ancestor of the family had the molecular function ‘double-stranded DNA binding’. Prior to the common ancestor of mutS (bacteria) and the mutS homologs (MSH’s in eukaryotes), one duplicate gained a function in ‘DNA repair’ (biological process). This function was preserved in most descendant homologs, but was lost prior to the radiation of MSH4 and MSH5. In the MSH1 lineage, a specific function in ‘mitochondrial DNA repair’ was gained (likely through the endosymbiotic origin of mitochondria). Extant sequences (leaves of the tree) are annotated by inheritance from the ancestral node annotations. Note that all ancestral annotations are inherited unless they are lost in a more recent ancestor, e.g. MSH4 and MSH5 do not inherit DNA repair even though they have an ancestor that likely participated in DNA repair. Full annotations for this family are available at http://www.pantree.org/tree/family.jsp?accession=PTHR11361.
Stable node identifiers for stable annotations across PANTHER releases
Note that trees are reconstructed with each version of PANTHER, to reflect gene structure annotation changes in each of the genomes (genes can be added or removed for each genome and protein sequences for a gene can be modified), as well as changes in the genomes that are included in the reference trees. Manual re-curation of annotated tree nodes would be impractical and inefficient, so PANTHER employs a computational algorithm to automatically ‘forward track’ the annotations from the previous version, onto the new version. Because annotations refer to specific nodes in the tree, PANTHER now assigns a stable node identifier to each node in the tree. Since PANTHER 7.0, every tree node is assigned a stable identifier with a nine-digit number proceeded by ‘PTN’ (for PANTHER Tree Node) (e.g. PTN000421099). From one version of PANTHER to the next, we attempt to preserve the PTN identifiers to keep them as stable as possible. To do this, after tree building for the new release, each node in the previous release is mapped to exactly one node in the new release (or else, if there is no mapping, the node identifier is obsoleted). Each leaf nodes corresponds to an extant gene (and corresponding protein sequence). Each extant gene in the previous release is mapped to a gene in the next release by first gene or protein identifiers, and then (if there is no match) protein sequence comparison. For PANTHER 8.0, if a gene has the same gene identifier as a gene in version 7.2, they are considered the same gene. For genes in version 7.2 that had no match by this criterion, the protein sequence is compared with all protein sequences in version 8.0 using Basic Local Alignment Search Tool (18). The PANTHER 8.0 gene is considered to be mapped to a version 7.2 gene if they are from the same organism, the percent identity is more than 95% and the length coverage is more than 95%.
Once the leaf node identifiers are mapped, this information is used along with the tree topologies to forward track internal node identifiers. First, internal nodes are characterized by (i) event type (speciation or duplication), (ii) common ancestral organism for the descendant genes (usually represented as a taxonomic clade) and (iii) a list of descendant leaf node identifiers. For each speciation node identifier (from the previous release), we generate the best ‘candidate mapping’ to the new release by finding the node that matches the event type and ancestral organism exactly, and maximizes the intersection of the sets of descendant leaf node identifiers in the previous and new releases. For each duplication node identifier, we generate the best candidate mapping by finding the node that meets three criteria: (i) matches the event type exactly, (ii) maximizes intersection of descendant leaf node identifiers and (iii) includes leaf nodes from at least two subtrees descending from the duplication node. The reason for the second criterion is the following: note that for duplication nodes we lack an ancestral organism constraint, so it is possible that a duplication node that is ancestral to a second duplication node will have identical leaf set intersections (as one is a subset of the other). In this case, we want to choose the most recent duplication that contains the same subset, so we take the one with the largest average fractional overlap of total leaf nodes, e.g. if the previous node has 100 leaf nodes, the new node has 120 leaf nodes and there are 90 nodes in the intersection, then the average is (90/100 + 90/120)/2 = 0.825. The third criterion requires that a duplication node match must include at least two of the same subtrees in common (PANTHER trees may contain polytomies) to ensure that the duplication represents the same paralogous gene relationships across versions.
Because subfamily names, GO terms and protein class terms are associated with stable node identifiers, forward tracking of the node identifiers automatically forward tracks these tree annotations. If, however, an annotated node identifier is obsoleted because it has no mapping to the new tree, these annotations are flagged for manual review and re-curation.
Quantitation of node stability
For the tree node annotations in PANTHER to remain stable between releases, the tree node identifiers must be stable. The recent update from PANTHER version 7 to version 8.0 was a particularly challenging test. Between these versions, the gene sets changed dramatically. First, the set of genomes nearly doubled, from 48 to 82. Second, even for the genomes in common, the set of gene predictions and sequences changed over the 3 years between these major releases. Third, the sources of the gene sets differed in most cases, with the gene sets for version 8.0 taken primarily from UniProt as described earlier, and version 7 taken from model organism databases whenever available, and otherwise from Ensembl (19) genome annotation or Entrez Gene (20). Finally, version 7 included many fragment sequences that were more likely than other sequences to have been incorrectly placed into the evolutionary tree. Even given these challenges, more than 82% of the leaf nodes, and more than 85% of the internal nodes, could be successfully mapped onto unique nodes in the new trees. Internal nodes appear to have greater stability than leaf nodes, which makes sense given that they can be identified on the basis of multiple, related genes. Importantly, however, tree instability tends to be concentrated locally: the complete gene sets for just a few organisms account for a disproportionate amount of node instability (Figure 6). We expect that these complete genomes and gene predictions will stabilize in subsequent versions, but if not they can be removed from the trees.
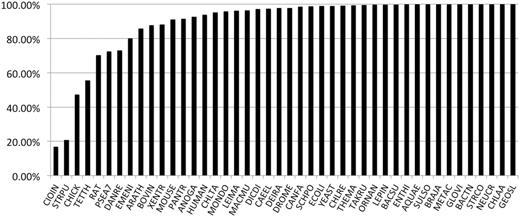
Percentage of protein-coding genes tracked forward from PANTHER 7 (2009) to PANTHER 8 (2012). Overall, the nodes are very stable, but the predicted gene sets for a few genomes have undergone extensive revision, notably Ciona intestinalis (sea squirt), Strongylocentrotus purpuratus (purple sea urchin), chicken and Tetrahymena.
PANTHER PATHWAYS
The current release of PANTHER Pathways includes 176 pathways, generated using the CellDesigner tool (21). Each pathway is represented as a diagram, and the PANTHER overrepresentation and enrichment analysis tools enable users to view their data overlaid on these diagrams. To support other pathway analysis and modeling tools, PANTHER Pathways can now be downloaded in three major pathway exchange formats: Systems Biology Market Language (SBML) (22), Systems Biology Graphical Notation (SBGN-ML) (23,24) and BioPAX (25). SBML is mainly used by the systems biology community for pathway network simulation and modeling tools. SBGN-ML captures the layout information and is used by any SBGN compliant tools for visual representation of the pathways. BioPAX captures detailed biochemical reaction information of the pathway, and is used by database developers and tools.
Annotation of pathway roles
PANTHER also includes annotations to pathway role (a ‘component’ within a pathway), but these have not yet been integrated into the evolutionary gain and loss formalism. Pathway roles have been assigned to individual extant sequences in PANTHER using a variety of GO evidence codes. The pathway role annotations were performed by expert curators, based on experimental evidence reported in the literature (26), and are focused on vertebrate pathways. In the absence of curated tree node annotations for pathway roles, PANTHER currently automatically infers shared roles for all subfamily members. This is equivalent to annotating a subfamily node with all of the roles that have been assigned by curators to at least one subfamily member. Because these automatic ancestral gene inferences are not yet manually reviewed, pathway role classifications may suffer from over- and under-prediction for non-vertebrate organisms.
Inclusion of new pathways
The current release of PANTHER contains the first unsolicited, user-curated pathway included in PANTHER: ‘Gonadotropin-releasing hormone receptor-mediated signaling pathway’ (P06664), curated by Hana Pincas at Mount Sinai School of Medicine, New York (27). For users wishing to upload pathways they have curated themselves, PANTHER can now publish user-generated pathways on the PANTHER website, making them available to all PANTHER users. Pathway ‘authors’ are credited on the pathway information pages on the website. The instructions for creating a valid pathway for publishing are available at the PANTHER Help page at http://www.pantherdb.org/help/PANTHERhelp.jsp. PANTHER accepts pathway diagrams from CellDesigner (21), and other information such as gene name and literature evidence can be put in any tabular format, including Excel. However, user-generated content is not expected to be the main source of additional pathway content on the PANTHER site. In future versions, PANTHER Pathway will also leverage other community pathway curation efforts to add more pathways to the database, so that the PANTHER statistical analysis and pathway visualization tools (see below) can be applied to a larger number of pathways. PANTHER Pathway supports BioPAX, and therefore is able to import pathways from any pathway resources that support this standard, such as WikiPathways (28), Reactome (29), Pathway Interaction Database (30) and BioCyc (31).
PANTHER WEBSITE
Recently, we have made two main improvements to the website. First, we have redesigned the homepage to simplify the most common user workflows (Figure 7). PANTHER offers a number of tools that allow users to use the PANTHER data to create or analyze gene lists, to classify an input protein sequence, or to predict the functional effect of a non-synonymous substitution (Table 1). The homepage now has tabs for each of the major workflows: Gene List Analysis, Browsing, Sequence Search (HMM search), cSNP (non-synonymous protein coding substitutions) Analysis and Advanced Search. The default tab provides access to various tools for supporting gene list analysis, as these are the most frequently used pages according to PANTHER usage statistics. The new homepage allows a user to directly type, paste or upload a list of genes or proteins, and choose from the menu of available PANTHER analysis tools. The user can now select the source genome(s) for the uploaded identifiers, to resolve ambiguity, for example, when gene symbols are used in the input list. For most of the tools, only gene identifiers are required. For the statistical enrichment test, however, the list must also include a numerical value associated with each gene. Numerical values can be of any origin; two common types are differential gene expression levels or P-values from a genome-wide association study. The enrichment tool is designed to work for genome-wide data, and users should upload values for as many genes as possible. In general, the page is designed to provide step-by-step instructions, with links to detailed help if necessary, to help users find and use the right tool for their application. The new home page consolidates a number of functionalities that were previously distributed across the PANTHER website, and retains a search box for simple text queries.
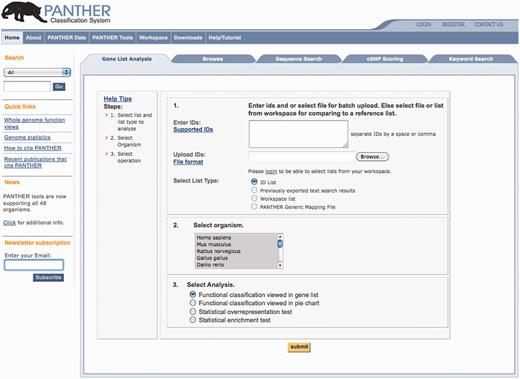
New PANTHER home page. The most common user workflows are organized by ‘folder tabs’ across the top. The Gene List Analysis tab is displayed by default, and users are guided on how to enter or upload a list of genes (optionally with numeric values included), and then launch one of four different functional analyses using the data in the PANTHER database (Table 1).
Data analysis workflows and tools supported on the PANTHER website
| Workflow | Tool | Description |
|---|---|---|
| Upload and analyze gene list | Annotated list view | Spreadsheet-like view with classifications for each gene; can be sorted and explored, or exported to a file |
| Pie or bar chart | Graphical view of classifications; allows drill down to gene subsets | |
| Overrepresentation test | Reports classes that are over- (or under-) represented in the gene list compared with a reference list; users can specify a reference list or use a precompiled one | |
| Enrichment test | Reports classes that have a non-random distribution of values; users must upload a file with name/ID and value for each gene, for as many genes as possible | |
| Graphical views of statistical analyses | Users can view data underlying statistical analyses as pie, bar or area charts (overrepresentation test) or distributions of uploaded values (enrichment test) | |
| Pathway visualization | Users can view uploaded data on pathways colored by gene presence/absence (after overrepresentation test) or by input values (after enrichment test) | |
| Create gene list (or list of families or pathway roles) | Text search (quicksearch or advanced search) | Searches can be filtered by text matches to particular data fields |
| Prowler (Browser) | Browsing and retrieval by family, GO or protein class term, pathway or species | |
| Classify input sequence | Sequence search | Compares input protein sequence to annotated HMM library and reports statistically significant matches |
| Predict deleterious coding substitutions | cSNP scoring | Reports probability that cSNP is deleterious, based on HMM profile at a specific site in the protein |
WEB SERVICES
The PANTHER website has expanded the list of available web services, for programmatic access to data and tools. The instructions for using these services are at pantherdb.org/webservices_description. One of the new services allows gene lists to be passed directly to the PANTHER analysis tools, so that users do not have to cut-and-paste or manually upload data from another website. This service is currently being used to pass genomics data (from gene expression or high-throughput phenotyping experiments in E. coli) directly to PANTHER tools from PortEco (porteco.org). Another web service, providing BioPAX, is currently being used to retrieve PANTHER Pathway data by the CellDesigner pathway editing tool (20), and by the Garuda Alliance, whose goal is to provide a coherent and comprehensive software, data and knowledge platform for systems biology and biomedical research (http://www.garuda-alliance.org/). Currently, two major classes of web services have been implemented for the Garuda Alliance. The first enables keyword searches and retrieval of genes, families, GO function terms, protein classes and pathways. The second is for performing overrepresentation tests for all organisms supported by the PANTHER database. Web services are also used to provide detailed information about PANTHER families and genes that are associated with the PANTHER pathway data. This service is used by the tool that generates BioPAX data. PANTHER web services are also used by the PanTree (pantree.org) website to provide detailed information about PANTHER trees, and tree nodes that have been annotated by the GO Consortium.
DATA AVAILABILITY
All PANTHER data are available for download at ftp://ftp.pantherdb.org.
CONCLUSIONS
The PANTHER database provides phylogenetic trees of protein coding genes, across 82 whole genomes. Each gene family tree is annotated with the evolutionary events that explain the tree topology, such as speciation and gene duplication. We derive orthologs from these annotated trees, and in the event of multiple orthologs we report all orthologs but also infer a least diverged (most nearly ‘equivalent’) ortholog.
PANTHER tree nodes are also annotated, by expert curators, with ‘heritable attributes’ that are used to infer annotations for protein-coding genes across the 82 genomes in PANTHER. These genes inherit annotations of subfamily membership, gene function (GO terms) and protein class. GO annotations are being added rapidly as part of the GO Consortium’s Reference Genome Project. All tree-based annotations are available on the PANTHER website (http://pantherdb.org), and inferred GO annotations are also available directly from the GO database (http://geneontology.org).
The PANTHER website includes numerous tools for interactive analysis of gene lists with respect to the subfamily, function and class annotations, and the newly redesigned homepage should help users to employ the tools in their research.
FUNDING
National Institutes of Health [NIH/NIGMS GM081084 to P.D.T.]. Funding for open access charge: University of Southern California.
Conflict of interest statement. None declared.
ACKNOWLEDGEMENTS
We thank John Casagrande for PANTHER database extensions and data loader enhancements in version 8.

Comments