


Abstract
During fetal development, the liver serves as the primary hematopoietic organ in which hematopoietic stem cells (HSC) comprise a large proportion of hepatic cell populations. Because HSC are capable of initiating long-term hematopoiesis, injury to these cells during pregnancy may play a role in the development of hematopoietic disorders manifested after birth. Of interest is the role of genetic injury to fetal HSC in the etiology of the infant acute leukemias, which are characterized by chromosomal rearrangements in the 11q23 region involving the mixed lineage leukemia ( MLL ) gene. These gene fusions also occur in leukemias in adults following chemotherapy with etoposide and other inhibitors of DNA topoisomerase II. We used etoposide as a model compound to determine the sensitivity of human fetal HSC to DNA damage and to determine whether we could induce MLL rearrangements in cultured human fetal HSC. Exposure of HSC to etoposide resulted in a dose-dependent loss of viability, with effects observed at low nanomolar concentrations. DNA strand breaks were observed on exposure to 140 nM etoposide, and higher etoposide concentrations stimulated an increase in early lymphoid populations and elicited G 2 /M cell cycle arrest. Immunophenotyping of MLL translocations revealed a significant increase in positive flow cytometry events at low etoposide concentrations and were consistent with MLL recombination. MLL translocations were confirmed using fluorescent in situ hybridization. In vitro inhibition of DNA topoisomerase II was observed at ≥25 µM etoposide, but was not evident at lower etoposide concentrations associated with DNA damage. Our data indicate that low acute doses of etoposide can cause DNA strand breaks and chromosomal rearrangements involving MLL in human fetal HSC. Ultimately, such injury may have ramifications with regards to transplacental exposures to environmental chemicals linked to the etiology of infant acute leukemias.
Introduction
During development, the fetal liver is the primary site of hematopoiesis in which a large proportion of cells comprise hematopoietic cells and their stem cell precursors. The pluripotency of the fetal liver is maintained by these hematopoietic stem cells (HSC), which can differentiate into multiple cell populations and eventually seed the bone marrow ( 1 ). Because the fetal liver receives a substantial proportion of maternal blood circulation, it can also serve as a target for a number of maternally transferred drugs and xenobiotics ( 2 , 3 ). Although there is little information available regarding the liver cell targets of transplacental agents during pregnancy, studies from our laboratory have shown that fetal liver HSC are extremely sensitive to the toxic effects of 4-hydroxynonenal (4-HNE) ( 4 ), a common mutagenic and cytotoxic α,β-unsaturated aldehyde generated from maternal alcohol consumption and to pro-oxidant drugs and environmental chemicals. Ultimately, alterations in hematopoiesis due to toxicological injury during development may have functional ramifications with regards to hematopoietic disorders that are manifested after birth ( 5 – 7 ).
Recent studies have provided evidence that maternal exposure to certain environmental chemicals may increase the risk of certain leukemias that develop soon after birth ( 8 – 11 ). A number of these cases are diagnosed within the first 12 months of life and are thus termed ‘infant acute leukemia’ or IAL ( 7 , 12 ). These disorders originate from lymphoid (acute lymphocytic leukemias, ALL) or myeloid (acute myelogenous leukemias, AML) cells and are characterized by a relatively poor prognosis, short latency period and the absence of a pre-leukogenic phase. The molecular basis for these diseases appears to involve chromosomal rearrangements of the ‘mixed lineage leukemia’ or myeloid/lymphoid leukemia ( MLL ) gene, a gene of ∼80 kb clustering in a 9 kb breakpoint cluster region on 11q23. Infants with ALL or AML usually have acquired MLL gene fusions as a major consistent genetic abnormality (>70% of cases) ( 13 , 14 ). Retrospective analysis of neonatal blood spots from Guthrie cards of children with leukemia indicate that these genetic lesions can be acquired in utero ( 15 – 17 ). The high concordance rate for leukemia in monozygotic twins of this age, and short latency suggests that MLL fusion in the appropriate human fetal HSC is sufficient to cause leukemia ( 18 ). Accordingly, the initiation of molecular injury to uncommitted hematopoietic precursor cell targets in the fetus may increase the risk of IAL in the offspring.
Many chemicals that induce illegitimate recombination of MLL gene are also inhibitors of DNA topoisomerase II (topo II), which functions in maintaining the fidelity of gene transcription, DNA replication and recombination by directing DNA unwinding and religation. Common topo II inhibitors include benzene metabolites, isoflavones, flavonoids, certain herbal medicines, pesticides and some cancer chemotherapeutics ( 9 ). Maternal dietary consumption of topo II inhibitors has been associated with increased risk to IAL in at least two case–control studies ( 8 , 10 ). Furthermore, cancer chemotherapeutics such as epipodophyllotoxins (and including etoposide) that target topo II have been associated with increased risk of treatment-related leukemias secondary to chemotherapy ( 7 , 19 ). As in IAL, a large proportion of the chemotherapy-related leukemias involve 11q23 chromosomal rearrangements. It has been postulated that the cell of origin of topo II inhibitor therapy induced AML and ALL with 11q23 rearrangement is an immature hematopoietic progenitor cell ( 20 ).
The current project was initiated to characterize the sensitivity of human fetal liver HSC to a model alkylating carcinogen and known inducer of MLL recombination in humans. Our hypothesis was that second trimester human fetal liver CD34 + progenitor cells would be extremely sensitive to etoposide-induced injury and would exhibit MLL -associated rearrangements on low levels of etoposide exposure that are consistent with exposure to a model topo II inhibitor during pregnancy. We further hypothesized that these low concentrations of etoposide would further alter differentiation pathways and cell cycle status of fetal liver HSC, cellular events that are mechanistically linked with the molecular etiology of hematopoietic disorders.
Materials and methods
Reagents
Second trimester human fetal liver derived cryopreserved CD34 + cells (>95% purity) from anonymous donors were purchased from Cambrex-BioWhittaker (Gaithersburg, MD) and all use of human fetal cells is approved by the University of Washington Institutional Review Board. Iscove's Modified Dulbecco's media (IMDM), RPMI-1640 media, penicillin, streptomycin and activated and heat-inactivated fetal bovine serum (FBS) were purchased from Invitrogen (Carlsbad, CA). Recombinant human interleukin 3 (IL-3), recombinant human granulocyte colony stimulating factor (G-CSF) and recombinant human stem cell factor (SCF) were obtained from Research Diagnostics (Flanders, NJ). The human acute monocytic leukemia MV4–11 cell line was purchased from the American Type Culture Collection (ATCC, Manassas, VA). Flow cytometry antibodies fluorescein isothiocyanate (FITC) labeled anti-human CD33, Phycoerythrin (PE) labeled anti-human CD38, and isotype controls: PE mouse IgG1, k and FITC mouse IgG1, k were purchased from BD Biosciences (Bedford, MA). MoAB 7.ING2 IgG1 monoclonal antibody PE-conjugated and mouse IgG1-PE isotype were purchased from Beckman Coulter (Fullerton, CA). Vented culture flasks were purchased from Corning, (Corning, NY). Hoechst dye and 4′,6-diamidino-2-phenylindole (DAPI) were purchased from Molecular Probes (Eugene, OR). The COMET kit was purchased from Trevigen, (Gaithersburg, MD) and the MLL locus-specific DNA probe was obtained from Vysis, (Downers Grove, IL). The DNA topoisomerase II assay kit was purchased from TopoGEN, (Columbus, OH). Trypan blue, dimethyl sulfoxide (DMSO), etoposide were purchased from Sigma Chemical (St Louis, MO) and Alamar blue was purchased from Bio-Source International (Camarillo, CA).
Cell culture and dose–response experiments
Human fetal liver derived cryopreserved CD34 + cells were thawed in accordance with the manufacturer's instructions and seeded at ∼6250 cells/ml of IMDM containing 15% FBS, 2 ng/ml IL-3, 1 ng/ml G-CSF, 20 ng/ml SCF, 100 U/ml penicillin and 100 µg/ml streptomycin. MV4–11 cells were thawed in accordance with the manufacturer's instructions and cultured in RPMI-1640 containing 10% FBS. Human fetal HSC were maintained in culture at 37°C in 95% O 2 /5% CO 2 over 14 days. This time frame allows for moderate increases in cell number while maintaining a relatively primitive and undifferentiated status ( 4 ). Specifically, by Day 7 of culture, ∼20% of these primitive cells retain the CD34 + cell surface marker, and these CD34 + progenitor cells along with primitive lymphoid and myeloid cells constituted the majority of HSC populations ( 4 ). Cell counts and enumeration of live and dead HSC were determined over the culture period (7–14 days) using a hemocytometer and trypan blue exclusion. On Day 7, cells were transferred to a 96-well microplate and exposed to 0.02, 0.14, 0.83 and 5 µM etoposide. Vehicle controls consisted of DMSO (0.1% v/v). The effects of etoposide on HSC viability were determined by addition of 10% alamar blue and fluorescent measurement of reduction at 554 ex/590 em using a 96-well fluorescence microplate reader ( 21 ).
Effects of etoposide on HSC differentiation and cell cycle
In order to determine if low concentrations of etoposide alter HSC differentiation pathways, fluorescent-labeled antibodies were employed to identify and monitor different hematopoietic lineages. Following 7 days in culture and prior to each flow experiment, cell counts and viability were determined. Cells were pooled to obtain similar seeding densities with equal volumes of the suspension culture and transferred to experimental flasks. Cells were exposed to a single acute dose of etoposide of 0.14, 0.5, 1 µM, or vehicle and then collected at 24, 72 h and 7 days post-exposure for flow cytometry analysis. A set of control reactions was conducted in parallel with the experimental treatments. The control reactions consisted of (i) unstained HSC, (ii) HSC incubated with the appropriate lineage antibody and (iii) monoclonal antibody isotypes that did not bind to HSC. Cells (1 × 10 6 ) were re-suspended in 1 ml of phosphate-buffered saline (PBS) containing 0.1% sodium azide, pH 7.4 and incubated on ice with the appropriate antibody for 30 min in the absence of light. The effect of etoposide on HSC cell cycle was performed using Hoechst stain ( 22 ). Prior to flow cytometry analysis, the cells were rinsed in 1× PBS, incubated with 0.5% paraformaldehyde solution, and the paraformaldehyde was replaced with PBS containing 0.1 mg/ml of Hoechst dye.
Alkaline single cell gel electrophoresis (COMET) assay
Etoposide-induced single and double strand breaks were assessed by alkaline unwinding and electrophoresis conditions using the CometAssayTM kit (Trevigen) as described previously ( 23 ). HSC suspensions (1 × 10 5 cells/ml) in low melting agarose were applied to a CometSlide™, dried, immersed in ice-cold lysis solution for 45 min in the dark and incubated in 12 mg/ml NaOH/1 mM EDTA. The slides were then immersed in TBE (tris base, boric acid and EDTA) buffer for 5 min and electrophoresed at 1 V/cm for 25 min. After electrophoresis, the slides were washed and dried prior to addition of 50 µl of SYBR green fluorescent dye and viewing by fluorescence microscopy. For each treatment group, the images of 50 non-overlapping cells were collected and the degree of COMET tailing was analyzed by NIH Image program, Image J ( http://rsb.info.nih.gov/ij/ ). Cell length was used as measure of the severity of DNA damage. The cells were scanned and quantitated and the mean cell length for each treatment group calculated from 50 measurements.
Detection of MLL-associated gene rearrangements
Screening for the presence of etoposide-induced MLL gene rearrangements was carried out using two methods. Flow cytometry was used to characterize the effective treatments on the percentage of cells exhibiting cross-reactivity to monoclonal antibody 7.1NG2 (MoAB 7.1NG2) as described previously ( 24 , 25 ). Monoclonal antibody 7.1NG2 recognizes the chondroitin sulfate proteoglycan molecule NG2, a cell surface marker associated with either a t (4;11)(q21;q23) or a t (11;19)(p13;q23) translocation and MLL gene rearrangement ( 24 , 25 ). For flow cytometry, ∼1 × 10 6 HSCs from each experimental condition were washed twice with ice-cold PBS supplemented with 0.1% BSA and labeled with 10 µg/ml PE-conjugated MoAB 7.1NG2 for 30 min at 4°C. The intensity of fluorescence was determined by flow cytometry at 488 ex/590 em. A total of 10 000 cells (events) were tested and cells were considered to be staining positive for 7.1NG2 expression if >25% of the cells exhibited a fluorescence intensity exceeding 95% of the cells stained with isotype-matched controls ( 26 ).
Because MoAB 7.1NG2 has not been widely employed in cell studies and does not detect all MLL rearrangements ( 26 ), we also used fluorescence in situ hybridization (FISH) and a dual color DNA probe (Vysis, Downers Groove, IL) to visually confirm MLL gene rearrangements and to verify the flow cytometry data. The dual color break-apart rearrangement probe labels the 350 kb centromeric portion of the MLL breakpoint cluster region with SpectrumGreen, and the 190 kb telomeric portion with SpectrumOrange. As a result, a normal cell with no MLL rearrangement yields two orange/green fusion signals. In contrast, in cells with MLL rearrangements, the two color signal will break apart and thus exhibit one orange/green fusion signal and distinct green and orange signals ( 27 ). A large deletion occurring distally from the MLL breakpoint can also eliminate one of the two orange signals (i.e. producing one orange/green fusion and one isolated green signal) reflecting a concomitant translocation and deletion (Vysis).
Control and etoposide-exposed HSC were rinsed with PBS and re-suspended in Carnoy's Fixative at a density of 50 000 cells/ml. An aliquot of HSC was loaded on slides and the slides were denatured, dehydrated and then hybridized with LSI- MLL probe as per the manufacturer's instruction. The slides were subsequently washed and counter-stained with DAPI ( 28 ) and imaged using a confocal fluorescence microscope. For each experimental group, a total of 50–100 cells with no evidence of apoptosis as indicated by DAPI staining were examined for the presence of MLL rearrangements as described above. A leukemic cell line MV4–11 was included as a positive control for MLL rearrangements in all FISH experiments.
In vitro topoisomerase II inhibition
The extent of inhibition of DNA topoisomerase II (DNA topo II) by etoposide was determined using a commercial kit (TopoGen) based upon the decatentation of kinetoplast DNA ( k DNA) and is specific for assessing the activity of eukaryotic topo II. In this assay, topo II, reaction buffer [10 mM Tris (pH 7.9), 50 mM NaCl, 50 mM MgCl 2 , 100 µM EDTA, 0.015 mg/ml BSA and 1 mM ATP] and k DNA were incubated in the presence of 0.025–250 µM etoposide (or DMSO control) for 15 min at 30°C. The reactions were then terminated and loaded directly onto a 1% agarose gel containing ethidium bromide (0.5 µg/ml) followed by electrophoresis. The gels were visualized by UV illumination and photographed. The degree of topo II inhibition was determined by densitometric scanning of the remaining k DNA in the gels using a BioRad Fluor-S imaging system.
Statistical analysis
All viability and cell proliferation data represent the mean ± SEM of three experiments with incubations for each experiment performed in triplicate. Flow cytometry data are from experiments conducted using triplicate incubations. The effects of etoposide on viability, proliferation and differentiation of HSC were assessed using two-way analysis of variance (ANOVA) followed by Tukey's post-hoc test (SigmaStat 3.0, Jandel Scientific, Chicago, IL). FISH data were analyzed using χ 2 analysis, whereas the effects of etoposide on DNA tailing as measured COMET data were analyzed by student's t -test. Treatment-related differences were considered significant at P ≤ 0.05.
Results
Effect of etoposide on HSC viability
As observed in Figure 1A , exposure to a single dose of etoposide over a range of 0.02–5 µM elicited a dose-dependent decrease in HSC viability at all time points. For example, etoposide exposures at 0.02, 0.14, 0.83 and 5 µM elicited 5, 35, 63 and 78% decreases in alamar blue reduction, respectively, at 3 days post-exposure ( Figure 1A ). Although the etoposide-treated cells continued to lose viability several days following acute etoposide exposure, the overall rate of loss of HSC viability plateaued by 5 days post-exposure. As observed in Figure 1B , the loss of viability following etoposide treatment followed a similar trend with etoposide-mediated cell death using trypan blue exclusion, with some exceptions. For example, the alamar blue assay detected a significant loss of viability in the 0.02 and 0.14 µM exposure groups that were not reflected by a significant decease in the number of live cells by trypan blue exclusion. Furthermore, acute exposure to relatively high concentrations of etoposide (0.83 and 5 µM) caused ongoing cell death throughout 8 days post-exposure but overall the percentage of live cells remained >60% ( Figure 1B ). In general, the extensive etoposide-mediated losses in cell viability were consistently greater than the percentage of dead cells enumerated by the trypan blue exclusion assay.
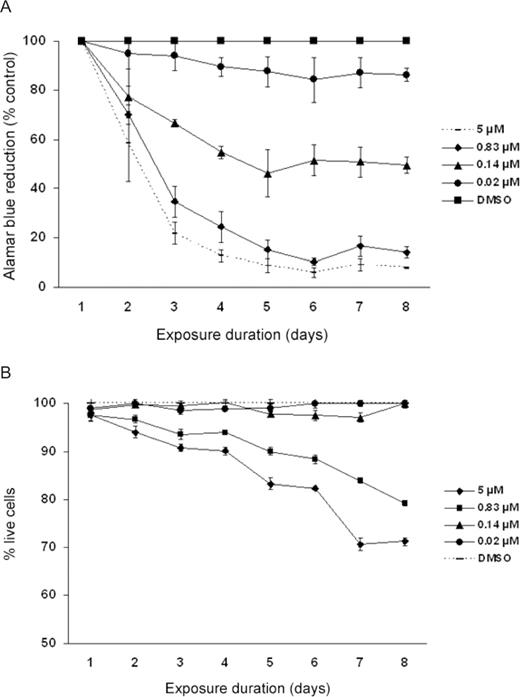
Effect of etoposide on ( A ) alamar blue reduction and ( B ) trypan blue exclusion in fetal HSC. In Figure 1A , all etoposide concentrations studied elicited a significant decrease in the viability in HSC by alamar blue reduction. In Figure 1B , etoposide concentrations at 0.83 and 5 µM elicited a significant decrease in the percentage of dead cells as compared with the corresponding controls at P ≤ 0.05. Data represent the mean ± SEM of three experiments.
Effect of etoposide on HSC differentiation and cell cycle
As discussed, human fetal liver HSC comprise mixed cell populations expressing different cell surface markers. As observed in Figure 2 , exposure to etoposide elicited early compositional changes in HSC as detected by surface cell markers specific to myeloid and lymphoid lineages. For example, 24 h following exposure to single doses of 0.14, 0.5 and 1 µM etoposide, the mean percentage of HSC occupying lymphoid populations (CD38) significantly increased by 10% in all treatment groups. However, by 72 h, the 0.14 and 0.5 µM etoposide groups did not significantly differ from controls, whereas the high dose 1 µM etoposide group still showed a significantly higher percentage of HSC occupying lymphoid lineages ( Figure 2 ). As reported previously, the percentage of early lymphoid cells in the control group decreased from 24 to 72 h post-exposure, consistent with differentiation of these primitive cells in culture ( 4 ). No effect of etoposide on compositional change of myeloid lineages was observed at any doses of etoposide employed in the present study (data not shown).
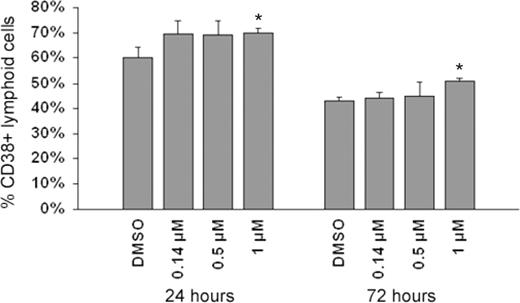
Effect of etoposide exposure on the percentage of HSC occupying lymphoid cell populations. As observed, exposure to 1 µM etoposide resulted in significant 7 and 9% increase in the percentage of HSC comprising lymphoid populations, at 24 and 72 h, respectively. Asterisks denote significant differences in lymphoid cell populations among etoposide-treated and control cells at P ≤ 0.05. Data represent mean ± SEM of three replicates of 10 000 flow cytometric events.
As observed in Tables I and II , exposure to etoposide elicited dose- and time-dependent disruptions of cell cycle homeostasis. Specifically, at 24 h post-exposure, the cells in DMSO control are typically in G 1 (61%) or S phase (39%) ( Table I ). The percentage of control cells in these cell cycle compartments did not significantly differ at 72 h (73% in G 1 and 27% in S phase, respectively, Table II ). In contrast, exposure to etoposide caused cell cycle arrest in the G 2 phase that was evident at 24 h post-exposure and at all three concentrations tested ( Table I ). These effects were paralleled by a loss of cells in G 1 ( Table I ). By 72 h, the percentage of cells occupying G 2 in the etoposide-exposed groups was still significantly elevated compared with controls ( Table II ). However, the effects were not as marked as those observed at earlier time points, suggesting a trend toward homeostasis. For the highest dose of etoposide tested (1 µM), the increase of percentage of cells in G 2 at 24 h post-exposure was accompanied by increase in the percentage of cells in the S phase ( Table I ), with a partial recovery observed by 72 h ( Table II ).
Effect of etoposide on HSC cell cycle homeostasis at 24 h post-exposure
| Treatment | G 1 (%) | S (%) | G 2 (%) | Total (%) |
|---|---|---|---|---|
| DMSO | 61 | 39 | 0 | 100 |
| Etoposide (0.14 µM) | 45 * | 39 | 16 * | 100 |
| Etoposide (0.5 µM) | 14 * | 37 | 49 * | 100 |
| Etoposide (1 µM) | 12 * | 51 * | 37 * | 100 |
| Treatment | G 1 (%) | S (%) | G 2 (%) | Total (%) |
|---|---|---|---|---|
| DMSO | 61 | 39 | 0 | 100 |
| Etoposide (0.14 µM) | 45 * | 39 | 16 * | 100 |
| Etoposide (0.5 µM) | 14 * | 37 | 49 * | 100 |
| Etoposide (1 µM) | 12 * | 51 * | 37 * | 100 |
Indicates significantly different than corresponding controls at P ≤ 0.01.
Effect of etoposide on HSC cell cycle homeostasis at 72 h post-exposure
| Treatment | G 1 (%) | S (%) | G 2 (%) | Total (%) |
|---|---|---|---|---|
| DMSO | 73 | 27 | 0 | 100 |
| Etoposide (0.14 µM) | 75 | 24 | 1 | 100 |
| Etoposide (0.5 µM) | 56 * | 23 * | 21 * | 100 |
| Etoposide (1 µM) | 28 * | 37 * | 35 * | 100 |
| Treatment | G 1 (%) | S (%) | G 2 (%) | Total (%) |
|---|---|---|---|---|
| DMSO | 73 | 27 | 0 | 100 |
| Etoposide (0.14 µM) | 75 | 24 | 1 | 100 |
| Etoposide (0.5 µM) | 56 * | 23 * | 21 * | 100 |
| Etoposide (1 µM) | 28 * | 37 * | 35 * | 100 |
Indicates significantly different than corresponding controls at P ≤ 0.01.
Effects of etoposide on DNA damage and MLL rearrangements
As observed in Figure 3 , HSC exposed to 0.5 µM etoposide exhibited a significant 63% increase in DNA tailing 24 h after exposure as compared with controls. No detectable DNA damage was observed on exposure to a lower concentration of 0.14 µM etoposide, suggesting a threshold of etoposide-induced DNA strand breaks between 0.14 and 0.5 µM.
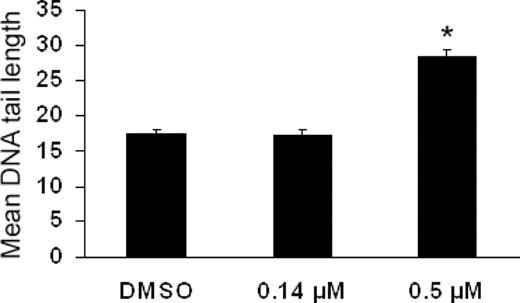
Effects of etoposide on single strand DNA breaks as detected by the alkaline single cell gel electrophoresis (COMET) assay. As observed, 72 h following exposure to 0.5 µM etoposide caused a significant increase in mean COMET tail length in HSC. No significant differences were observed at 0.14 µM. Asterisks denote those data points which were significantly different among etoposide-treated and control cells at P ≤ 0.05. Data represent 50 individual cells/treatment.
As observed in Figure 4 , exposure to 0.14 µM etoposide elicited a detectable 1% increase in MoAB 7.1NG2 labeling relative to control cells. The increased MoAB 7.1NG2 labeling was statistically significant and consistent 7 days post-exposure ( Figure 4 ). As observed in Figure 4 , exposure to a higher dose of 0.5 µM etoposide caused a more pronounced and sustained increase in the MoAB 7.1NG2 expression, resulting in a 14% increase in 7.1NG2 labeling at 7 days post-exposure. No MLL translocations were detected in HSC via 7.1NG2 labeling in control cells, or in those cells exposed to a low dose of 0.02 µM etoposide (data not shown).
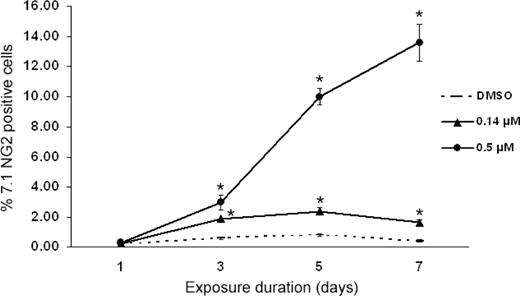
Effect of etoposide on MoAB 7.1NG2 labeling by flow cytometry. Exposure to etoposide resulted in a significant increase in 7.1NG2-positive HSC at 0.14 and 0.5 µM. Asterisks denote those data points which are significantly different among etoposide-treated and control cells at P ≤ 0.05. Data represent mean ± SEM of three replicates of 10 000 flow cytometric events.
The presence of MLL rearrangements induced by etoposide treatment as evidenced by increased 7.1NG 2 labeling was confirmed in a subset of HSC using FISH. The HSC exposed to 0.14, 0.5 and 1 µM etoposide were collected at 24, 72 h and 7 days post-exposure. As shown in Figure 5 , control cells subjected to FISH showed normal MLL structure as indicated by the presence of two fusion signals ( Figure 5A ). In contrast, exposure to 0.5 and 1 µM etoposide caused MLL rearrangements as evidenced by separation of the MLL cDNA probe, yielding distinct green and orange signals ( Figure 5B ). In some cases, one orange/green fusion and one isolated green signal were observed, reflecting concomitant occurrence of an MLL translocation and deletion ( Figure 5C ). In contrast to the data observed for the 7.1NG2 labeling, exposure to 0.14 µM etoposide did not elicit detectable MLL rearrangements as assayed by FISH. A positive control for the presence of MLL translocations (MV4–11 leukemia cell line) is presented in Figure 5D .
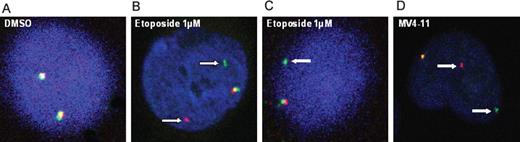
MLL rearrangements as evidenced by FISH. HSC were exposed to etoposide or DMSO (0.1% v/v). In control cells ( A ), green and orange signals are either adjacent to each other or overlapping, representing normal chromosomal structure. In ( B ), white arrows demonstrate a split signal in which green and orange probes are separated representing MLL translocations. ( C) A pattern of MLL rearrangements with one fusion signal and one isolated green signal reflecting a concomitant translocation and deletion. In ( D ), the MV4–11 leukemia cell line serves as a positive control for the presence of MLL translocations.
A comparative analysis of MLL rearrangements by flow cytometry and FISH was conducted for the 0.5 and 1 µM etoposide exposure groups and is presented in Tables III and IV . In the 0.5 µM etoposide treatment group, the number of MLL -rearranged cells scored by FISH was somewhat less than the predicted based upon the flow cytometry data. For example, the 3% increase in 7.1NG2-positive fetal HSC observed 72 h following 0.5 µM etoposide exposure would predict that 1–2 of 50 cells scored by FISH would test positive for MLL rearrangements. However, we could not confirm an MLL -rearranged HSC in 50 cells scored ( Table III ). In addition, based on the flow cytometry data, we would have expected that 7 of the 50 fetal HSC score positive for the presence of MLL rearrangements 7 days following 0.5 µM etoposide exposure. However, only 2 of the 50 HSC in this group scored positive for MLL rearrangements by FISH ( Table III ). In contrast, the number of MLL -rearranged cells in the 1 µM etoposide exposure group by FISH was consistent with the predicted number based on the flow cytometry data at 24 and 72 h post-exposure ( Table IV ). At 7 days post-exposure, the cytotoxic effects of etoposide precluded the collection of enough cells for flow cytometry analysis. However, analysis by FISH at this time point indicated that 13 of the 100 cells scored positive for MLL rearrangements.
Comparative analysis of MLL rearrangements by MoAB 7.1NG2 immunophenotyping and FISH in HSC exposed to 0.5 µM etoposide
| Treatment | Duration of exposure | Percentage of NG2 positive cells | Predicted number of MLL- rearranged based upon 7.1 NG2 labeling | Observed number of MLL- rearranged cells by FISH |
|---|---|---|---|---|
| DMSO (0.1% v/v) | 24 h | <1 | <1/50 | 0/50 |
| 72 h | <1 | <1/50 | 0/50 | |
| 7 days | <1 | <1/50 | 0/50 | |
| Etoposide (0.5 µM) | 24 h | <1 | <1/50 | 0/50 |
| 72 h | 3 | 1.5/50 (3%) | 0/50 | |
| 7 days | 14 | 7/50 (14%) | 2/50 (4%) |
Comparative analysis of MLL rearrangements by MoAB 7.1NG2 immunophenotyping and FISH in HSC exposed to 1 µM etoposide
| Treatment | Duration of exposure | Percentage of 7.1NG2 positive cells | Predicted number of MLL- rearranged based upon 7.1 NG2 labeling | Observed number of MLL- rearranged cells by FISH |
|---|---|---|---|---|
| DMSO (0.1% v/v) | 24 h | <1 | <1/100 | 0/100 |
| 72 h | <1 | <1/100 | 0/100 | |
| 7 days | <1 | <1/100 | 0/100 | |
| Etoposide (1 µM) | 24 h | 3 | 3/100 (3%) | 3/100 (3%) |
| 72 h | 8 | 8/100 (8%) | 6/100 (6%) | |
| 7 days | ND a | ND a | 13/100 (13%) |
ND, not determined. Seven days following exposure to 1 µM etoposide elicited a severe loss in cell number and negating flow cytometry analysis.
Effect of etoposide on in vitro topoisomerase II inhibition
As observed in Table V , incubation of kDNA with etoposide in vitro resulted in a dose-dependent loss of non-decatinated k DNA, reflecting inhibition of topo II. Although etoposide concentrations in 25 nM–2 µM range appeared to slightly inhibit DNA topo II, these effects were not statistically significant ( Table V ). In contrast, incubation of DNA topo II with concentrations of 25 and 250 µM etoposide concentrations elicited significant 25 and 50% decreases in topo II activity, respectively.
In vitro inhibition of DNA topoisomerase II by etoposide
| Concentration | 0 µM | 0.025 µM | 0.25 µM | 2.5 µM | 25 µM | 250 µM |
|---|---|---|---|---|---|---|
| Percentage of topo II inhibition | 100 | 89 (2) | 90 (5) | 92 (4) | 75 (9) * | 50 (4) * |
| Concentration | 0 µM | 0.025 µM | 0.25 µM | 2.5 µM | 25 µM | 250 µM |
|---|---|---|---|---|---|---|
| Percentage of topo II inhibition | 100 | 89 (2) | 90 (5) | 92 (4) | 75 (9) * | 50 (4) * |
All data presented as percentage of control of non-decatinated k DNA remaining after 15 min incubation in the presence of eukaryotic topoisomerase II and test compound.
Indicates significantly lower values than observed for corresponding controls at P ≤ 0.05 using two-way ANOVA.
Discussion
In the current study, we have tested the hypothesis that human fetal HSC are extremely sensitive to DNA strand breaks and MLL rearrangements on exposure to a model alkylating agent. The test agent selected, etoposide, has been demonstrated to cause genetic injury in blood cells following chemotherapy that is similar to those observed in MLL+ cases of IAL. Our experimental model comprising human fetal HSC is an appropriate system to study the in utero origins of hematopoietic disorders ( 4 ) and is more physiologically relevant than in vitro studies using transformed or adherent cell cultures. Human CD34 + HSC derived from bone marrow ( 29 ), peripheral blood ( 30 ) and umbilical cord blood ( 31 ) have previously been used as models to study the mechanisms underlying hematopoietic disease. However, caution should be exercised when making comparisons between experiments of CD34 + cells from different tissue sources due to differences in cellular biochemistry and physiology ( 32 – 34 ). The distinct physiological nature of CD34 + human fetal HSC coupled with the unique in utero hepatic microenvironment support the use of human fetal liver derived cells in studies of diseases with origins during pregnancy.
When assessing the effects of chemical exposure using cells of relevance to the in utero environment, it is also important to use low physiological concentrations associated with transplacental exposure. In general, drug concentrations in the low micromolar range are relevant with regards to tissue and blood levels from in vivo exposures. Plasma etoposide concentrations are typically 1.7 µM and higher in adults during chemotherapy ( 35 ). In contrast, little is known regarding in utero levels of transplacental agents in humans during pregnancy, but it is reasonable to assume that such concentrations are more likely to be in the nanomolar range, and possibly below. The fact that we observed nanomolar etoposide concentrations causing a loss of viability of human fetal liver HSC is particularly noteworthy, and raises the possibility that low doses of other DNA damaging agents may impair the pluripotent capacity of HSC. In this regard, we are currently testing other environmental chemicals of relevance to exposures during pregnancy using this system.
The ability of etoposide to induce DNA strand breaks in cells as detected by COMET assay have been observed by other investigators ( 36 , 37 ), but the sensitivity of etoposide-induced DNA injury to human fetal liver HSC appears to exceed that of other cell types. For example, human osteoblast-like cells ( 38 ) show a loss of viability when exposed to doses of 100 µM etoposide and higher, but not at lower concentrations. In contrast, etoposide is toxic and induces apoptosis in human mesenchymal stem cells at 10 µM, and these cells appear to be much more sensitive to etoposide toxicity relative to other cell types such as peripheral blood mononuclear cells ( 39 ). The relative sensitivity of HSC to etoposide-induced toxicity and DNA injury may be a result of a poor detoxification ability of these primitive cells coupled with relatively lower DNA repair capabilities (unpublished data). Our observations of a comparatively high sensitivity of HSC to 4-HNE ( 4 ) is supportive of the sensitive nature of the cells to reactive agents.
As previously stated, HSCs have the potential to differentiate into multiple terminal cell types, including those of erythroid, myeloid and lymphoid lineages. The growth factors used in the present study were selected to preferentially maintain myeloid and lymphoid lineages, which are the relevant lineages in the etiology of childhood infant acute leukemias. Under the conditions of our study, we observed that exposure to low doses of etoposide elicited subtle effects on the differentiation of cultured CD34 + cells. The increase in the percentage of lymphoid cells may have been a result of a shift in T cell, B cell or Natural Killer cell populations. Although we did not investigate the origin of this shift in HSC populations, it is also possible that a transformation event in conjunction with increased proliferation in lymphoid lineages occurred, or that a stimulation of an early lymphoid progenitor stage occurred. We are employing cell-specific surface markers and magnetic bead-based isolation procedures to elucidate if certain HSC lineages are particularly sensitive to etoposide exposure.
The fact that ∼50 different chromosomal translocations of the human MLL gene are currently known and associated with high-risk acute leukemia ( 40 ) can render characterization of MLL fusion alleles a demanding task. The 7.1NG2 monoclonal antibody used in the present study recognizes the human homolog of the rat NG2 chondroitin sulfate proteoglycan molecule, which undergoes increased expression in the presence of MLL gene fusions. MoAB 7.1NG2 is highly effective at detecting clinically significant MLL -rearranged ALL cases with balanced 11q23 translocations involving 4 q 21 and 19 p 13 ( 24 ). However, the expression of NG2 may be dependent upon the particular gene(s) paired with MLL when it is rearranged, and some patients with unbalanced 11q23 abnormalities (deletions or inversions) can be NG2 negative ( 26 ).
Our data support the use of the MoAB 7.1NG2 antibody in the screening for MLL translocations in human fetal liver CD34 + stem cells, especially in conjunction with FISH. The use of FISH and a dual color MLL detecting probe spanning 11q23 has been previously reported ( 27 , 28 , 41 ), and FISH is routinely performed in diagnostic cytogenetics as a rapid and inexpensive alternative to Southern blotting analysis ( 41 ). In this regard, our data generated from 7.1NG2 phenotyping and FISH assays were highly consistent at 1 µM etoposide concentrations. However, the relatively minor, albeit 1% significant increase in the percentage of 7.1NG2 + cells at etoposide concentrations as low as 0.14 µM was not evident by FISH, and the flow cytometry data in the 0.5 µM etoposide group sometimes yielded a higher level of MLL rearrangements than were observed by FISH. These discrepancies may have been a result of the variation associated with the gating of 7.1NG2 labeled cells by flow cytometry, or simply due to the fact that the 7.1 NG2 data were based on 10 000 events, as opposed to the 50–100 cells that were scored by FISH. In addition, we were conservative in our diagnosis of MLL rearrangements by FISH in that we scored positive only those cells exhibiting a clearly distinct separation of the green and orange fluorescent signals. Alternatively, it is possible that the increased expression of cell surface NG2-reactive marker could have temporally preceded the formation of MLL rearrangements. The aforementioned hypothesis has been reported by others ( 42 ) and is further supportive of our approach that characterization of MLL rearrangements should not be made based solely by one method ( 42 ).
Recently, another group reported on the ability of etoposide to induce MLL rearrangements in hematopoietic progenitor cells. In that recent study, Libura et al . ( 43 ) determined that exposure to human umbilical cord blood derived CD34 + cells to comparably high, but clinically relevant concentrations of etoposide (20 and 50 µM), resulted in the formation of MLL rearrangements. More importantly, the illegitimate DNA repair events, including MLL tandem duplication, deletions, insertions and translocations, persisted 10–14 days following etoposide exposure. Accordingly, it appears that etoposide initiated rearrangements in umbilical cord CD34 + cells include translocations in some cells that proliferate. Such observations provide a mechanistic basis for the relatively high incidence of MLL -associated leukemias in adult secondary to chemotherapy with etoposide. Although the majority of our fetal HSC exposed to 1 µM etoposide were eliminated through apoptosis, our observation of MLL rearrangements in surviving cells at 7 days post-exposure suggests that etoposide-induced MLL translocations persisted in a subset of cells. As discussed, we observed 13% of fetal HSC exhibited MLL rearrangements by FISH at 7 days following initial exposure to 1 µM etoposide, as compared with 7% of the umbilical cord-derived CD34 cells following exposure to 20 µM etoposide at the same time point. The somewhat higher sensitivity of our fetal liver HSC as compared with the umbilical cord-derived CD34 cells may have been a result of a greater sensitivity of fetal liver CD34 HSC to alkylating agents, or simply from the fact that we did not remove etoposide from the media.
As discussed, the occurrence of MLL rearrangements is strongly associated with chemicals that cause inhibition of DNA topoisomerases I and II. These enzymes catalyze the passage of individual DNA strands (Type I) or double helices (Type II) to one another, which is manifested in the interconversion between topological isomers of DNA. In particular, relaxation of DNA supercoils by topo II is considered crucial to its role in DNA replication and transcription, as well as chromosomal condensation and separation during mitosis ( 44 , 45 ). However, little information exists regarding the relationship among the degree of chemical-induced DNA topo II inhibition in vitro with the potency for eliciting MLL rearrangements in cells. We observed significant in vitro topo II inhibition only at relatively high etoposide concentrations >25 µM, but only relatively minor inhibition at doses in the low micromolar range associated with DNA damage to HSC. Such observations are consistent with those of Park et al . ( 46 ) who used concentrations of etoposide of 100 and 200 µM as positive controls to inhibit topo II in their study involving several anti-tumor compounds and using similar assay conditions. Although we did not investigate the effect of etoposide on HSC topo II activity in cultured HSC, it is reasonable to assume that etoposide uptake into cells during cell culture may result in markedly different concentrations of chemical presented to the enzyme than those encountered using in vitro assays.
In summary, our results and those of our previous studies indicate that human fetal liver HSC may be extremely sensitive to chemical injury. By using etoposide as a model compound, we have demonstrated the rapid onset of DNA strand breaks and MLL gene rearrangements in cultured HSC at relatively low concentrations. This raises the intriguing possibility that human fetal liver HSC may be sensitive to other topo II poisons in utero. We are currently investigating the ability of human fetal liver HSC to repair translocations originating within the MLL hotspot and are examining compounds of relevance to exposures during pregnancy that are implicated in the etiology of IAL. Of particular interest are chemicals such as certain polyaromatic hydrocarbons that have been linked to chromosomal aberrations in cord blood ( 47 ), as well as certain pesticides, soy products and quinones that exhibit topo II inhibiting capabilities ( 8 ). Our HSC model system will be used in conjunction with molecular and biochemical approaches to screen and identify potential chemicals that elicit similar injury to HSC and that may potentially pose increased risk as a result of exposures during pregnancy.
These authors contributed equally to this work.
The technical assistance of Dr Terrance Kavanagh and Mr Collin White is greatly appreciated. This work was supported in part by grants from NIH (R01-ES09427, P30-ES07033), the US EPA STAR program (R-827441), the National Oceanic and Atmospheric Administration Coastal Ocean Program (NA05NS4781253) and the University of Washington Royalty Research Fund.
Conflict of Interest Statement : None declared.
References
Morrison,S.J., Uchida,N. and Weissman,I.L. (
Hakkola,J., Pelkonen,O., Pasanen,M. and Raunio,H. (
Sancewicz-Pach,K., Groszek,B., Pach,D. and Klys,M. (
Moneypenny,C.G. and Gallagher,E.P. (
Tavassoli,M. (
Infante-Rivard,C., Labuda,D., Krajinovic,M. and Sinnett,D. (
Woodruff,T.J., Axelrad,D.A., Kyle,A.D., Nweke,O., Miller,G.G. and Hurley,B.J. (
Alexander,F.E., Patheal,S.L., Biondi,A. et al . (
Borkhardt,A., Wilda,M., Fuchs,U., Gortner,L. and Reiss,I. (
Ma,X., Buffler,P.A., Gunier,R.B., Dahl,G., Smith,M.T., Reinier,K. and Reynolds,P. (
Thirman,M.J., Gill,H.J., Burnett,R.C. et al . (
Kaneko,Y., Shikano,T., Maseki,N., Sakurai,M., Takeda,T., Hiyoshi,Y., Mimaya,J. and Fujimoto,T. (
Yagi,T., Hibi,S., Tabata,Y. et al . (
Hjalgrim,L.L., Madsen,H.O., Melbye,M. et al . (
Armstrong,S.A., Golub,T.R. and Korsmeyer,S.J. (
Gale,K.B., Ford,A.M., Repp,R., Borkhardt,A., Keller,C., Eden,O.B. and Greaves,M.F. (
Blanco,J.G., Dervieux,T., Edick,M.J., Mehta,P.K., Rubnitz,J.E., Shurtleff,S., Raimondi,S.C., Behm,F.G., Pui,C.H. and Relling,M.V. (
Zhang,Y., Poetsch,M., Weber-Matthiesen,K. et al . (
Ahmed,S.A., Gogal,R.M.,Jr and Walsh,J.E. (
Blood,A., Edwards,C.J., Ishii,H.H., Pat,B.K., Bryson,G., Sculley,T.B. and Gobe,G.C. (
Jackman,S.M., Grant,G.M., Kolanko,C.J., Stenger,D.A. and Nath,J. (
Behm,F.G., Smith,F.O., Raimondi,S.C., Pui,C.H. and Bernstein,I.D. (
Smith,F.O., Rauch,C., Williams,D.E. et al . (
Hilden,J.M., Smith,F.O., Frestedt,J.L. et al . (
Yamamoto,K., Hato,A., Minagawa,K., Yakushijin,K., Urahama,N., Gomyo,H., Sada,A., Okamura,A., Ito,M. and Matsui,T. (
Dube,S., Fetni,R., Hazourli,S., Champagne,M. and Lemieux,N. (
Muench,M.O., Firpo,M.T. and Moore,M.A. (
Martinez-Jaramillo,G., Flores-Guzman,P., Montesinos,J.J., Quintana,S., Bautista,J., Sanchez-Valle,E., de Jesus Nambo,M. and Mayani,H. (
Gardner,J.L., Doi,A.M., Pham,R.T., Huisden,C.M. and Gallagher,E.P. (
Lu,S.J., Li,F., Vida,L. and Honig,G.R. (
Ng,Y.Y., van Kessel,B., Lokhorst,H.M., Baert,M.R., van den Burg,C.M., Bloem,A.C. and Staal,F.J. (
Shojaei,F., Gallacher,L. and Bhatia,M. (
Edick,M.J., Gajjar,A., Mahmoud,H.H. et al . (
Godard,T., Deslandes,E., Sichel,F., Poul,J.M. and Gauduchon,P. (
Chandna,S. (
Davies,J.H., Evans,B.A., Jenney,M.E. and Gregory,J.W. (
Li,J., Law,H.K., Lau,Y.L. and Chan,G.C. (
Meyer,C., Schneider,B., Reichel,M. et al . (
Cuthbert,G., Thompson,K., Breese,G., McCullough,S. and Bown,N. (
Metzler,M., Strissel,P.L., Strick,R. et al . (
Libura,J., Slater,D.J., Felix,C.A. and Richardson,C. (
Aplan,P.D., Chervinsky,D.S., Stanulla,M. and Burhans,W.C. (
Ishii,E., Eguchi,M., Eguchi-Ishimae,M., Yoshida,N., Oda,M., Zaitsu,M., Fujita,I., Miyazaki,S., Hamasaki,Y. and Mizutani,S. (
Park,J., Ahn,Y.C., Kim,H. et al . (
Author notes
1Department of Environmental and Occupational Health Sciences, University of Washington, Seattle, WA 98105, USA and 2Department of Physiological Sciences, University of Florida, Gainesville, FL 32611, USA
