

Abstract
Background: Genes that fuse to cause cancer have been studied to determine molecular bases for proliferation, to develop diagnostic tools, and as targets for drugs. To facilitate identification of additional, cancer fusion genes, following observation of a chromosomal translocation, we have characterized the genomic features of the fusion gene partners. Previous work indicated that cancer fusion gene partners, are either large or evolutionarily conserved in comparison to the neighboring genes in the region of a chromosomal translocation. These results raised the question of whether large cancer fusion gene partners were also evolutionarily conserved. Methods and Results: We developed two methods for quantifying evolutionary conservation values, allowing the conclusion that both large and small cancer fusion gene partners are more evolutionarily conserved than their neighbors. Additionally, we determined that cancer fusion gene partners have more 3’ untranslated region secondary structures than do their neighbors. Conclusion: Coupled with previous algorithms, with or without transcriptome approaches, we expect these results to assist in the rapid and efficient use of chromosomal translocations to identify cancer fusion genes. The above parameters for any gene of interest can be accessed at www.cancerfusiongenes.com.
- Cancer fusion genes
- chromosomal translocations
- transcriptome
- genomics
- cancer
- evolutionary concervation of genes
- bioinformatics
- UCSC genome browser assembly
Changes in chromosome number and structure are often associated with cancer. Chromosomal translocations have been studied intensively due to resultant fused coding regions that could express an abnormal, fused protein that stimulates cancer development (1, 2). Fusion proteins have been observed in many different types of cancers, for example the fusion of NPM and ALK in anaplastic large-cell lymphoma (3); ABL and BCR in chronic myelogenous leukemia (CML) (4, 5); and C-MYC and IgH in Burkitt’s lymphoma in (6), among many others. The detection and understanding of the ABL-BCR fusion protein, which stimulates unregulated cell division and leads to leukemia, led to the development of Gleevec, a drug able to block the ATP-binding site of the tyrosine kinase domain of ABL-BCR, halting CML (7). This extraordinary success has led to the hope of designing drugs targeted against other cancer fusion proteins.
There are about 50,000 unstudied translocations, raising the question of whether that information can continue to be used to facilitate the identification of fusion genes. It is possible that transcriptome sequencing and application of related algorithms will make translocation information obsolete (8). However, in the near term, transcriptome sequencing and the required analyses will not likely be accessible to all pathologists, particularly in economically challenging regions. Thus, we recently undertook a genomic study of cancer fusion gene partners for known chromosomal translocations, to determine whether the fusion gene partners had characteristics that set them apart from neighboring genes (9). This approach holds the promise of taking advantage of chromosomal translocation data to identify cancer fusion genes in an efficient manner. In the first study of this type, we determined that fusion gene partners are either large or evolutionarily conserved, in comparison to neighboring genes within a one million base pair region on either side of the fusion gene partner (9). This represented a two million base pair window that represents the lower limit of resolution for mapping the position of a chromosomal translocation.
In this project, we developed two novel, bioinformatic methods for the assessment of the evolutionary conservation of whole genes, based on conservation scores for intermittent genome segments available from the human genome project. Application of these methods allowed us to conclude that the large fusion gene partners are also evolutionarily conserved compared to their neighbors. We also noticed that cancer fusion genes have unusually large 3’ untranslated regions (UTs). While this is not an independent parameter that characterizes fusion gene partners – it is linked to gene size – we determined that the 3’UTs of cancer fusion gene partners have indications of greater secondary structure than their neighboring genes, possibly reflecting their more detailed regulatory processes.
List of small fusion gene partners used as a test set for ETEC Methods-1 and -2.
Methods
Overview. The data used to analyze each gene were acquired from the publicly available Human Genome Browser Gateway located at http://genome.ucsc.edu. The genome browser provides an interface that allows genes to be located easily from a database. The retrieved data was then processed using Microsoft Excel.
Initial step for acquiring the genomics data of cancer fusion gene partners and their neighbors. In the Genome Browser Gateway the position of a fusion gene partner is located by entering the gene symbol in the “gene” text field. The gene is compared with its neighboring genes located within 2 million base pairs by subtracting 1 million from the start position and adding 1 million to the end position.
Method of distinguishing small genes. The following methods detail the process of downloading, tabulating, and ranking the sizes of genes to classify a fusion gene partner as, “small”. In sum, a small fusion gene partner is defined as small if it is below the top 5 genes in size, compared with all neighboring genes within one million base pairs on either side of the fusion gene. Downloading files representing a 2 million base pair region with a cancer fusion gene partner: On the UCSC Genome Browser Assembly the UCSC Genes under Genes and Gene Prediction Tracks is set to full while all other fields are hidden. The sizes of the genes in the region are acquired from a file retrieved from Tables at the top navigation menu. The following settings are used to generate this file: Genes and Gene Prediction Tracks (for the group field); UCSC Genes (for the track field); knownGene (for the table field); position (for the region field); selected fields from primary and related tables (for the output format); and “genesize.tsv” (for the output file). The get output button opens a new page on which the name, txStart, txEnd are selected from the hg19.knownGene table and the kgXref table is selected under Linked tables. After allowing selection from checked tables at the bottom of the page, gene symbol is selected from the hg19.kgXref table, and the get output button is selected to download the file. Tabulating gene size: The size of a gene is tabulated by subtracting the txEnd position from the txStart position for each gene. In Microsoft Excel this is done with the following, example formula: column E=column C-column B (E=C-B), which is copied to each row. Duplicate gene symbols are removed by retaining only the gene size that is associated with the largest transcript of each gene. Ranking the sizes of genes: The sizes of genes are ranked using Excel by selecting the data and clicking Data on the navigation bar, and then selecting Sort. A new window is opened and the data is Sorted by Column E, which when changing the Order from Largest to Smallest, displays the data ranked from largest gene size to smallest gene size. After ranking the set of genes, all genes not ranked in the Top 5 for size are classified as, small (Table I).
Method of data acquisition for evolutionary conservation. The following methods detail the process of downloading, calculating, and verifying the evolutionary conservation of genes. There were two evolutionary conservation methods that were developed to assess an entire gene minus introns. One method, termed ETEC Method-1 (entire transcript, evolutionary conservation), provides a conservation number based on the base pair size of each exon, while a second method, termed ETEC Method-2, provides a score based on the number of conservation scores that overlap exons. Downloading files representing a 2 million base pair region with a cancer fusion gene partner: On the UCSC Genome Browser Assembly the UCSC Genes under Genes and Gene Prediction Tracks and the Conservation under Comparative Genomics are set to full while all other fields are hidden. The evolutionary conservation data is acquired from two separate files retrieved from Tables across the top navigation menu: the conservation file, and the transcript region and exons file. The following settings are used to generate the conservation file: Comparative Genomics (for the group field); Conservation (for the track field); Mammal El (phastConsElements46wayPlacental) (for the table field); position (for the region field); all fields from selected table (for the output format); and “genesymbol_conservation_sheet1.tsv” (for the output file). The get output button downloads the file. The following settings are used to generate the transcript regions and exons file: Genes and Gene Prediction Tracks (for the group field); UCSC Genes (for the track field); knownGene (for the table field); position (for the region field); selected fields from primary and related tables (for the output format); and “genesymbol_conservation_sheet2.tsv” (for the output file). The get output button opens a new page in which the name, txStart, txEnd, exonStarts, exonEnds are selected from the hg19.knownGene table and the kgXref table is selected under Linked tables. After allowing selection from checked tables at the bottom of the page, the gene symbol is selected from the hg19.kgXref table, and the get output button is selected to download the file.
Calculating evolutionary conservation: The files downloaded from the genome browser are opened with Microsoft Excel and placed into separate sheets coinciding with their respective names. The process of calculating the evolutionary conservation is performed for the largest transcript of a gene and it is based on its exon composition. Tabulating transcript and exon sizes: Sheet 2, “genesymbol_conservation_sheet2.tsv”, is used to calculate the transcript size of the gene by subtracting the txEnd position from the txStart position for each gene. In Excel this is done with the general formula: column G=column C-column B (G=C-B), which is copied to each row. Duplicate gene symbols are removed by retaining only the largest transcript of each gene. To calculate the exon sizes a third sheet is added, Sheet 3, to the Excel workbook and the following columns are created: “Exon Start”, “Exon End”, “Gene Symbol”, “Exon LOD Number”, “LOD Count”, “Exon Size”. Multiple exon start and end positions for each gene are grouped in a single row. For each row of sheet 2 the exon starts and exon ends are split and each pair is placed into a new row in sheet 3, with their corresponding gene symbol, to allow them to be analyzed individually. For example, the row of “exonStarts” a, b, c and “exonEnds” 1,2,3 would be split into three separate rows a1, b2, and c3. To calculate the exon size on sheet 3 the “Exon End” position is subtracted from the “Exon Start” position for each exon. In Excel this is done with the general formula: column F=column B-column A (F=B-A), which is copied to each row.
Tabulating LOD numbers and LOD counts: On sheet 1, “genesymbol_conservation_sheet1.tsv”, the name of each conservation row is split by the “=” symbol yielding a LOD number. Conservation regions on sheet 1 are determined to fall partially or completely within an exon region by comparing their “chromStart” and “chromEnd” regions with the “Exon Start” and “Exon End” regions of sheet 2. For each exon on sheet 3 the LOD numbers of the conservation regions that fall partially or completely within each exon region are added to give the “Exon LOD Number”. The LOD numbers that are added to get this number are counted and this value is placed under “LOD Count” on sheet 3. If no conservation regions fall within an exon region, both the “LOD count” and “Exon LOD Numbers” are set to zero.
Calculating the average evolutionary conservation per nucleotide (ETEC-1) and per LOD count (ETEC-2): To calculate the conservation of each gene a fourth sheet, sheet 4, is added to the Excel workbook and the following columns are created: “Total Exons Size”, “Gene Symbol”, “Total LOD Score”, “Total LOD Count”, “Nucleotide Average”, and “LOD Average”. The gene symbols from sheet 2 are copied into new rows in sheet 4. For each row of sheet 3, the “Exon Size”, “Exon LOD Number”, and “LOD Count” of each gene are added and placed with their respective gene symbol in sheet 4. On sheet 4, the average evolutionary conservation per nucleotide is calculated by dividing the “Total LOD Score” by the “Total Exon Size”. The average evolutionary conservation per LOD count is calculated by dividing the “Total LOD Score” by the “Total LOD Count”.
Method of data acquisition for 3’ and 5’ UTR size. The following methods detail the process of downloading, calculating, and verifying 3’ and 5’ UTR size. The methods described are specific for the 3’ UTR size; in order to analyze data for the 5’ UTR the same process is performed with the region set to the 5’ UTR. Downloading the files: On the UCSC Genome Browser Assembly the UCSC Genes under Genes and Gene Prediction Tracks is set to full while all other fields are hidden. The 3’ UTR size data is acquired from two separate files retrieved from Tables at the top navigation menu. The following settings are used to generate the first file: Genes and Gene Prediction Tracks (for the group field); UCSC Genes (for the track field); knownGene (for the table field); position (for the region field); custom track (for the output format); and “genesymbol_3UTR_sheet1.tsv” (for the output file). The get output button opens a new page in which the 3’ UTR Exons option is selected from the list, followed by the get custom track in file button. This file lacks the gene symbol, but contains useful information such as the start and end exon locations for the 3’ UTRs of the genes in the selected position, and the UCSC ID for each gene. Changing the output format to selected fields from primary and related tables and the output file to “genesymbol_3UTR_sheet2.tsv” are used to retrieve the second file. The get output button opens a new page in which the name is selected from the hg19.knownGene table and the kgXref table is selected under Linked tables. After allowing selection from checked tables at the bottom of the page, the gene symbol is selected from the hg19.kgXref table, and the get output button is clicked to download the data. Tabulating 3’ and 5’ UTR size: The files downloaded from the genome browser are opened in Microsoft Excel. Sheet 1, “genesymbol_3UTR_sheet1.tsv”, is used to calculate the size of each 3’ UTR exon by subtracting the end position from the start position for each exon. In Excel this is done with the general formula: column G=column C-column B (G=C-B), which is copied to each row. For example row 2, column G would have the formula “=C2-B2”. Sheet 2, “genesymbol_3UTR_sheet2.tsv”, is used to map the gene name and gene symbol. The gene name, column A, in sheet 2 is equivalent to the UCSC ID, column D, in sheet 1, and it is used to link the 3’ UTR exon size with its corresponding gene symbol. Multiple exons that are contained within the same 3’ UTR of a gene are identified according to their respective UCSC ID and each exon size is added to give the overall size of this particular region. If this results in duplicate gene symbols only the largest non-zero 3’ UTR size is retained. This completes the process of calculating 3’ UTR size for each gene. Verifying 3’ and 5’ UTR size: The calculated 3’ UTR size of random genes are cross-checked and compared to those listed on the gene track display under the Genome Browser by two different methods. The apparent largest gene is selected from the gene track display and its description and page index is displayed. If either verification method does not result in the same 3’ UTR size as calculated, then the largest transcript of a particular gene was not selected and a different transcript must be selected. Verification: A simple approach: In the Description and Page Index of the gene to be verified, the mRNA Secondary Structure of 3’ and 5’ UTRs table located in middle of the page is viewed. The value of the Bases column for the 3’ UTR is equal to the 3’ UTR size. This method is not available for all genes, in which case the verification by sequence process must be performed. Verification by Sequence: In the Description and Page Index of the gene to be verified, the Genomic Sequence (chr...) is selected under Sequence and Links to Tools and Databases which opens a new page. The following settings are selected: Under Sequence Retrieval Region Options only 3’ UTR Exons and One FASTA record per gene are selected; and under Sequence Formatting Options only Exons in upper case, everything else in lower case is selected. The submission of this page results in the genomic sequence of the 3’ UTR. The character count without spaces of this sequence is equal to the 3’ UTR size.
Average evolutionary conservation scores of small fusion gene partners compared with neighboring genes.
Average evolutionary conservation scores of large fusion gene partners compared with neighboring genes.
Evolutionary conservation rank order analysis of large fusion gene partners.
Method of data acquisition for 3’ and 5’ UTR folding energy. The following methods detail the process of downloading, and verifying the 3’ and 5’ UTR folding energy. The methods described are specific for the 3’ UTR folding energy. In order to analyze data for the 5’ UTR the same process is performed with the region set to the 5’ UTR.
On the UCSC Genome Browser Assembly the UCSC Genes under Genes and Gene Prediction Tracks is set to full while all other fields are hidden. The 3’ UTR Folding Energy data is acquired from Tables across the top navigation menu. The following settings are used to generate the first file: Genes and Gene Prediction Tracks for the group field; UCSC Genes for the track field; knownGene for the table field; position for the region field; selected fields from primary and related tables for the output format; and “genesymbol_3UTR_ FoldingEnergy.tsv” for the output file. The get output button opens a new page in which the name is selected from the hg19.knownGene table and the kgXref and foldUtr3 tables are selected under Linked tables. After allowing selection from checked tables at the bottom of the page, the gene symbol is selected from the hg19.kgXref table, the energy is selected from the hg19.foldUtr3 table, and the get output button is clicked to download the data. Verifying 3’ and 5’ UTR folding energy: In the Description and Page Index of the gene to be verified, the mRNA Secondary Structure of 3’ and 5’ UTRs table located in the middle of the page is analyzed. The value of the Fold Energy column for the 3’ UTR is equal to the 3’ UTR Folding Energy. If this information is not available, then the folding energy value in the table downloaded is “n/a”. The genes that were recorded as n/a were not included in Table V or Figure 3. The folding energy values were converted from negative to positive values for convenience of display.
Results and Discussion
Quantitative assessment of the evolutionary conservation of large cancer fusion gene partners. We previously analyzed the characteristics of known cancer fusion gene partners and determined that a subset of cancer fusion gene partners were significantly larger than their neighboring genes (9). To determine whether these genes were also evolutionarily conserved, we employed two methods for establishing evolutionary conservation over the length of the entire transcript region for each gene, hereafter referred to as ETEC (entire transcript region, evolutionary conservation) Method-1 and ETEC Method-2, detailed in Methods above.
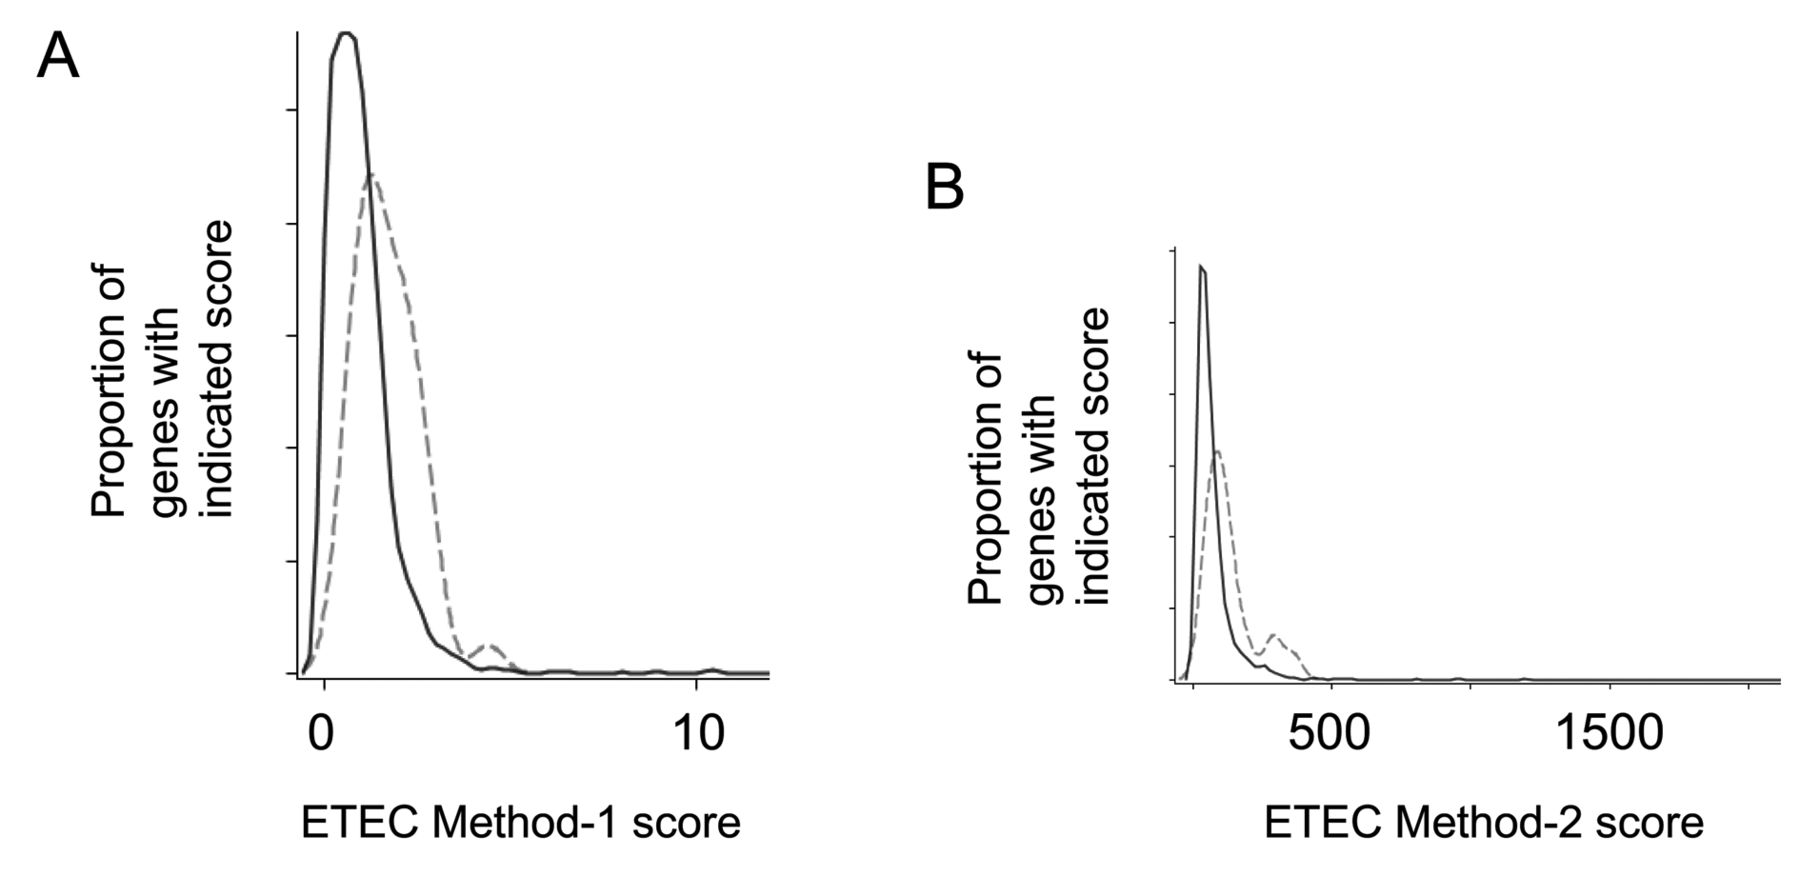
Evolutionary conservation of large cancer fusion gene partners. A. The evolutionary conservation of 39 large cancer fusion gene partners (broken line) compared with neighboring genes (solid line) based on ETEC Method-1 (p<0.0001, Wilcoxon’s sign test). B. The evolutionary conservation of 39 large cancer fusion gene partners (broken line) compared with neighboring genes (solid line) based on ETEC Method-2. (p<0.0001, Wilcoxon’s sign test).
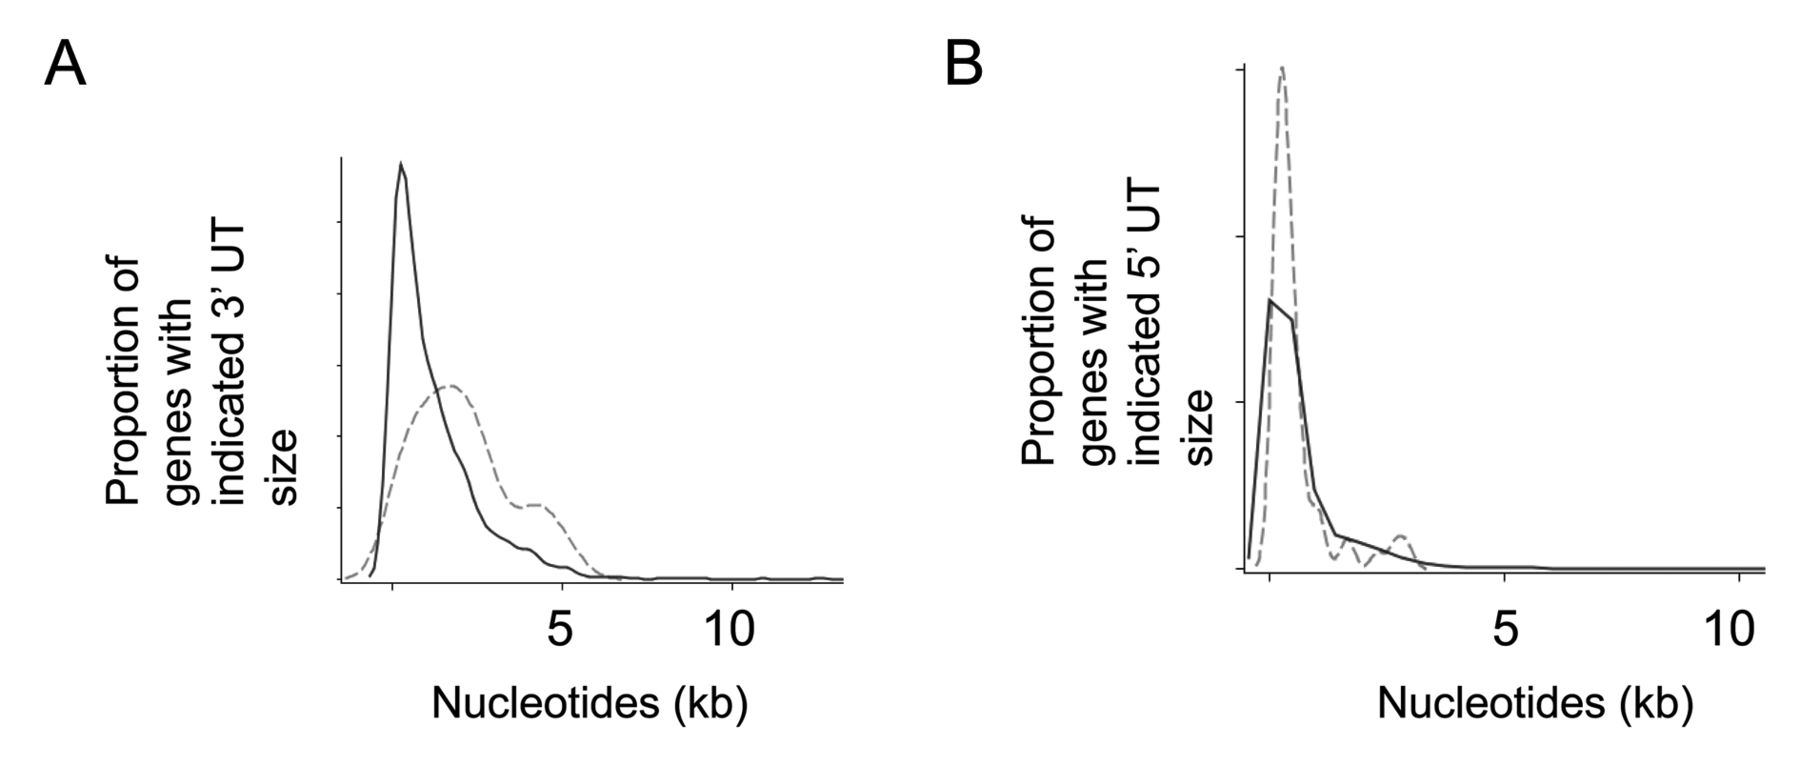
UTR sizes of cancer fusion gene partners. A. Distribution by 3’ UTR sizes of the cancer fusion gene partners (broken line) and neighboring genes (solid line) (p<0.0001, based on Wilcoxon’s rank sum test). B. Frequency distribution by 5’ UTR size of the fusion gene partners and their neighboring genes. The 5’ UTR size of fusion gene partners are not significantly different compared with their neighboring genes (p=0.2728, based on Wilcoxon’s rank sum test).
To determine whether the cancer fusion gene partners, previously determined to be evolutionarily conserved by another, less precise method, could be ranked as such using the novel methods developed for this project, we evaluated 18 small, evolutionarily conserved cancer fusion gene partners from the previous study. To have a test set that would represent greater statistical significance, we added additional small cancer fusion gene partners, identified as indicated in Methods. In short, the previous report established that cancer fusion gene partners were either large, or small AND evolutionarily conserved. Thus, we operated from the premise that all additional, small fusion gene partners would be evolutionarily conserved and used this larger collection of small cancer fusion gene partners as the test set for the ETEC Method-1 and ETEC Method-2 (Table I).
ETEC Method 1 ranking of large genes.
The average evolutionary conservation scores for all 86 small fusion gene partners were compared with the average evolutionary conservation scores of the entire set of 3412 neighboring genes. Results indicated that the small fusion gene partners were significantly more evolutionarily conserved than their neighbors, thus validating the two methods of whole-gene quantification of evolutionary conservation indicating that these genes are significantly more evolutionary conserved (Table II, p<0.0001).

The 3’ UTR folding energies of cancer fusion gene partners (broken line) and neighboring genes (solid line) (p=0.0141, based on Wilcoxon’s sign test).
We then used ETEC Methods-1 and -2 to quantify the evolutionary conservation of 39 large cancer fusion gene partners along with the 1,320 neighboring genes (Figure 1A,B). Results indicated that the large fusion gene partners were twice as conserved, according to the quantification methods used, on average, in comparison to their neighboring genes (Table III, p<0.0001). These results unify the two previously distinct genomics features of cancer fusion gene partners (9).
We performed a statistical analysis of the cancer fusion gene partner ranks, as compared to those of their neighboring genes, based on ETEC Methods-1 and -2 to estimate the probability that a fusion gene occurs within the top 5 genes, with regard to the evolutionary conservation scores. The results indicate that in any segment of a chromosome, any 1 randomly chosen gene has a 12.5% chance of being within the top 5 for evolutionary conservation scores, but for known cancer fusion gene partners, this probability is increased to 50.0% (Table IV). Ranking by evolutionary conservation could, thus, facilitate the process of identifying a cancer fusion gene in an unstudied translocation (Table V).
Further characteristics that distinguish cancer fusion gene partners from their neighbors. We also analyzed the 3’ UTRs of cancer fusion gene partners, both by size and by folding energy, due to a preliminary inspection of graphical data that suggested that fusion gene partners had larger 3’ UTRs than their neighboring genes (9). To determine whether cancer genes involved in fusion events had larger 3’ UTRs, we examined both the 3’ and 5’ UTRs of all 58 fusion gene partners from the original set (9) and compared them to that of the 2,409 neighboring (Figure 2A, B). Results indicated that the 3’ UTR of cancer fusion gene partners, with an average size of 2082 bps, was significantly larger when compared to their neighboring genes, with an average size of 1242 bps (Figure 2A; Table VI, p<0.0001). In contrast, the size of the 5’ UTR’s of cancer fusion gene partners was not significantly different when compared to their neighboring genes (Figure 2B; Table VI, p=0.2728).
Nucleotide lengths of 3’ UTR’s and 5’ UTR’s of cancer fusion gene partners in comparison to neighboring genes.
Folding energies of the 3’ UTRs and 5’ UTRs of cancer fusion gene partners in comparison to neighboring genes.
Because the 3’ UTR was determined to be significantly larger in the cancer fusion gene partners, we considered the question, could a larger 3’ UTR facilitate more secondary structure in the cancer fusion gene partners? Thus, we analyzed the folding energies of both the 3’ UTRs and 5’ UTRs of the 58 cancer fusion gene partners and their 2,409 neighboring genes. Results indicated that the 3’ UTRs of cancer fusion gene partners had significantly higher levels of folding energy compared to the neighboring genes (Figure 3, p=0.014). Cancer fusion gene partners had an average value of 676 kcal/mol for folding energy, as compared to their neighboring genes with an average folding energy of 417 kcal/mol (Table VII). On the other hand, the 5’ UTR folding energies of genes involved in fusion events were not significantly different when compared to their neighboring genes (Table VII, p=0.0516).
Acknowledgments
Libia Pava conducted most of the initial analyses and wrote the first draft of the manuscript. Daniel Morton wrote all of the software needed for analyses. Ren Chen performed all of the statistical analyses. George Blanck participated in follow-up analyses. All authors participated in finalizing the manuscript text.
Supporting online material at www.universityseminarassociates.com/som/som0001.pdf
- Received August 13, 2012.
- Accepted August 27, 2012.
- Copyright© 2012 International Institute of Anticancer Research (Dr. John G. Delinassios), All rights reserved