

Abstract
Background: Cutaneous squamous cell carcinoma (cSCC) is a common type of skin cancer but there are no comprehensive proteomic studies on this entity. Materials and Methods: We employed liquid chromatography coupled with tandem mass spectrometry (MS/MS) using formalin-fixed paraffin-embedded (FFPE) cSCC material to study the tumor and normal skin tissue proteomes. Ingenuity Pathway Analysis (IPA) was used to interpret the role of altered proteins in cSCC pathophysiology. Results were validated using the Human Protein Atlas and Oncomine database in silico. Results: Of 1,310 unique proteins identified, expression of an average of 144 and 88 proteins were significantly (p<0.05) increased and decreased, respectively, in the tumor samples compared to their normal counterparts. IPA analysis revealed disruptions in proteins associated with cell proliferation, apoptosis, and migration. In silico analysis confirmed that proteins corresponding to 12 antibodies, and genes corresponding to 18 proteins were differentially expressed between the two categories, validating our proteomic measurements. Conclusion: Label-free MS-based proteomics is useful for analyzing FFPE cSCC tissues.
- Cutaneous squamous cell carcinoma
- formalin-fixed paraffin embedded
- laser capture microdissection
- proteomics
- label-free mass spectrometry
Cutaneous squamous cell carcinoma (cSCC) is a widespread malignancy that is responsible for at least 20% of all non-melanoma skin cancer (NMSC) cases (1). The highest incidence of cSCC occurs in Australia, where a large Caucasian population has intense exposure to solar UV-radiation (2, 3). In Australia from 1997 to 2010, NMSC treatments increased by 86%, and this number was projected to have increased a further 22% in 2015, with a total cost of AU $703.0 million for NMSC diagnosis and treatment (3).
While the majority of patients with early cSCC have a good prognosis, outcomes for patients with metastatic disease are poor, with a 5-year survival rate of less than 10% (4, 5). One of the most prominent contributing factors to poor patient outcome is the lack of sensitive biomarkers to facilitate early diagnosis and management of the tumor. A handful of genetic biomarkers have been studied in cSCC, including cellular tumor antigen p53 (TP53), notch 1 (NOTCH1) (6, 7), human epidermal growth receptor 2 (HER2), HER4, E-cadherin (CDH1), epidermal growth factor receptor (EGFR), and podoplanin (PDPN) (5, 8, 9), and some have shown potential for prognostication (9-12). However, there is a lack of evidence to recommend the use of these biomarkers for cSCC tumor stratification.
cSCC lesions exhibit dramatic histopathological diversity and are associated with a wide range of clinical courses and outcomes. The ability to discriminate SCC variants based on distinct molecular profiles is of great importance when assessing the risk of progression, as well as the clinical management, of patients with cSCC (13). While immunohistochemistry and western blot studies have identified several abundant proteins differentially expressed between cSCC, actinic keratosis (AK) and Bowen's disease lesions, including cyclin-dependent kinase inhibitor 1B (p27), TP53 (14-16), serpin A1 (SERPINA1) (17); matrix metalloproteinase (MMP)-2, -7, -9 and -13 (16, 18, 19); c-myc protein (C-MYC) (20); tenascin-C (TNC) (21); and complement factor-I (CFI) and complement factor-H (CFH) (22, 23), these markers have not been useful for classifying cSCC subtypes into clinically meaningful categories. The need for comprehensive molecular profiling of cSCC is clear (24).
Studies have compared gene-expression profiles of cSCC and its histopathological subtypes, reporting a wide range of genomic changes between tumors and normal keratinocytes (9, 25). With revolutionary advances in mass spectrometry (MS), comprehensive proteome profiling and quantitation has become one of the leading research techniques used for biomarker discovery, as well as for improving our understanding of the molecular pathophysiology of cancer (26, 27). Comprehensive proteomic profiling studies of cSCC lesions are, to our knowledge, non-existent. This is perhaps due to a lack of banked fresh-frozen tumor material. We have optimized our MS-based proteomics methodology for the use of archival formalin-fixed paraffin-embedded (FFPE) materials. In the present study, we employed laser capture microscopy (LCM) to separate tumor cell populations and surrounding morphologically normal tissues for comprehensive quantitative MS analysis. In silico analysis using Oncomine database was used to validate our proteomics findings and to extend these findings to gene-expression level. Data presented here highlight the feasibility of using archival FFPE cSCC material for proteomic profiling to identify reliable biomarkers for the clinical management of cSCC.
Materials and Methods
Patient samples. FFPE tissue blocks from five cSCC tumor samples were obtained from the Skin and Cancer Foundation, Australia, with approval from the University of Sydney Ethics Committee (protocol number 2012/2215). Hematoxylin and eosin (H&E)-stained sections of each tumor block were reviewed and tumors were confirmed histopathologically as UV-induced cSCC.
Laser capture microdissection. H&E-stained FFPE sections (10 μM) were used for LCM using a PALM Laser Microbeam instrument (Carl Zeiss MicroImaging GmbH, Jena, Germany). Under direct microscopic visualization of the H&E-stained FFPE sections, tumor masses between the stratum corneum and basal membrane in the epidermis layer of the skin were captured. Cells were captured using the AutoLPC function using laser energy of between 70% and 80%. The speed for stage movement during LPC function was set to the maximum, 585 μm/s. Adjacent, morphologically normal tissues were taken from similar regions in the epidermis layer, 1-1.5 mm distance from the tumor mass and used as controls in pair-wise comparisons. Attempts were made to exclude any immune cell infiltrates, blood vessels, and any other potential contaminants in both tumor and normal tissues. Microdissected materials were collected in 0.5 ml PALM adhesive caps (Carl Zeiss MicroImaging GmbH). On average, cSCC and normal tissues were each represented by 15 sections, with a surface area of approx. 50 mm2.
Protein extraction and sample preparation. Microdissected tissues were washed from the adhesive caps with 300 μl 0.1% w/v RapiGest™ SF Surfactant (Waters Corporation, Milford, MA, USA) in 50 mM triethylammonium bicarbonate (TEAB; Sigma-Aldrich, St Louis, MO, USA) in a 1.5 ml boil-proof microcentrifuge tube (Axygen Scientific, Union City, CA, USA). Following a vigorous vortex, the homogenate was sonicated continuously for 1 min with a step tip probe (15% intensity; Branson Ultrasonics, Danbury, CT, USA) and incubated at 95°C for 30 min. Following centrifugation at 16,000 × g at 4°C for 20 min, the protein yield was quantified using Qubit® 2.0 Fluorometer (Life Technologies, Carlsbad, CA, USA). Protein extracts were then reduced in 12 mM tris(2-carboxyethyl)phosphine (TCEP; Sigma-Aldrich) for 30 min at 60°C followed by alkylation in 50 mM iodoacetamide (Sigma-Aldrich) for 30 min at room temperature in the dark. Proteolytic digestion was performed following the addition of sequencing grade modified trypsin (1:40 trypsin:protein ratio; Promega, Madison, WI, USA) followed by overnight incubation at 37°C. Rapigest™ (Waters Corporation, Milford, MA, USA) detergent was cleaved by acidification to pH<2, 37°C incubation for 30 min and removed from the samples by centrifugation (13,000 × g, 20 min, 4°C). Peptide mixtures were desalted using 1cc Oasis HLB cartridges (Waters Corporation); final yields were determined by Qubit quantitation and 10 μg aliquots vacuum were concentrated using Savant Speedvac Plus sample concentrator (Thermo Savant, Holbrook, NY, USA) and stored at −20°C.
Reverse-phase liquid chromatography coupled with tandem mass spectrometry (RP-LC-MS/MS) analysis. Peptide mixtures (10 μg) were prepared in 20 μl of 1% formic acid (FA) and 0.05% heptafluorobutyric acid for RP-LC-MS/MS analysis. Samples were separated by a nanoflow Ultimate 3000 HPLC and autosampler system (Dionex Corp, Sunnyvale, CA, USA) coupled online to a Q-Exactive™ Plus mass spectrometer (Thermo Fisher Scientific, Waltham, MA, USA) with a nanospray ionization ion source. Peptides (2 μg) were loaded in triplicate at a flow rate of 200 nl/min onto a C18-reversed phase column with mobile phase buffers A (2% acetonitrile (ACN)/0.1% FA) and B (80% ACN/0.1% FA), over a 2-h linear gradient (2-45% B for 118 min; 45-80% B for 1 min, 80% B for 1 min). Duplicate blank runs (30 min, 2-80% buffer B) were performed between each sample type, with 10 min washes with 2% buffer B prior to each sample. Data acquisition was achieved in a positive polarity mode using a data-dependent top-10 method where the most abundant precursor ions from the survey scan (350-1,750 m/z) were dynamically chosen for higher-energy collisional dissociation (HCD) fragmentation. Survey scans were acquired at a resolution of 70,000 while for HCD spectra this was set to 17,500. In order to increase the likely coverage of lower abundant precursor ions, a 30 s dynamic exclusion list was employed. Automatic gain control was used to ensure that the Orbitrap mass analyzer always filled with the optimum number of ions, i.e. 1×10⁶, for generation of MS/MS spectra. Normalized collision energy was set to 30 eV to achieve optimum fragmentation efficiency, and the intensity threshold, which defines the minimum precursor intensity to trigger an MS2 scan, was set to 5×10⁴. A list of around 500 ion masses corresponding to the most common and prominent peptide contaminants as provided by Keller et al. (28) and Hodge et al. (29) were added as an exclusion list. PeptideMass function of the ExPASy (http://web.expasy.org/peptide_mass) was used to calculate theoretical monoisotopic ion masses of potentially important proteins such as mitogen-activated protein kinase kinase 1 and 2 (MEK1/2), mitogen-activated protein kinase 1, 2 and 5 (ERK1/2/5), serine/threonine-protein kinase B-Raf (B-RAF), Kirsten rat sarcoma viral oncogene homolog (K-RAS) and P53, the generated ion masses of which were added to an inclusion list in the MS method.
Protein identification and quantification. MS/MS data were analyzed using Mascot (version 2.5.1.0; Matrix Science, London, UK). Peak lists were searched using Mascot against SwissPROT database (29/01/2015), selected for Homo sapiens (20,274 entries) and trypsin digestion with a maximum of one missed cleavage. Mascot was searched with a fragment ion mass tolerance of 0.1 Da and a parent ion tolerance of 20 ppm. Oxidation of methionine and carbamidomethyl of cysteine were specified in Mascot as variable modifications. Scaffold Q+ (version 4.4.1.1; Proteome Software Inc., Portland, OR, USA) was used to visualize MS/MS-based peptide and protein identifications. Peptide identifications were accepted if they could be established at ≥90.0% probability by the Peptide Prophet algorithm (30, 31) with Scaffold delta-mass correction. The total spectral count was used as a measure of protein abundance, and protein identifications were accepted above a 99.0% probability threshold and with at least two identified peptides. All conflicting proteins were manually removed to eliminate ambiguous protein identities and therefore, selected peptides for quantification were exclusive to one protein species. Results were exported to Microsoft Excel® (Microsoft Corporation, Redmond, WA, USA) and SPSS® Statistics (IBM® vr.22; IBM Corp., Armonk, NY, USA) for statistical analysis; Student t-tests assuming equal variance were performed to determine whether changes in protein abundance between the tumor and surrounding normal tissues were significant (p<0.05). The Human Protein Reference Database (http://www.hprd.org) (32) was used to annotate principle functions of proteins identified in MS/MS analysis. The FunRich functional enrichment analysis tool version 2.1.2 (http://funrich.org) (33) was used to determine the subcellular location of proteins.
Ingenuity® Pathway Analysis (IPA) analysis. Comparative bioinformatics analysis was performed using IPA software (Ingenuity Systems, USA, http://analysis.ingenuity.com). This software calculates the probability that the genes associated with our dataset (right-tailed Fisher's exact test) are involved in particular pathways, compared to the total number of occurrences of those proteins in all functional annotations stored in the Ingenuity Knowledgebase. Data were uploaded to IPA and core analyses performed to identify important interactions and associations with the following amendments to default criteria: Direct and indirect relationships, generate interaction networks with 140 molecules per network, highly predicted or experimentally observed confidence levels, human species with relaxed filtering, restricted to tissue/primary epithelial cells and tumor cell lines
In silico validation of proteomic profile data by assessment of immunohistochemistry data from the human protein atlas (HPA). To validate our proteomics measurement, we used high-quality immunohistochemistry data deposited in the HPA project (www.proteinatlas.org) to examine the expression of proteins in paraffin-embedded material of surgical specimens from normal skin and patients with cSCC. The HPA is a database of tissue microarrays labelled with antibodies against over 11,000 human proteins (34). There are a maximum of 12 skin cancer images and six normal images per antibody. The HPA staining scores used in the current study were surgical sections of the skin labelled with either protein S100-A2 (S100A2), protein S100-A11 (S100A11), mitochondrial superoxide dismutase [Mn] (SOD2), moesin (MSN), TNC, ras GTPase-activating-like protein IQGAP1 (IQGAP1), fascin (FSCN1), nuclear factor erythroid 2-related 2 (NEF2L2), transcription factor AP-1 (JUN), pyruvate kinase PKM (PKM), transcription intermediary factor 1-alpha (TRIM24), peroxisomal acyl-coenzyme A oxidase 1 (ACOX1), galectin-7 (LGALS7) and Apolipoprotein E (APOE) antibodies. The staining intensity was classified as negative, weak, moderate or strong based on the level of immunoreactivity between the protein and antibody.
Analysis of proteomics measurement in cSCC tumors at transcript levels. We used the publicly available gene-expression database Oncomine Research Edition (www.oncomine.com; Compendia Biosciences, Ann Arbor, MI, USA) to assess the gene-expression levels of proteins significantly changed in our dataset. mRNA levels corresponding to the proteins/genes were analyzed and visualized in two independent cohorts on Human Genome U133 Plus 2.0 Arrays. The first cohort (Riker_melanoma) analyzed 19,574 genes using 54,675 reporters, with 11 primary cSCC and four samples of normal human skin (35). Non-SCC tumor samples used in this study were excluded from analysis. The second cohort measured 12,624 genes, 22,283 reporters from 15 samples comprising of normal skin (n=6), AK (n=4), and cSCC (n=5) from immunosuppressed organ-transplanted recipients (25). Expression levels generated by Oncomine displayed log2 median-centered ratio box plots comparing normal sample to cSCC and AK. A gene was considered as differentially abundant when its mean value in tumor samples was significantly higher or lower than its mean value in the normal tissue counterpart using Student's t-test (p<0.05) and a fold-change of more than two. Overexpressed genes were labeled with positive integers, and underexpressed genes labeled with negative values.
Results
LCM of archival cSCC tissues. We employed LCM to separate tumor cell populations from normal surrounding tissues from five FFPE cSCC lesions prior to MS analysis. Figure 1 illustrates cSCC and normal tissues before and after LCM. An average of 50 mm2 tissue was collected by LCM from each cSCC and normal specimen and yielded approximately 0.8 μg protein/mm2, which was sufficient for subsequent MS analysis.
MS/MS analysis of microdissected cSCC lesions and normal surrounding skin. Overall, we identified 1310 unique protein species across the five patient specimens, with an average of 714 and 641 proteins identified in each tumor and normal tissue pair, respectively. The peptide sequence coverage, which is an indicator of the degree of confidence of protein identification, was very good and for some proteins, i.e. LGALS7, it reached as high as 88%. Interestingly, 216 proteins (16.5%) were exclusive to the cSCC samples, including two proteins, golgi reassembly stacking protein 2 (GORASP2) and hypoxanthine phosphoribosyltransferase 1 (HPRT1), identified in at least four patients (see Table I).

Laser capture microdissection (LCM) of formalin-fixed and paraffin-embedded (FFPE) cutaneous squamous cell carcinoma (cSCC) and morphologically normal tissues. Under direct microscopic visualization of the hematoxylin and eosin (H&E)-stained FFPE sections, cSCC masses (left panel) and adjacent morphologically normal tissues (right panel) were microdissected using the PALM Laser Microbeam instrument. The top panel shows the H&E-stained slides before LCM, middle panel after the LCM, and bottom panel the cells captured in the collecting tube; blue dots mark points where the laser pulses catapult the tissue into the collection tube.
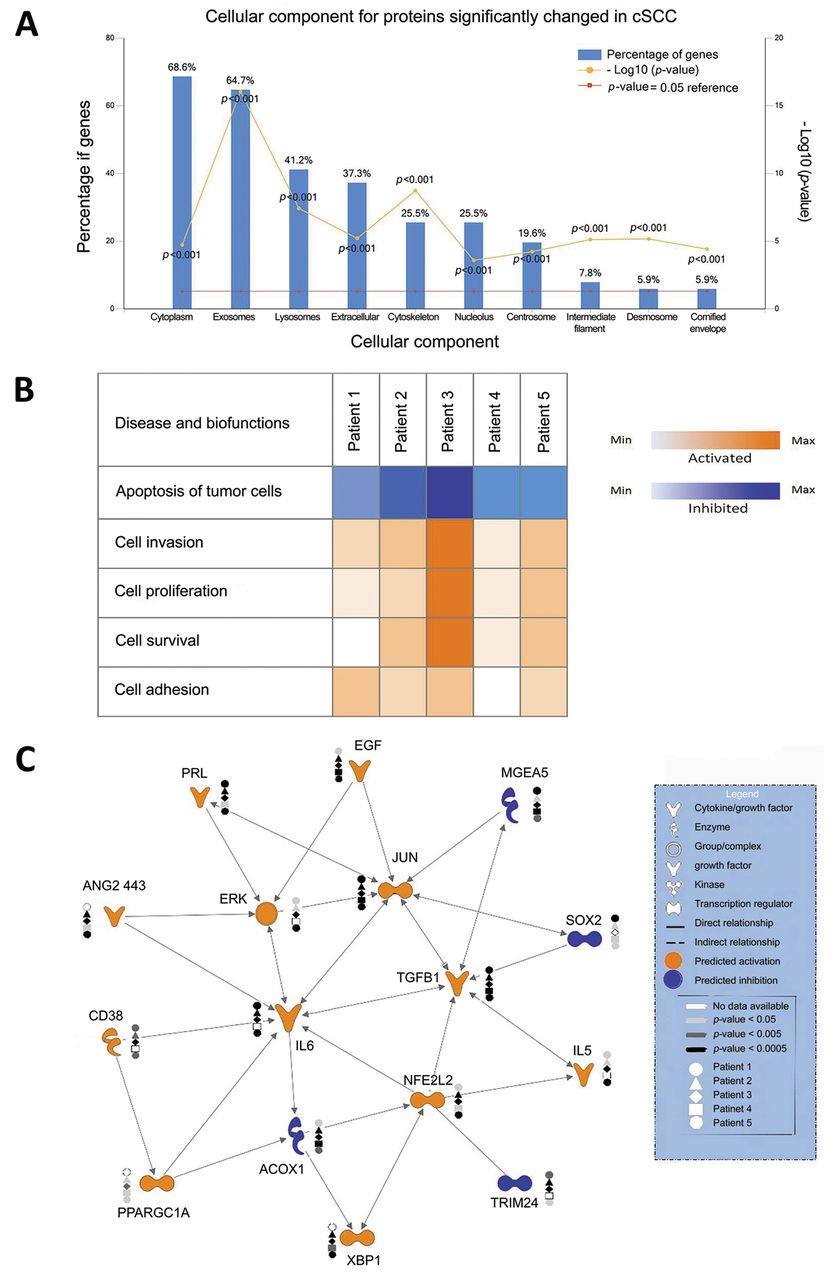
Label-free quantification using total spectral counting revealed an average of 144 and 88 proteins significantly increased and decreased in cSCC proteomes compared to adjacent normal tissues samples, respectively (p<0.05). Of these, 29 and 21 proteins were significantly increased and decreased, respectively, in at least four patients (see Table I). We detected 10 proteins that were significantly decreased in all five patients, including cystatin-6 (CST6), filaggrin (FLG), filaggrin family member 2 (FLG2), dermokine (DMKN), arginase-1 (ARG1), keratin 1, type II (KRT1), keratin 9, type I (KRT9), keratin 10, type II (KRT10), calmodulin-like 5 (CALML5) and Suprabasin (SBSN). FunRich functional enrichment analysis predicted top subcellular localization of disrupted proteins in cSCC were the cytoplasm in 68.6%, exosomes in 67.7%, lysosome in 41.2%, extracellular in 37.3% and cytoskeleton in 25.5%; Figure 2a).
List of proteins restricted to, or significantly (p<0.05) more/less abundant in at least four patients with cutaneous squamous cell carcinoma (cSCC) compared to normal skin.

Functional enrichment analysis and Ingenuity Pathway Analysis (IPA) of proteins changed in cutaneous squamous cell carcinoma (cSCC). A: Bar graph of top-10 subcellular locations overrepresented by proteins significantly changed in at least four patients with cSCC using enrichment analysis of proteins against the FunRich database (33). B: Heat map of the main biofunctions disrupted by proteins significantly changed in each patient as generated by IPA analysis: blue indicates inhibition and orange activation of functions in the corresponding patient; the higher the color intensity, the higher the disruption of biofunction; white boxes denote an absence of information. C: IPA upstream regulator analysis tool was used to assemble a network based on the top 16 upstream regulators with predicted activation or inhibition in cSCC. Molecules are represented as functional classes of the gene product as indicated in the legend. Individual patients are represented by different shapes, i.e. patient 1 by a circle, and the grey-scale is indicative of the level of significance.

In silico immunohistochemical expression of a subset of cutaneous squamous cell carcinoma (cSCC)-identified biomarkers. Surgical sections of cSCC and normal skin tissues were stained with S100 calcium binding protein A2 (S100A2), S100A11, mitochondrial superoxide dismutase [Mn] (SOD2), moesin (MSN), tenascin (TNC), fascin (FSCN1), nuclear factor erythroid 2-related 2 (NEF2L2), transcription factor AP-1 (JUN), pyruvate kinase PKM (PKM), transcription intermediary factor 1-alpha (TRIM24), peroxisomal acyl-coenzyme A oxidase 1 (ACOX1), galectin-7 (LGALS7) and apolipoprotein E (APOE) antibodies. Data are from The Human Protein Atlas online resource (www.proteinatlas.org).
Comparative bioinformatics analysis of significant protein changes in patients with cSCC. In order to interpret the functional implications of significant protein changes in the context of cSCC pathophysiology, gene names corresponding to differentially abundant proteins were mapped in the IPA environment and core analyses performed for each patient tumor. Altered proteins were predominantly involved in biological processes essential for tumor growth and progression, i.e. increased cell survival, invasion and proliferation, as well as decreased apoptosis and cell death (Figure 2b). Furthermore, the IPA upstream regulator analysis predicted more than 50 upstream regulators implicated in cSCC that could explain the observed protein expression changes in the dataset. Up-stream regulators that were common to four or more patients and had the same predicted activation state included EGF, prolactin (PRL), JUN, ERK, angiopoietin-2(443) (ANG2 443), interleukin-5 (IL5), interleukin-6 (IL6), transforming growth factor beta-1 (TGFB1), nuclear factor erythroid 2-related factor 2 (NFE2L2), X-box-binding protein 1 (XBP1), peroxisome proliferator-activated receptor gamma coactivator 1-alpha (PPARGC1A) (activated), TRIM24, meningioma-expressed antigen 5 (MGEA5), transcription factor SOX-2 (SOX2), and ACOX1 (inhibited). An interaction network of these regulators generated by IPA Path Explorer tool is shown in Figure 2c.

Gene expression levels of S100 calcium binding protein A11 (S100A11) (A), fascin (FSCN1) (B), ADP-ribosyl cyclase/cyclic ADP-ribose hydrolase 1 (CD38) (C) and transcription factor AP-1 (JUN) (D) in independent cutaneous squamous cell carcinoma (cSCC), actinic keratosis (AK) and normal skin (control) samples from patient cohorts. mRNA levels were analyzed (Human Genome U133 Plus 2.0 Arrays) in silico using expression data from two cohorts (i) Nindl et al. (25) and (ii) Riker et al. (35). n Is the number of samples in each subgroup, dots in the box plots represent maximum and minimum values; error bars represent 1.5× interquartile range; significantly different at *p<0.05; **p<0.01; ***p<0.001.
In silico validation of proteomic measurements by assessment of immunohistochemistry data from the HPA. Of the top 14 evaluable antibodies studied, 10 (S100A2, S100A11, SOD2, MSN, TNC, IQGAP1, FSCN1, NEF2L2, JUN, PKM) exhibited moderate to strong nuclear and cytoplasmic immunoreactivity in the cSCCs while the staining was negative and relatively weak in normal skin (Figure 3). In contrast, four proteins TRIM24, ACOX1, LGLAS7 and APOE did not show any or only weak immunoreactivity in cSCCs compared to normal skin (Figure 3). These results were consistent with our findings and supported our proteomics measurements. The immunoreactivity for the rest of the antibodies were either unavailable or were uninterpretable.
Analysis of proteomics measurement in cSCC tumors at transcript levels. We used the Oncomine databank to examine the levels of transcripts corresponding to significantly altered proteins here, in two independent patient cohorts. mRNA levels of actin-related protein 2/3 complex subunit 1B (ARPC1B), adenylyl cyclase-associated protein 1 (CAP1), S100A2, S100A11, myosin-9 (MYH9), prothymosin alpha (PTMA), SOD2, MSN, TNC, IQGAP1 and FSCN1 were significantly increased (p<0.05) in cSCC compared with normal tissue samples in both studies (25, 35), consistent with the proteomics finding presented here. Increases in TGFB1, ferritin heavy chain (FTH1), proteasome subunit beta (PSMB), 40S ribosomal protein S8 (RPS8), 60S ribosomal protein L7a (RPL7A), filamin-A (FLNA) and eukaryotic translation initiation factor 4H (EIF4H) mRNA levels were also observed in cSCC samples compared with normal tissue in the cohort of Riker et al., (35), also in line with our proteomics measurement. Additionally, increases in ADP-ribosyl cyclase/cyclic ADP-ribose hydrolase 1 (CD38) transcript level in both cohorts (25, 35), TGFB1, ERK and NFE2L2 in the Riker et al. cohort (35), and JUN in the Nindl et al. cohort (25) supported the predicted upstream activations of these molecules inferred by IPA. Log2 median-centered ratio box plots comparing the expression of top four changed transcripts S100A11, FSCN1, CD38 and JUN in normal sample to cSCC and AK are shown in Figure 4.
Discussion
LC-MS/MS analysis is an effective research strategy for global biomarker discovery, as demonstrated in many cancer types including oral SCC (36), head and neck SCC (37-39) and melanomas (40-42). Using patient samples such as fresh biopsies, serums and cell lines, MS analysis has led to the identification of novel protein biomarkers. Over the last few years, advances in protein extraction methodologies have made it possible to retrieve invaluable proteomic data from FFPE materials using MS (40, 43, 44). The application of pre-digestion enrichment processes, such as LCM, ensures that downstream proteomic analyses reflect predominantly the cells of interest, and also improves the detection, coverage and reproducibility of peptide measurements (45). In the present study, we employed LCM coupled to a comprehensive label-free LC-MS/MS to test the feasibility of using archival FFPE cSCC material for proteomic investigations. We demonstrate that proteins can be successfully extracted from microdissected FFPE cSCC tissues and are suitable for downstream MS analysis.
We identified over 1,310 unique protein species across FFPE tissues from five patients. This number is comparable to those observed in global, whole-tissue proteomic studies in other tumor samples using similar methodologies (46-49). In addition, the peptide sequence coverage of up to 88% was a reflection of sufficient protein digestion and reliable protein identification in our study (50). Several proteins found here to have higher abundances in cSCC tumor sections, were previously reported at higher levels in cSCC lesions using antibody-dependent methods, such as immunohistochemistry and western blots. Such proteins include TNC (12, 25), IQGAP1 (51) and S100A2 (52). On the other hand, changes in proteins, such as S100A11, ANXA1, RPS8, RPS4X, FSCN1, MYH9, ARG1 and CST6, which play roles in various carcinogenic processes (53-60), were not previously reported in cSCC, and our study is the first to show such associations. While not statistically significant, our study showed increases in S100A6 and ezrin (EZR) that were previously reported to be significantly more abundant in cSCC (61, 62). This difference could be due to our small sample size and the inheriting semi-quantitative nature of immunohistochemistry and western blot techniques used in the previous studies. Like many other global proteomic studies, kinases at low abundance that are likely to be key drivers in cSCC tumorigenesis evaded detection and measurement. The addition of phospho-peptide enrichment strategies or employment of data-independent acquisition-based MS where tandem MS scans are collected independent from precursor ion information would be crucial in achieving this goal.
We showed that 10 proteins including CST6, FLG, FLG2, DMKN, ARG1, KRT1, KRT9, KRT10, CALML5 and SBSN were significantly decreased in all five patients. The role of CST6 as a tumor suppressor is well established in many cancer types including breast (63-67) and prostate cancer (68). CST6 is a potent endogenous protein inhibitor of lysosomal proteases and its down-regulation, mainly through epigenetic inactivation, promotes tumor cell invasion, cell proliferation and matrix remodeling (64, 67). Increased expression of KRT9, KRT10, FLG and FLG2, which are involved in terminal epidermal differentiation, was reported in cSCC using gene-expression analysis (69). The role of KRT9, KRT10, FLG and FLG2 in pathophysiology of human cSCC is not well understood, however KRT10 has been reported to act as skin epithelial tumor suppressor in vivo, primarily through reducing the activity of serine-threonine protein kinase (AKT) and consequently the expression of cyclin D1 (CCND1) (70). AKT is a member of the phosphoinositide 3-kinase (PI3K)/AKT pathway and its activation in response to factors such as overexpression of EGF and its receptor (EGFR) has been reported during skin tumorigenesis (71-75). Interestingly, in line with previous studies (76), our IPA analysis predicted that EGF is activated in cSCC, which, together with the decrease in KRT10, suggest the potential role of the PI3K/AKT pathway in cSCC carcinogenesis.
While playing roles in amino acid metabolism, increased ARG1 expression is reported in patients with advanced cancer, including hepatocellular carcinoma, renal cell carcinoma and breast cancer (77-81). A study in preclinical murine models has also shown that inhibition of ARG1 in the skin is associated with increased inflammation and defects in matrix deposition (82). Inflammation is a critical component of tumor progression; therefore, ARG1 depletion may contribute to the progression of cSCC through increased inflammatory reactions in the skin.
Decreased expression of DMKN, particularly DMKN-β, has also been described in skin cancer (83). Exposure of keratinocytes and skin tumor cells to DMKN-β was found to interrupt phosphorylation of the transcription regulator ERK (84). ERK is a component of the ERK/mitogen-activated protein kinases signaling pathway and its involvement in various tumors, including cSCC, is well established (76, 84-87).
Other potential marker candidates of cSCC include SBSN, CALML5 and KRT1. Although SBSN is reported to be up-regulated in tumor endothelial cells (88), salivary adenoid cystic carcinoma (89) and in differentiating keratinocytes (90), there is little known about the expression and role of CALML5 and KRT1 in tumor pathophysiology, and their further investigation is warranted.
IPA bioinformatics analysis predicted the dysregulation of 16 potential upstream regulators that could explain the observed protein changes in cSCC. The roles of upstream regulators including EGF, JUN, ERK, IL6 and TGFB1 in cSCC carcinogenesis is well-established (76, 85-87, 91), and are of potential diagnostic and prognostic value for cSCC management. The expression and role of other upstream regulators, PRL, NFE2L2, XBP1, PPARGC1A, TRIM24, MGEA5, SOX2 and ACOX1, have not been described in cSCC, and further research is required to confirm their role in cSCC as well as their potential for use as biomarkers.
In order to validate our proteomics measurements, we took advantage of the large set of existing immunohistochemistry data deposited at the HPA database. The staining data of 12 significantly abundant proteins in our dataset was found to be relatively high in the skin tumor tissues compared to normal skin. In addition, results similar to our proteomics measurement were reported in the HPA database in terms of the expression of TRIM24, ACOX1, LGLAS7 and APOE in cSCC, i.e. underexpressed. These results not only support our proteomics measurement but also suggest the potential use of these biomarkers as attractive molecular target for treating cSCC.
We then decided to compare our results with the available datasets for genomic profiles in cSCC as further proof that our LC-MS/MS of FFPE materials detected meaningful differences. In silico analysis of publically available gene datasets confirmed changes in 23 transcripts, corresponding to 18 significantly changing proteins and five upstream regulators in cSCC samples compared with normal skin tissue. This finding not only reinforces our initial proteomics measurement but also suggests the importance of identified biomarkers in cSCC pre-translational molecular processes.
In conclusion, our study is the first to show that FFPE cSCC tissues offer great opportunity for retrospective proteomic analysis. We identified widespread proteome changes between cSCC and adjacent morphologically normal skin. These data highlight several potential biomarkers of cSCC and reveal a broad spectrum of disrupted signaling pathways that might offer therapeutic targets for early interventions.
Acknowledgements
A. Azimi is supported by a scholarship from the University of Sydney. K.L. Kaufman is supported by a Cancer Institute NSW Early Career Fellowship.
The Authors would like to acknowledge Dr. Louise Coles from the Bosch Institute Advanced Microscopy Facility at the University of Sydney, Dr. Flavia Senetiner from the Department of Dermatology at Westmead Hospital, Sydney, and Dr. Ling Zhong from the Bioanalytical Mass Spectrometry Facility at the University of NSW for their assistance and support with the LCM and MS techniques, respectively.
Footnotes
Conflicts of Interest
The Authors have declared no conflict of interest.
- Received July 18, 2016.
- Revision received August 5, 2016.
- Accepted August 17, 2016.
- Copyright© 2016, International Institute of Anticancer Research (Dr. John G. Delinasios), All rights reserved