


Abstract
This study reports for the first time the microRNA expression profile of human breast cancer MCF-7 cells and the effect of green tea. Although hundreds of miRNAs have been identified in humans, only a small proportion (25.6%) of miRNAs are expressed in MCF-7 cells. Low concentration treatment with Polyphenon-60 significantly alters the miRNA expression profile in MCF-7 cells. Twenty three miRNAs have been identified with differential expression after a 48 h treatment with 10 μg/ml Polyphenon-60 (green tea extract). These miRNAs include miR-21 and miR-27 that were found to be down-regulated following treatment with green tea. These two miRNAs have previously been identified as being overexpressed in MCF-7 breast cancer cells, with miR-21 specifically implicated in down-regulating the tumor suppressor gene, tropomyosin-1. This data supports the hypothesis that Polyphenon-60-induced modification of the breast cancer miRNA expression profile contributes to the efficacy of green tea treatment. The resulting decrease in carcinogenesis is further supported by the altered miRNA regulation of potential oncogenes and tumor-suppressor genes.
Breast cancer is the second leading cause of female death in America (1). Breast cancer samples are typically classified as positive or negative for the expression of specific proteins including estrogen receptor (ER), progesterone receptor (PR), vascular endothelial growth factor receptor (VEGFR) and human epidermal growth factor receptor 2 (HER2/neu). Gene amplification or reduction of these receptors significantly alters the biological characteristics of the breast cancer cells and modifies the therapeutic agents that can be used in their treatment. Estrogen receptors are found in approximately 65% of breast cancer cases (2). Receptor association with estradiol stimulates cell growth and up-regulates epidermal growth factor receptors such as HER2/neu (2). It has been experimentally shown that ER-positive tumors express the oncogene BCL2, whereas ER-negative tumors do not (3). BCL2 is an anti-apoptotic protein that has been shown to assist in tumor cell resistance to chemotherapeutic agents. Treatment of ER-positive breast cancers involves endocrine agents such as tamoxifen, a receptor antagonist for the ER receptor, and accompanies a better long-term prognosis than ER-negative patients (4).
A similar situation involves the human epidermal growth factor receptor 2 (HER2/neu). HER2/neu is a receptor tyrosine kinase that has been shown to be over-expressed in invasive breast carcinoma (5). Overexpression of the HER2 gene has been experimentally shown to be associated with shorter disease-free survival, increased tumor size, advanced tumor growth and development of drug resistance (6). One therapeutic drug that has been designed to target HER2/neu expression is trastuzumab, marketed as Herceptin, which is a monoclonal antibody that targets the extracellular domain of the HER2/neu receptor. Herceptin is able to block cell proliferation and induce cellular toxicity, leading to apoptosis (7).
Analysis of protein markers such as HER2/neu and ER assists in predicting clinical response to therapy, invasiveness and malignancy in breast cancer patients. Several genes are also investigated in a similar matter, specifically up-regulated oncogenes such as RAS, C-MYC, and BCL2, and down-regulation of tumor suppressor genes like BRCA1, BRCA2, p53, and PTEN. The BRCA genes are involved in repairing DNA damage and inherited mutations in BRCA1/BRCA2 have been linked to a significantly higher risk of developing breast cancer (8). The oncogenes implicated in breast cancer are also associated with a wide variety of other cancer types, based on their involvement in stimulating cell cycle progression and cell proliferation. Therapies that can target overexpressed oncogenes are critical for patients that lack the cell surface targets like estrogen or epidermal growth factor receptors. However, very few targeted chemothera-peutics currently exist. When receptor antagonists or antibodies cannot be used, therapies are used that function by eliminating rapidly dividing cells nonspecifically. A commonly used chemotherapeutic, Paclitaxel (Taxol) stabilizes microtubule formation and inhibits their disassembly, directly inhibiting cell division (9). Other chemotherapies use similar methods to disrupt cell proliferation. Further investigation into intracellular targets and non-chemical treatments must be performed to improve the cellular specificity and effectiveness of cancer therapies.

miRNA expression profile in human breast cancer cell line MCF-7. A total of 871 human miRNAs present in Sanger miRBase Release 13.0 was analyzed by microRNA microarray. A: The expression profile of 871 miRNAs in MCF-7. The image was displayed in pseudo colors so as to expand visual dynamic range, in which, as signal intensity increases from 1 to 57600 the corresponding color changes from blue to green, to yellow, and to red. B: miRNA distribution based on their signal intensity in microarray analysis. The stronger the signal, the higher expression a specific miRNAs. The expression level is significantly different among the 871 analyzed microRNAs.
MicroRNAs (miRNAs) are small endogenous non-coding single-stranded RNA molecules which, in animals, typically bind to the 3' untranslated region (UTR) of specific messenger RNA (mRNA) transcripts. Binding of a miRNA to a target mRNA results in either degradation of the transcript or inhibition of translation, both of which result in a decrease in gene expression. The regulatory mechanism of degradation versus translational interference depends on the complementarity of the miRNA sequence to the 3' UTR target region of the transcript. A near-perfect match typically promotes mRNA cleavage, whereas imperfect binding causes interference of the translational machinery without transcript degradation. It has been predicted that the human genome encodes thousands of these miRNA genes, each with the potential for binding several target mRNA transcripts (10). This target multiplicity further amplifies the potential regulatory presence of miRNAs in developmental and disease processes.
Microarray miRNA expression for MCF-7 breast cancer cells.
Depending on the identity of the target that is regulated, miRNAs may act with oncogenic and tumor suppressor capabilities (11). One example present in breast cancer is miR-21, which is identified as an oncomir due to its ability to down-regulate a variety of tumor suppressor proteins. Among the targets of miR-21 are BCL2, PTEN and tropomyosin 1, which are proteins that are implicated in proper cell cycle progression and regulation of apoptosis (12, 13). It has also been shown that specific cancer types express particular miRNA expression profiles. The tumor specific patterns of miRNA expression give very useful diagnostic information in determining how various chemicals are effective in the treatment or prevention of cancer.
For years, green tea consumption has been linked to a decreased incidence of breast cancer. Several studies point to polyphenols, such as epigallocatechin gallate (EGCG), as the molecular components behind the anti-carcinogenic effects of green tea. Such studies indicate that polyphenols induce apoptosis, cell cycle arrest, inhibition of angiogenesis, and down-regulation of telomerase expression (14). Green tea has also been found to possess antihypotensive, antihepatotoxic, and antimutagenic properties (15). Although broad cellular impact has been investigated, the molecular mechanisms behind such effects remain unclear. The current study demonstrates that aberration of specific cancer related miRNAs may be the cause for the beneficial properties of green tea polyphenols on breast cancer.
Materials and Methods
Cell lines. The human MCF-7 breast adenocarcinoma cell line was obtained from the American Type Culture Collection (ATCC, Rockville, MD, USA). The cells were grown in RPMI 1640 media supplemented with 10% Fetal Bovine Serum, 0.1% gentamycin, and 0.1% bovine insulin (Gibco, Grand Island, NY, USA) and sterilized using a 0.22 μm polyethersulfone filter (Corning Inc., Corning, NY, USA). Cells were grown at 37°C in a 5% CO2 humidified incubator.
Preparation of Polyphenon-60 treatment. Polyphenon-60 was purchased from Sigma (St. Louis, MO, USA) and dissolved in supplemented RPMI-1640 media prior to each cell treatment. The Polyphenon-60 solution was sterilized using a 0.22 μm polyethersulfone filter. Appropriate dilutions were made from an initial stock concentration of 1000 μg/ml.
Cell treatment. Cells were plated in 12-well plates at a seeding density of 10,000 cells/cm2 to a total volume of 1 ml per well. Treatments were made from dilutions of a 1000 mg/l stock made fresh prior to each treatment. The stock was filtered through a 0.22 μm polyethersulfone filter prior to additional dilution. After seeding for 24 h, cells were drained of media and treated with 1 ml of RPMI 1640 media with various Polyphenon-60 concentrations. After 48 h of incubation, the cells were detached and counted using trypan blue dye-exclusion. Dose response was verified using 3-(4,5-Dimethylthiazol-2-yl)-2,5-diphenyltetrazolium bromide (MTT) analysis. The dose response curve of Polyphenon-60 was generated and the inhibitory concentrations (ICx) were calculated. Each treatment was repeated six times.

miRNA microarray signal distribution between control and Polyphenon-60 treatment MCF-7 cells.
Total RNA isolation. Total RNA was extracted from MCF-7 cells treated with 0 (control) and 10 μg/ml of Polyphenon-60 using the mirVana™ miRNA Isolation Kit (Applied Biosystems, Foster City, CA, USA) according to manufacturer's instructions. Briefly, approximately 106-107 cells were collected from each of six biological replicate treatments and pelleted by centrifuging at 1000 rpm. The pellet was resuspended in 1 ml of phosphate-buffered saline (PBS) and repelleted at 1000 rpm. The cells were then placed on ice. The excess PBS was then drained and 500 μl of Lysis/Binding Solution was added and vortexed with the cells at 1000 rpm. Fifty μl of miRNA Homogenate Additive was added to the cells and mixed by vortexing. The mixture was then placed on ice for 10 min, 500 μl of acid-phenol:chloroform was added and the cells were vortexed for 60 s. The cells were centrifuged for 5 min at maximum speed. The aqueous phase was removed and transferred to a new tube and its volume was recorded. 1.25 times the aqueous phase volume of room temperature 100% ethanol was added to the aqueous phase and mixed. Each sample was transferred to its own filter cartridge collection tube and centrifuged for 15 sec at 10,000 rpm. The flow-through was discarded and the sample was centrifuged until all of the lysate/ethanol mixture had passed through the filter. miRNA Wash Solution 1 (700 μl) was then added to the filter cartridge and centrifuged for 10 s and the flow-through was discarded. Wash Solution 2/3 (500 μl) was then added and centrifuged through the filter as previously performed. This was completed twice, with each flow-through discarded. The cartridge filter was centrifuged a final time for 1 min at 10,000 rpm. The total RNA was eluted from the cartridge using 100 μl of 95°C pre-heated nuclease-free water. The quality and quantity of total RNA was measured using a NanoDrop 1000 (NanoDrop Technologies, Wilmington, DE, USA).

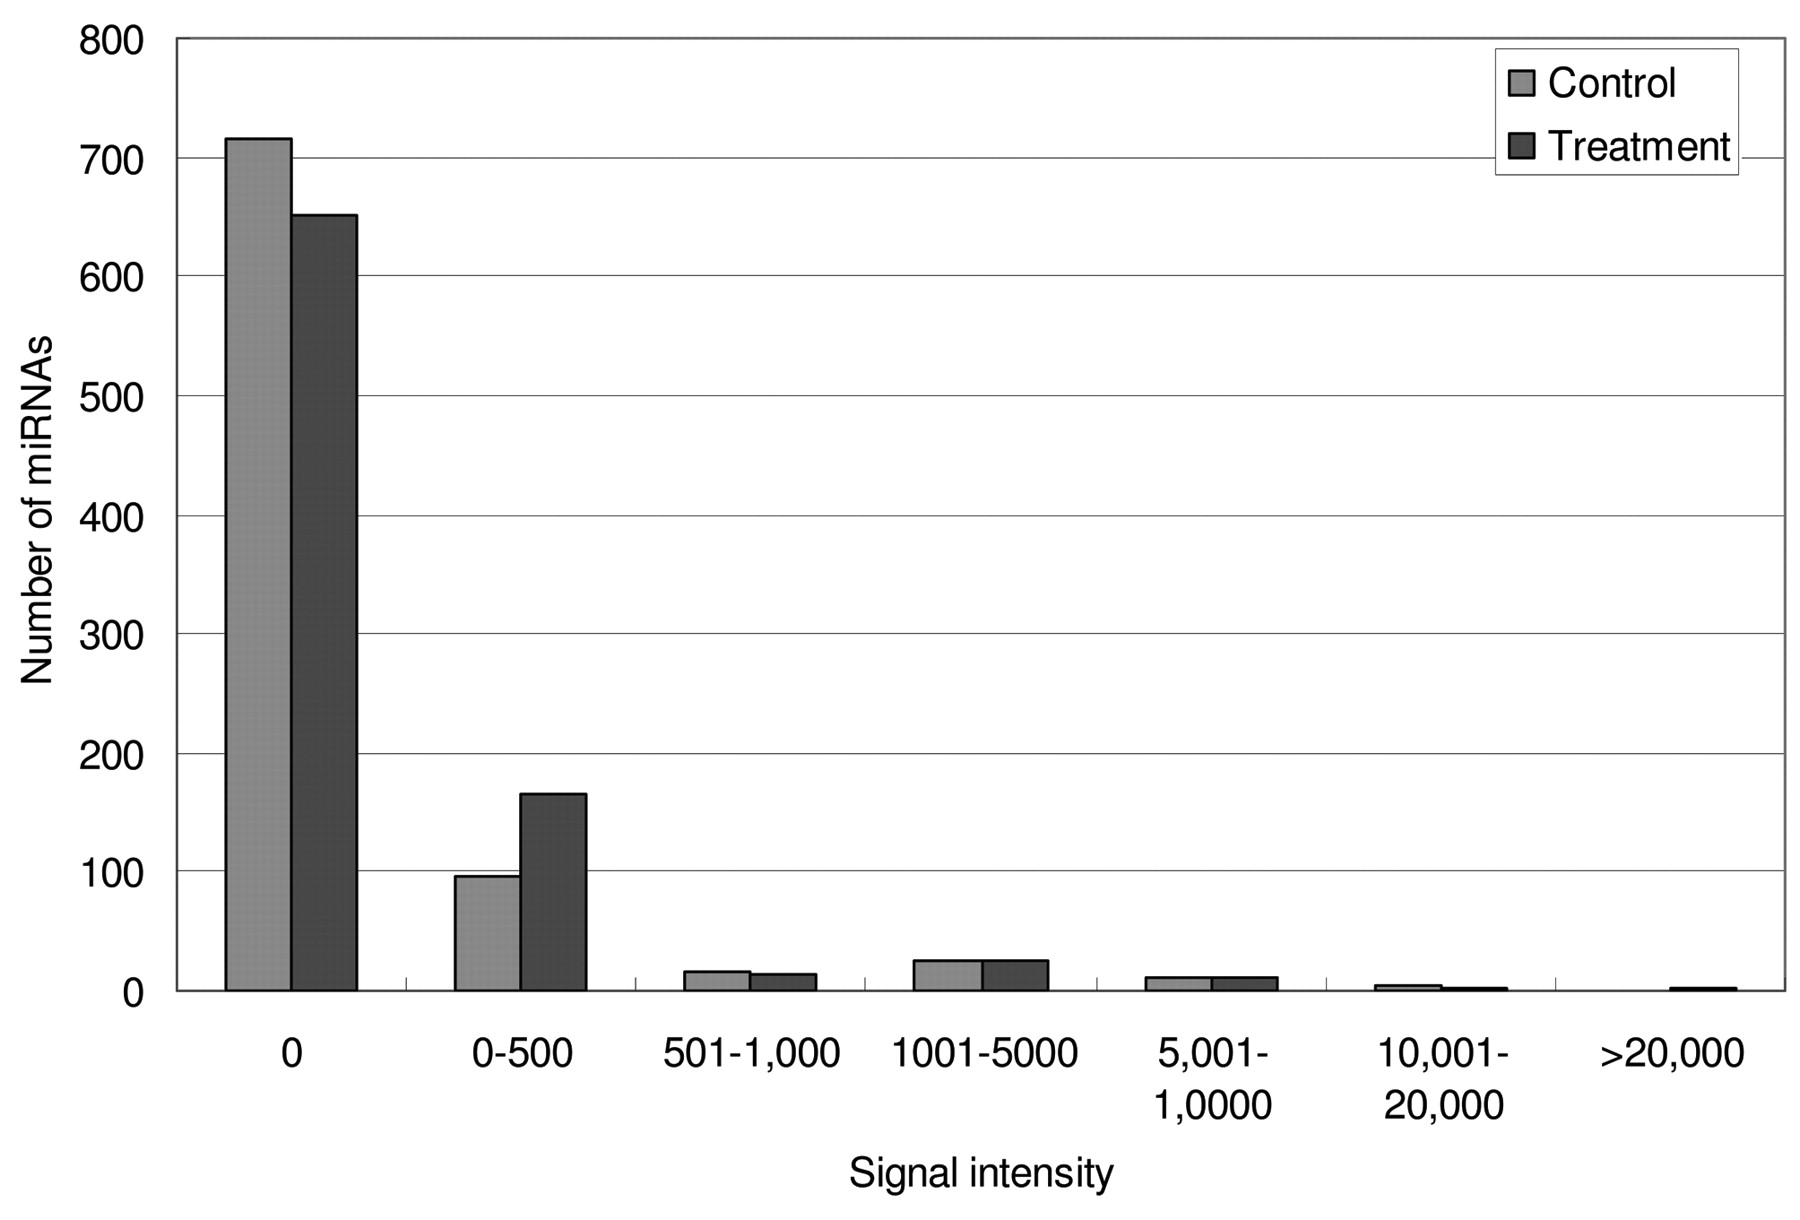
miRNA microarray signal intensity distribution for control and 10 μg/ml Polyphenon-60 treated MCF-7 cells.
miRNA microarray and data analysis. miRNA microarray analysis was performed by LC Sciences (Houston, TX, USA) using a μParaFlo® microfluidics chip, analyzing the expression of the 871 human miRNAs (and functional miRNA*s) present in Sanger miRBase Release 13.0. Briefly, approximately 10 μg each RNA sample was size fractionated and small RNA sequences were length-extended with the addition of a Poly(A) tail. Control and treatment samples were loaded on the μParaFlo® microfluidics chip containing 871 miRNA detection probes and 50 positive and negative control probes. All probes contained a nucleotide sequence complementary to the detected miRNA and a polyethylene glycol spacer sequence to extend the detection probe away from the substrate. Following RNA hybridization, control samples were labeled with Cy3 fluorescent dye and treatment samples were labeled with Cy5 fluorescent dye. All detection probes were performed in 4 replicates and the control probes were performed anywhere from 4 to 16 times.
The miRNA microarray data was processed by subtracting the background signal from the samples and normalizing based on cyclic locally weighted regression (LOWESS), as previously described (16). Detectable miRNAs possessed a signal intensity greater than three times the background standard deviation with a product of the standard deviation and signal intensity less than 0.5. For replicate probes, detectable signal had to be present in at least 50% of the samples for miRNAs to be considered `detectable'. miRNAs that are reported as differentially expressed possessed a p-value less than 0.01 (Student's t-test). Background subtraction, Cy3/Cy5 normalization, directivity determination and p-value calculation was determined by LC Sciences in-house developed computer programs. Cluster Plots were created using TIGR MeV software from The Institute of Genomic Research.
RT-PCR and qRT-PCR. miRNAs with differential expression patterns in microarray analysis were selected and then validated using qRT-PCR on an Applied Biosystems 7300 system (Applied Biosystems, Foster City, CA, USA). Applied Biosystems TaqMan microRNA assays were employed to detect and quantify miRNAs in human breast cancer cells exposed to 0 (control) and 10 μg/ml of Polyphenon-60 according to the manufacturer's instructions. This reaction included two steps: reverse transcription and real time PCR (17). Briefly, a mature miRNA was first reverse-transcribed to a longer single-stranded cDNA sequence from 500 ng of the total RNA sample using the Applied Biosystems TaqMan microRNA Reverse Transcription Kit and a miRNA-specific stem-looped RT primer. Reverse transcription was reacted in 15 μl of solution that contained 500 ng of total RNAs, 1 mM each of dNTPs, 1 μl of MultiScribe Reverse Transcriptase (50 U/μl), 1.5 μl 10× RT Buffer, 0.188 μl RNase Inhibitor, and 3 μl 5× Taqman microRNA RT primer for a specific miRNA. The RT reaction was performed with a Eppendorf Mastercycler Personal PCR (Westbury, NY, USA) with the following temperature program: initial 16°C for 30 min followed by 42°C for 30 min; then, the reaction was held for 5 min at 85°C; and finally held at 4°C until next analysis or stored at –20°C.
Validated targets for most abundant miRNA in human breast cancer cell MCF-7.
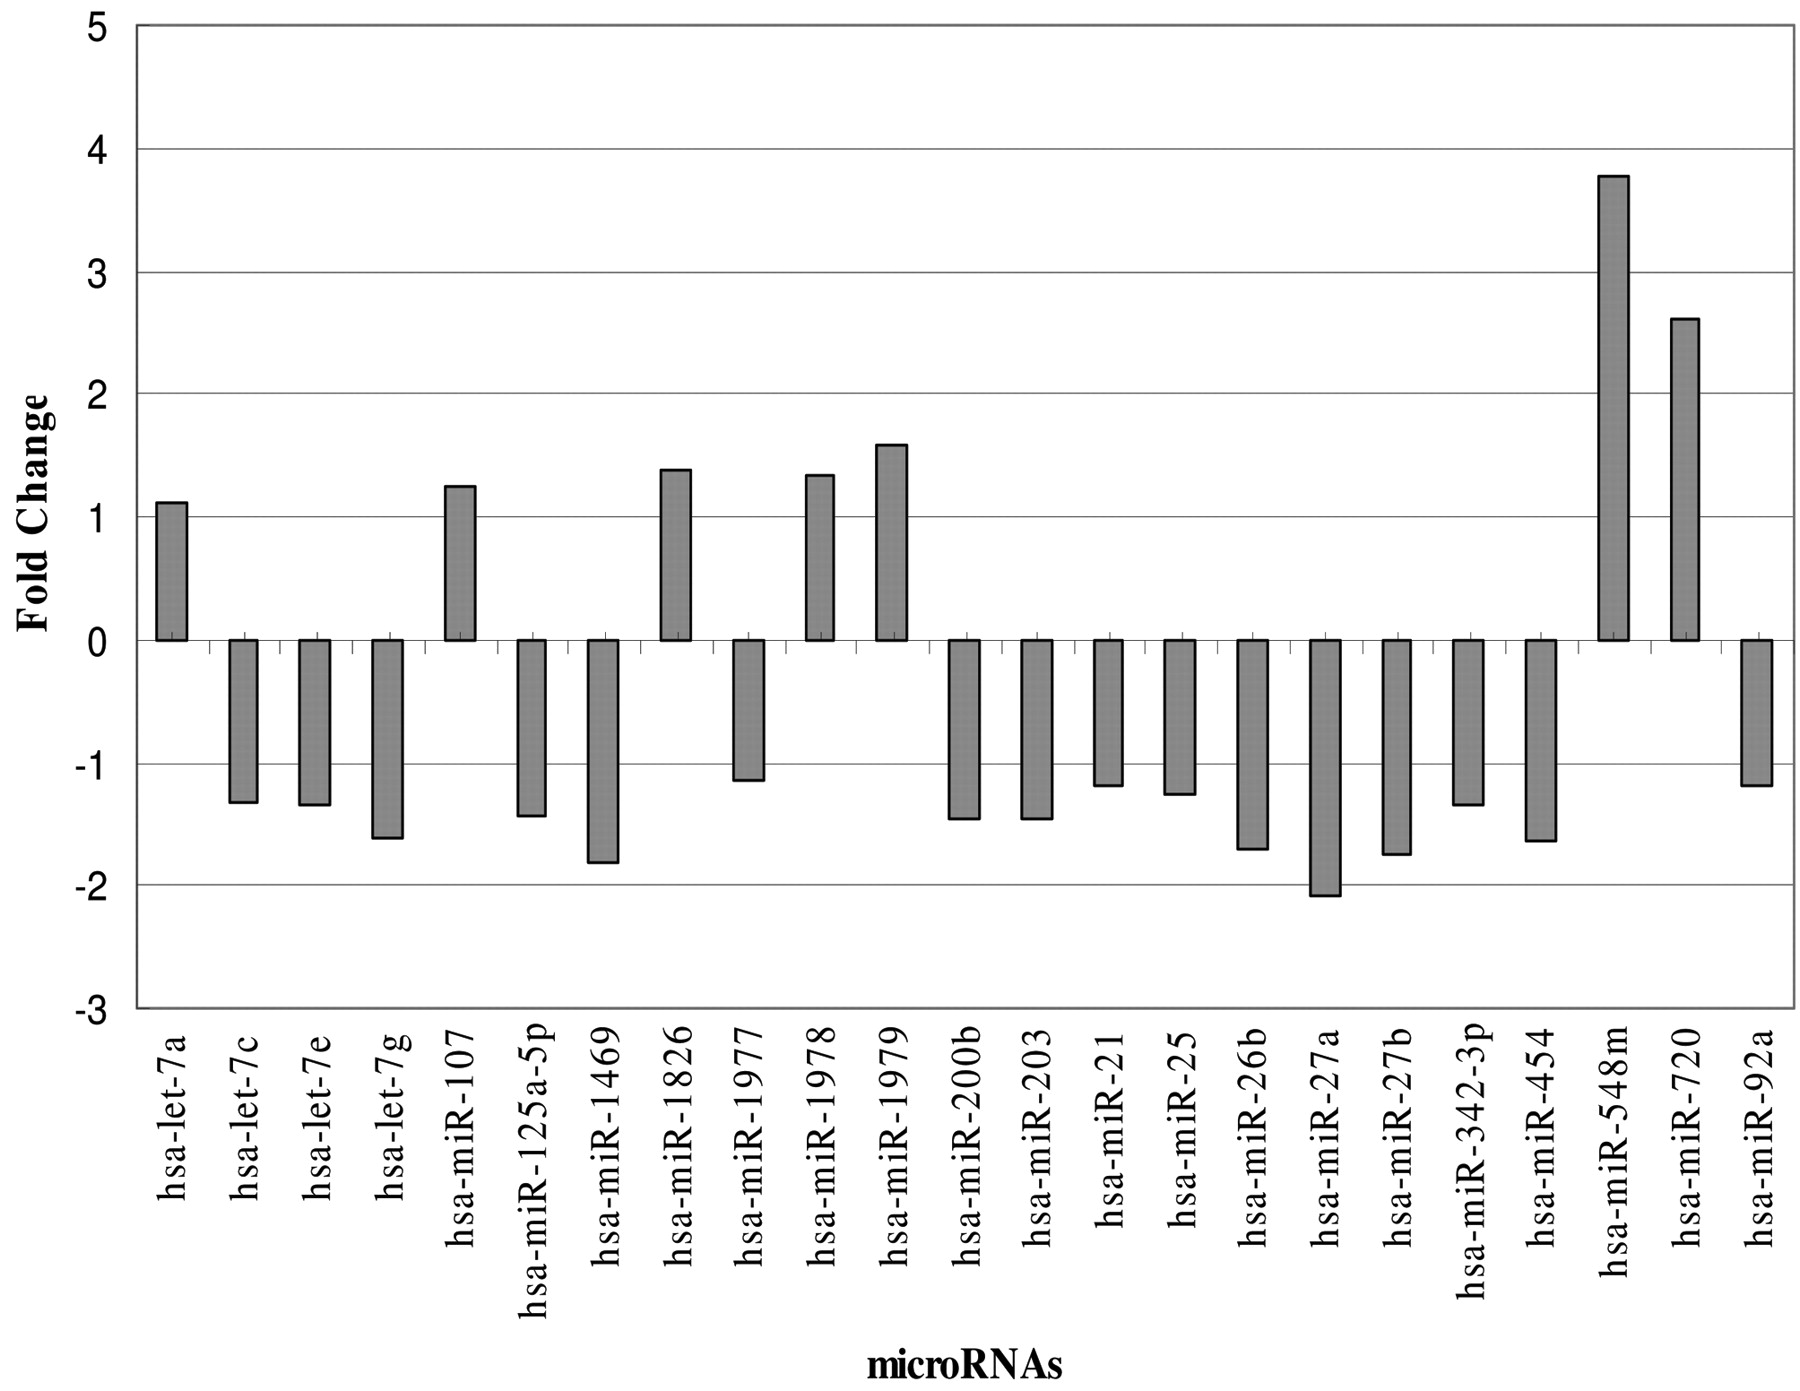
Comparison of miRNA expression profiles of MCF-7 cells treated with or without 10 μg/ml Polyphenon-60 green tea extract.
Quantitative real-time PCR (qRT-PCR) was performed with miRNA-specific primers provided by the Applied Biosystems Taqman MicroRNA Assay kit. Each reaction was performed in 20 μl of solution that contained 2 μl RT PCR product (10-fold dilution from RT PCR reaction), 10 μl of Taqman 2× Universal PCR Master Mix (No AmpErase UNG), and 1 μl of Taqman MicroRNA Assays 20× Real-Time Primers. Nuclease free water was used to adjust the final volume to 20 μl. The temperature program for qRT-PCR reactions was 95°C for 10 min followed by 45 cycles of 95°C for 15 s (to denature DNA) and 60°C for 60 s (for primer annealing and extending). Each reaction had three replicates. Each treatment had 5 replicates. In qRT-PCR, small RNA RNU48 was employed as an endogenous reference gene for normalizing qRT-PCR results. Relative miRNA expression data were analyzed using the ΔΔCT method (11).
Results
MCF-7 miRNA expression profile. Although the human MCF-7 breast cancer cell line is important for modeling ER-positive breast cancer cells, and several miRNAs have been identified with differential expression in this cell line, the global miRNA expression profile of MCF-7 cells has not previously been documented. After miRNA microarray analysis of a total of 871 human miRNAs deposited in the miRNA database miRBase, it was found that the human MCF-7 breast cancer cell line possesses a unique pattern of miRNA expression (Figure 1A). Of the 871 human miRNAs, 25.6% (223) miRNAs were detected and a majority of miRNAs (74.4% or 648) were not detected in MCF-7 cells (Figure 1B and Table 1). This result suggests that only a small part of the miRNA population is expressed in human MCF-7 breast cancer cells. Increasing evidence demonstrates that many miRNAs are expressed in a species- or tissue-specific manner and only a small proportion of miRNAs are expressed in a specific tissue at a specific time. Our result is consistent with this conclusion.
Not only is there a small number of miRNAs (223 miRNAs) expressed in MCF-7 cells, but their expression profile and abundance were significantly different among the detected miRNAs (Figure 1 and Table I). Based on their signal intensity during microarray analysis, the signal intensities varied widely with a range of 24 to 57600. This suggests that the expression level of miRNAs vary within the sample (Figure 1 and Table I). Some miRNAs are expressed in many copies while others are only expressed with a few copies in MCF-7 cells. Among the 223 detected miRNAs, the expression levels were very low with weak signal intensity of less than 500 for a majority of miRNAs (148 or 66.37%). However, 11 miRNAs were highly expressed in the human MCF-7 breast cancer cell line with signal intensities greater than 10,000; these 11 miRNAs were miR-21, let-7f, let-7a, miR-1826, let-7d, miR-1979, miR-200c, let-7c, miR-191, miR-342-3p, and miR-26a. Among all 871 analyzed miRNAs, miR-21 had the highest expression with a signal intensity of 57,600. miR-21 was followed in intensity by let-7f and let-7a, which were expressed with intensities of 21,201 and 20,206, respectively.
Polyphenon-60 induces differential miRNA expression. To investigate the effect of Polyphenon-60 on the global miRNA expression profile of human MCF-7 breast cancer cells, a dose-response study was performed to investigate the effect of Polyphenon-60 on MCF-7 cell growth. The results demonstrated that Polyphenon-60 significantly inhibited human breast cancer MCF-7 cell growth (data not shown). The IC50 concentration of 10 μg/ml was chosen to investigate the effect of Polyphenon-60 on the global miRNA expression profile in human MCF-7 breast cancer cells.
miRNAs shown to be differentially expressed between control and Polyphenon-60 treated MCF-7 cells.
The miRNA expression pattern of MCF-7 breast cancer cells was distinctly different between non-treatment and treatment with 10 μg/ml Polyphenon 60 green tea extract for 48 h (Figures 2 and 3). First, Polyphenon-60 treatment induced more miRNA expression in the human MCF-7 breast cancer cell line. Of the 871 investigated human miRNAs, 221 miRNAs were detected in MCF-7 cells exposed to 10 μg/ml Polyphenon-60 for 48 hours whereas only 155 miRNAs were detected in the corresponding untreated control samples (Figures 2 and 3). Although there were fewer miRNAs expressed in untreated samples, not all of the miRNAs expressed in the control sample were expressed in the Polyphenon-60-treated sample. There were 7 miRNAs (miR-30b*, miR-29a, miR-221, miR-936, miR-1249, miR-200a, and miR-424) detected in untreated MCF-7 cells but not detected in cells exposed to Polyphenon-60. In contrast, there were 73 miRNAs detected in treated samples but not in control samples. However, these differentially expressed miRNAs for the most part were expressed in a low level and the signal intensity ranged between 0 to 500.
The fold change for each miRNA varied in MCF-7 breast cancer cells following Polyphenon-60 (Table IV and Figure 4). With a low Polyphenon-60 concentration treatment, the miRNA fold change ranged from 2.14-fold down-regulation to 3.80-fold up-regulation. The three most up-regulated miRNAs were miR-548m, miR-720 and miR-1979 and these three miRNAs had at least 3-fold changes in expression after Polyphenon-60 treatment. Based on the microarray data, the signal intensity of miR-1826 was 16833 for control and 23230 for 10 μg/ml Polyphenon-60 treatment. Although miR-1826 had 1.38-fold change, its expression level was dramatically increased after Polyphenon-60 treatment because of the high expression level of this miRNA.
Validation of miRNA expression using qRT-PCR. Verification of the miRNA microarray data was performed for the top two up-regulated miRNAs (miR-548m and miR-720) and the most down-regulated miRNA (miR-27a). The qRT-PCR analyzed fold-changes for these three miRNAs validated the fold-changes calculated from the microarray signal data. miR-548m was shown to have a 3.8-fold increase based on the microarray data, and a 2.18-fold increase based on the qRT-PCR data. The microarray data for miR-720 gave a 2.59-fold increase, and the qRT-PCR data gave a 2.25-fold increase. miR-27a had a 2.14 fold decrease in the microarray data and a 1 fold change in the qRT-PCR data. This reduction in fold values was believed to originate from the 6 month storage of the RNA samples at –80°C. The overall trend of this data confirms that the values provided by the miRNA microarray data seem to be accurate for the sample and can be extrapolated to include the remaining miRNAs identified by the microarray as being aberrantly expressed.
Discussion
MCF-7 specific miRNA expression. Although hundreds of miRNA genes have been identified in the human genome, only a few have been reported in breast cancer cells. It is important to investigate the global expression profile of all miRNAs and their abundance in breast cancer. Based on the current microarray analysis, 223 miRNAs are expressed in human MCF-7 breast cancer cells with different abundance for each miRNA. A majority of these miRNAs have not been reported or investigated in breast cancer cells. Expression of one gene is always associated with its function. Investigating miRNA expression and factors affected by those miRNAs facilitates the elucidation of the function of miRNAs in breast cancer pathogenesis and treatment. Table II lists the validated targets for the 11 most abundant miRNAs in MCF-7 cells. This list clearly shows that a majority of the previously confirmed targets are involved in DNA binding, and several are known transcription factors. One potential target of miR-21 is the tumor suppressor PTEN, which is consistent with the conceptual understanding of miR-21 reducing the expression of PTEN in MCF-7 breast cancer cells. However, let-7a is also highly expressed in MCF-7 cells and has two oncogenes as potential targets; KRAS and NRAS. The expression of these two oncogenes is decreased in MCF-7 cells, and may contribute to the early-stage, moderately aggressive characteristics of this cell line.
miRNA response to Polyphenon 60 treatment. Polyphenon-60 treatment not only altered the total number of miRNAs expressed in MCF-7 cells but also altered the expression level for miRNAs expressed in treated MCF-7 cells. Based on the miRNA microarray analysis, there were 23 miRNAs identified with differential expression after 48 h of treatment with 10 μg/ml Polyphenon-60 (Table III). Of the 23 miRNAs with differential expression, seven were shown to be up-regulated after Polyphenon-60 treatment for 48 h (let-7a, miR-107, miR-548m, miR-720, miR-1826, miR-1978, and miR-1979). In contrast, sixteen miRNAs were shown to be down-regulated after Polyphenon-60 treatment for 48 h and these 16 miRNAs were let-7c, let-7e, let-7g, miR-21, miR-25, miR-26b, miR-27a, miR-27b, miR-92a, miR-125a-5p, miR-200b, miR-203, miR-342-3p, miR-454, miR-1469, and miR-1977. With the exception of miRNAs let-7a and miR-107, no function has been attributed to the remaining five up-regulated miRNAs. In particular, miR-1826, miR-1978 and miR-1979 were recently identified new miRNAs.
Twenty-three miRNAs with significant changes in expression levels in MCF-7 cells following exposure to 10 ppm green tea Polyphenon-60 treatment for 48 hours (p<0.01).
miRNAs responding to drug treatment. Several recent investigations have demonstrated that various compounds induce differential expression of miRNAs in a variety of animals and also in animal cell lines (18-24). These chemicals include anticancer drugs as well as environmental toxicants. However, no study has been reported on the effect of natural products on miRNA expression in any organism in vivo or in vitro. This study reports for the first time, the global expression profile of miRNAs in human MCF-7 breast cancer cells and the effect on the miRNA expression profile after 48 hours of treatment with a moderate dose of Polyphenon-60 green tea extract (10 μg/ml). Based on microarray analysis with 871 currently known human miRNAs, 23 miRNAs were identified as having differential expression after Polyphenon-60 treatment. Although some of the differentially expressed miRNAs, such as miRNA let-7, have been reported previously to have differential expression in response to chemical treatment in human cell lines or model animals, a majority of the Polyphenon-60-regulated miRNAs have not been reported in previous studies. Therefore, it seems that these miRNAs uniquely respond to Polyphenon-60 treatment. Investigating the molecular regulatory mechanism of the common and drug-specific miRNAs will allow a better understanding of the mechanism of action for different drugs as well as provide new insight on screening new drugs for cancer treatment.
Documentation of miRNAs in cancers identified by microarray analysis.
Three most Polyphenon 60-regulated miRNAs and their related cancers and verifed targets.
Polyphenon-60-regulated miRNAs are involved in cancer pathogenesis. The majority of miRNAs regulated by Polyphenon-60 treatment were associated with the pathogenesis and development of cancers, including human breast cancers. Literature analysis of the 23 differentially expressed miRNAs from the microarray data yielded information connecting most of the miRNAs to human cancers (Tables V and VI). miR-548m was the most up-regulated miRNA in the MCF-7 cells treated with Polyphenon-60. Overexpression of this miRNA has been previously observed in colorectal cancer samples (25). Four of the other up-regulated miRNAs were current additions to the miRNA database without further information on the function of these miRNAs. miR-107, which showed a 1.24-fold increase in expression upon Polyphenon-60 treatment, has been linked to potentiating the disease states of Alzheimer's disease, and some pancreatic cancers (26, 27). By contrast, a decrease in miR-107 has been identified in numerous diseases such as head, neck and oral cancer as well as HNF1α-positive hepatocellular tumors (28, 29). As Polyphenon-60 treatment caused an increase in miR-107, there is a potential that it could be used in the treatment of these miR-107 deficient diseases. Another up-regulated miRNA in treated MCF-7 cells was let-7a, which is a known tumor suppressor miRNA and has been shown to be down-regulated in both lung and breast cancer (30, 31). Let-7a was one of the most highly expressed miRNAs in the MCF-7 expression profile data, showing that green tea Polyphenon-60 treatment caused a significant increase in let-7a expression even at existing high expression levels in untreated cells.
Among the miRNAs down-regulated by Polyphenon 60 treatment, miR-27a was the most dramatic. Breast cancer and gastric cancer have been reported to reveal increased amounts of miR-27a (32, 33). The ability of Polyphenon-60 to reverse miR-27a expression further supports the potential for therapeutic administration of green tea. miR-27b, which was one of the most down-regulated miRNAs has previously been found at very low expression levels in colorectal cancer and reinforcement of the aberrant miR-27b expression may raise concerns when using green tea for treatment purposes (34). Similar concern could be raised about the let-7 family members, let-7c, let-7e, and let-7g that were -regulated upon treatment. These miRNAs are normally down-regulated in breast cancer cells (31). The let-7 family is also down-regulated in lung cancer (30, 35, 36). However, studies seem to show that let-7a is the specific miRNA that is most abundantly expressed in samples, and fluctuation in the other various let-7 variants may be less consequential than data seems to indicate.
Among the down-regulated miRNAs, miR-26b seems to be highly up-regulated in bladder cancer, showing a marked decrease in expression with increasing diagnostic tumor-node-metastasis staging (37). A correlation between schizophrenia and decreased expression of miR-26b was also reported (38). In this respect, further investigations into the potential decrease in expression due to green tea polyphenol treatment in these two diseases might provide interesting results. miR-200b was also shown to have decreased expression following Polyphenon-60 treatment. Overexpression of miR-200b has previously been identified in cholangiocarcinoma and ovarian cancer (39, 40). The murine homologue of miR-200b, along with miR-203 and miR-342-3p, have been shown to be overexpressed in mice infected with scrapie, a prion disease similar to Creutzfeldt-Jakob disease in humans (41). Overexpression of miR-203 was also observed in colorectal and pancreatic cancer and psoriatic plaques (42, 43, 44). In addition to the scrapie model, miR-342-3p is also overexpressed in multiple myeloma (45).
Of the remaining polyphenol-induced down-regulated miRNAs, miR-25 is increased in gastric cancers and multiple myeloma but decreased in colorectal cancer and glioma (34, 46, 47 48). miR-92a is increased in hepatocellular carcinoma and medulloblastoma (49, 50). miR-21, which is commonly implicated in disease states, is up-regulated in breast, pancreatic and cervical cancers, as well as glioblastoma, head neck and oral cancer, cholangiocarcinoma and dermatological disorders such as psoriasis and atopic eczema, just to name a few (13, 42, 51-55). All miRNAs over-expressed in these diseases and disorders were down-regulated in MCF-7 cells by Polyphenon 60 treatment. Whether green tea also exerts potential benefits in the mentioned diseases deserves further investigation.
The National Cancer Institute estimated that during the 2009 calendar year, 192,370 women in the United States were diagnosed with breast cancer, and 40,170 women died from the disease. In Western countries, breast cancer is the most common form of cancer and the second leading cause of female cancer death in America. In Eastern countries, such as Japan and China, the incidence and aggressiveness of breast cancer is much lower. In 1998, it was estimated that 1 in 10 women in the United States would develop breast cancer during their lifetimes, but only 1 in 40 women in Japan would develop the disease (56). Numerous epidemiological studies have been performed in an attempt to discover what may be the cause of this unequal distribution. Several lifestyle differences have been identified as potential causes for this phenomenon, in particular, the consumption of green tea. It has been estimated that 98% of the Japanese population drinks green tea regularly (14). Green tea is known to be high in anti-oxidants and other pharmacologically active substances commonly used in homeopathic or alternative medicine. On average, polyphenols have been attributed with most of the anti-cancer abilities that are credited to green tea, but the cellular mechanisms behind why these compounds are so beneficial have yet to be determined.
As developments are made in the field of miRNA research and profiling, an increasing number of large scale molecular effects are being attributed to miRNA regulation. miRNAs have already been shown to act as tumor suppressors by negatively regulating gene expression of oncogenic factors. Alternatively, miRNAs which down-regulate expression of tumor suppressor genes have been named oncomirs, and have been identified in a variety of cancer types (11). Through analysis of miRNA expression, it can be seen that gene regulation is a highly sensitive procedure and the slightest change in the expression of these small non-coding RNAs can disrupt critical cellular functioning.
Green tea has been shown to decrease breast cancer cell estrogen receptor expression, increase cell sensitivity to specific chemotherapies and initiate natural cell death (57). The miRNAs that are affected by green tea will most likely be directly involved in these various cellular processes. Both estrogen receptor down-regulation and chemotherapy sensitization have obvious merit, as most cancer patients will develop resistance to at least one therapeutic drug during their course of treatment. The ability to initiate apoptosis in cancer cells with green tea leads to many questions regarding cellular mechanism. Green tea, on its own, is safe to healthy human cells even at high concentrations. Therefore, green tea must be interacting with a specific cellular component that is differentially expressed or up-regulated in cancer cells. If the cytotoxic effect of green tea can be linked to a specific miRNA, it is conceivable that treatments targeting the overexpressed miRNA can be developed. It has already been shown that transfection of cancer cells in culture with specific over-expressing miRNA plasmids can cause specific cellular responses without the widespread systemic effects caused by chemotherapy. The potential impact of these miRNA-specific therapies makes miRNA research applicable to a wide variety of medical fields, not limited to cancer research. As more data becomes available, and new procedures and techniques are developed, miRNAs should lead to new and exciting advances in diagnostic medicine and disease treatment.
Acknowledgments
This work was partially supported by ECU New Faculty Research Startup Funds Program and ECU Research/Creative Activity Grant (BZ). This work was also partially supported by Sigma XI Grant-in Aid of Research Program (LF).
- Received June 14, 2010.
- Revision received July 13, 2010.
- Accepted July 15, 2010.
- Copyright© 2010 International Institute of Anticancer Research (Dr. John G. Delinassios), All rights reserved


