


Abstract
Large cohorts of archival samples are stored in tissue banks worldwide yet their contribution to biomarker discovery is limited. Proteomic profiling technologies have potential for early screening and diagnosis of cancer, and data from such samples can be the answer for many clinical questions. Here we introduce the notion of archival samples proteomics. Using SELDI-TOF MS analysis, we compared 30-year-old archival serum samples of healthy volunteers and patients diagnosed with non metastatic breast cancer. To validate the reproducibility of our results, analysis of the same samples was repeated in a different centre under standardised settings. Plausible differentially expressed protein peaks between the breast cancer and control groups were repeatedly detected. Our pilot study showed highly reproducible and concordant results between two independent analyses conducted in different centres. The feasibility and reliability of profiling serum archives of women with breast cancer was tested in this pilot study. Our results imply that proteomic profiling of serum may have an important role in biomarkers discovery regardless of the storage period. Clearly, multicentre validation of larger archival cohorts is vital.
Abbreviations: CV: Coefficient of variation; HRT: hormone replacement therapy; QC: quality control; SPA: sinapinic acid.
Breast cancer is the most commonly diagnosed malignancy in women (1). Whilst in the United Kingdom 5-year survival for excellent and good prognostic groups is the same as in the general population (2), the outlook is worse for the poorer prognostic groups regardless of advances in treatment (3, 4). Early detection and intervention are critical factors affecting survival and overall outcome (5, 6). Despite improvements in screening and diagnosis, less than two thirds of breast cancers are localised at the time of diagnosis (7). Mammography is currently the most effective screening tool for breast cancer, however, limitations are documented (8). Moreover, fast growing tumours showing higher rates among younger women is a further limitation of conventional screening (9, 10). The developments of novel presymptomatic screening approaches therefore play an important role in breast cancer screening and diagnosis, and have the potential to reduce disease related mortality.
Proteomic profiling is a rapidly evolving strategy for biomarker discovery. Several advanced proteomic profiling techniques have shown utility for identifying biomarkers for the diagnosis of several tumour types including breast cancer (11-19). Using SELDI-TOF MS with its high throughput and automated capabilities can effectively resolve low mass proteins using minimal amounts of samples. This technology was shown to be reproducible and can be used for building cancer classification algorithms (15, 20-22).
Variations in sample collection, storage, and preparation conditions significantly affect the results obtained from clinical proteomic studies (23). This is a major concern over the use of SELDI-TOF MS and other profiling techniques for identification of cancer biomarkers in archival serum collections. Although such collections have great potential value for identification of presymptomatic and other clinically valuable disease biomarkers, inconsistency of pre analytical conditions limits their utility. Effects of sample handling, storage temperature, collection tubes, coagulation temperature, as well as freeze-thaw cycles on SELDI analysis have all been studied (23, 24). Recently, studies have explored the role of storage conditions and freeze-thaw cycles on the data generated by SELDI-TOF MS (24, 25), yet none have investigated the effectiveness of SELDI-TOF MS in analysing samples stored for decades. Thus far, it is unknown if biomarkers reported in recent standardised studies can be reliably detected and retain predictive power in older tissue and serum banks.
Here we explored the practicality and effectiveness of SELDI-TOF MS profiling on a small cohort of serum samples collected prospectively up to 30 years ago. We compared serum from patients who at the time of collection had non metastatic breast cancer with matched healthy controls. Our aim was to test the hypothesis that protein biomarkers existing in serum can be reliably and repeatedly attainable, and may distinguish cancer from non cancer state, even decades after collection. As a proof of concept, we have demonstrated that historic serum samples can give highly reproducible spectra with acceptable coefficients of variation. To our knowledge this is the first study to address the possibility that archival collections of serum can be used to identify breast cancer from healthy patients in samples which have been stored for up to three decades.
Materials and Methods
Background and ethical approval. The study was based on the Guernsey cohort (26). The Guernsey samples were originally collected between 1977 and 1991 and involved collection of serum and urine samples from women aged 35 years or older who lived on the island of Guernsey (a British Crown dependency in the English Channel off the coast of France). All participants gave voluntary written informed consent for the use of blood samples for research purposes. The samples were collected using a butterfly, two vacutainers of venous blood (from the non-dominant ante-cubital fossa) were taken; 50 ml for sera and blood clot, and 20 ml in an EDTA tube for plasma and cells. The sample was allowed to stand for one hour to allow the blood clot to form and contract. It was then spun at 2000 rpm for 20 minutes. The serum was removed by aspiration and aliquotted into 8×2 ml labelled Sarstedt tubes and stored at -20°C. Fourteen serum samples from the Guernsey breast cancer cohort were randomly selected for our study (27). Seven samples were from women who were healthy at the time of sample collection, and seven were from women who were diagnosed with breast cancer. The mean age of the participants with cancer at the time of sample collection was 59.4 years versus 59.6 years for the non-cancer control group. Although small, the two groups were otherwise well matched for menopausal status and had no family history of breast cancer. Each phase of the study was approved by the Guernsey Research Ethics Committee.
In addition, a pooled serum sample from a recently collected cohort of breast cancer and healthy volunteers obtained from the Wessex region was used for QC assessment. This collection was approved by the Southampton General Hospital NHS Trust Ethics Committee and informed consent was obtained from all participants in the study. Serum samples from this cohort were collected between 2005-2008 from volunteer females covered by the National Breast Cancer Screening Programme (aged between 50-74 years). Samples were collected from volunteers who were recalled for further investigations following routine 3 yearly mammographic screening. Serum samples were prepared after 45 minutes coagulation time, centrifugation at 4000 rpm for 15 minute and stored at -80°C within 90 minutes of collection.
Sample preparation. Serum samples were thawed on ice for 90 minutes prior to use and re-stored at -20°C immediately after use. Samples were subjected to a maximum of 3 freeze-thaw cycles. Strict local handling, storage and analysis protocols were adhered to. The serum volumes used ranged between 100-220 μl, with an average of 120 μl per patient.
Samples were fractionated on an anion exchange resin and then eluted using pH gradient buffers. Weak cation exchange array surfaces were used following optimisation of array surfaces, buffers, and analysis conditions (data not shown). Serum preparation for SELDI-TOF MS was carried out according to the manufacturer's recommendations (Bio-Rad). The process of the preparation and SELDI-TOF MS analysis have been described previously (28). For consistency, a BioMek3000 (Beckman Coulter) liquid handling robot was also used and samples were analysed in duplicate. Arrays were pre-treated with 150 μl (ammonium acetate 50 mM pH 4.0) buffer twice for a total of 10 minutes at room temperature. Duplicates of 10 μl (mixed with 90 μl ammonium acetate 50 mM pH 4.0 buffer to generate 1:10 dilutions) of each serum fraction were then incubated on a weak cation exchange (CM 10) array using 8-well bioprocessors. A pooled serum QC sample made from 10 μl aliquots of all serum samples analysed was included on one spot of all arrays analysed. Samples were incubated for 45 minutes at room temperature on a Micromix5 platform shaker (DPC) using form and amplitude values of 20 and 7, respectively. Following incubation, arrays were washed 3 times for 5 minutes with 150 μl ammonium acetate 50 mM pH 4.0 buffer, rinsed with de-ionised water to remove any unbound proteins or interfering substances (e.g. buffer salts), and allowed to air dry for 45 minutes. Two applications of 1 μl of 50% sinapinic acid (SPA) in 50% acetonitrile (ACN)/0.5% trifluoroacetic acid (TFA) were added to each protein sample on the chip and allowed to air dry for 15 minutes.
SELDI-TOF MS analysis. Serum samples were analysed using the Enterprise 4011 SELDI-TOF MS analysis platform at the Human Genetics Division proteomics laboratory (University of Southampton, UK) and at the Bio-Rad laboratories (Copenhagen, Denmark). Arrays were analysed using ProteinChip Data Manager v 3.0.7 Software. We used a focus mass of 5 kDa, a matrix attenuation at 2.5 kDa looking at a mass range between 0-100 kDa. External calibration of the SELDI-TOF MS was performed using a protein standard calibration kit, comprising recombinant hirudin (6.96 kDa), equine cytochrome C (12.23 kDa), equine myoglobin (16.95 kDa), and carbonic anhydrase (29.0 kDa). Mass accuracy was calculated to be approximately 0.02% of actual mass value. Noise definitions were adjusted to eliminate the chemical noise from the energy absorbing matrix (SPA) in the low mass range, and we excluded the area below the detector blinding setting (m/z 2,500). Peaks with a signal-to-noise (S/N) ratio of 5 or higher and a valley depth greater than or equal to 3 were considered for clustering. Qualified peaks which were present in at least 10% of the spectra were used to generate peak clusters. Unlabelled spectra were then labelled at the average mass of the cluster so that a peak intensity value was obtained for each spectrum. The mass window for each cluster was set at 0.3% of the peak mass for spectra optimised for low mass (0-30 kDa) and at 2% of the peak mass for spectra optimised for high mass (30-100 kDa). To ensure that no spurious peaks were ultimately used as candidate biomarkers, peaks were evaluated and relabelled as required prior to the final round of statistical analysis. Qualified mass peaks (S/N >5) within m/z range of 2.5-100 kDa were then auto detected. Peak clusters were completed using a second pass peak selection (S/N >2, within 0.3% mass window) and estimated peaks added. The coefficient of variation for the QC spectra was calculated to be <20% in both studies in our laboratories and the Bio-Rad laboratories, Copenhagen.

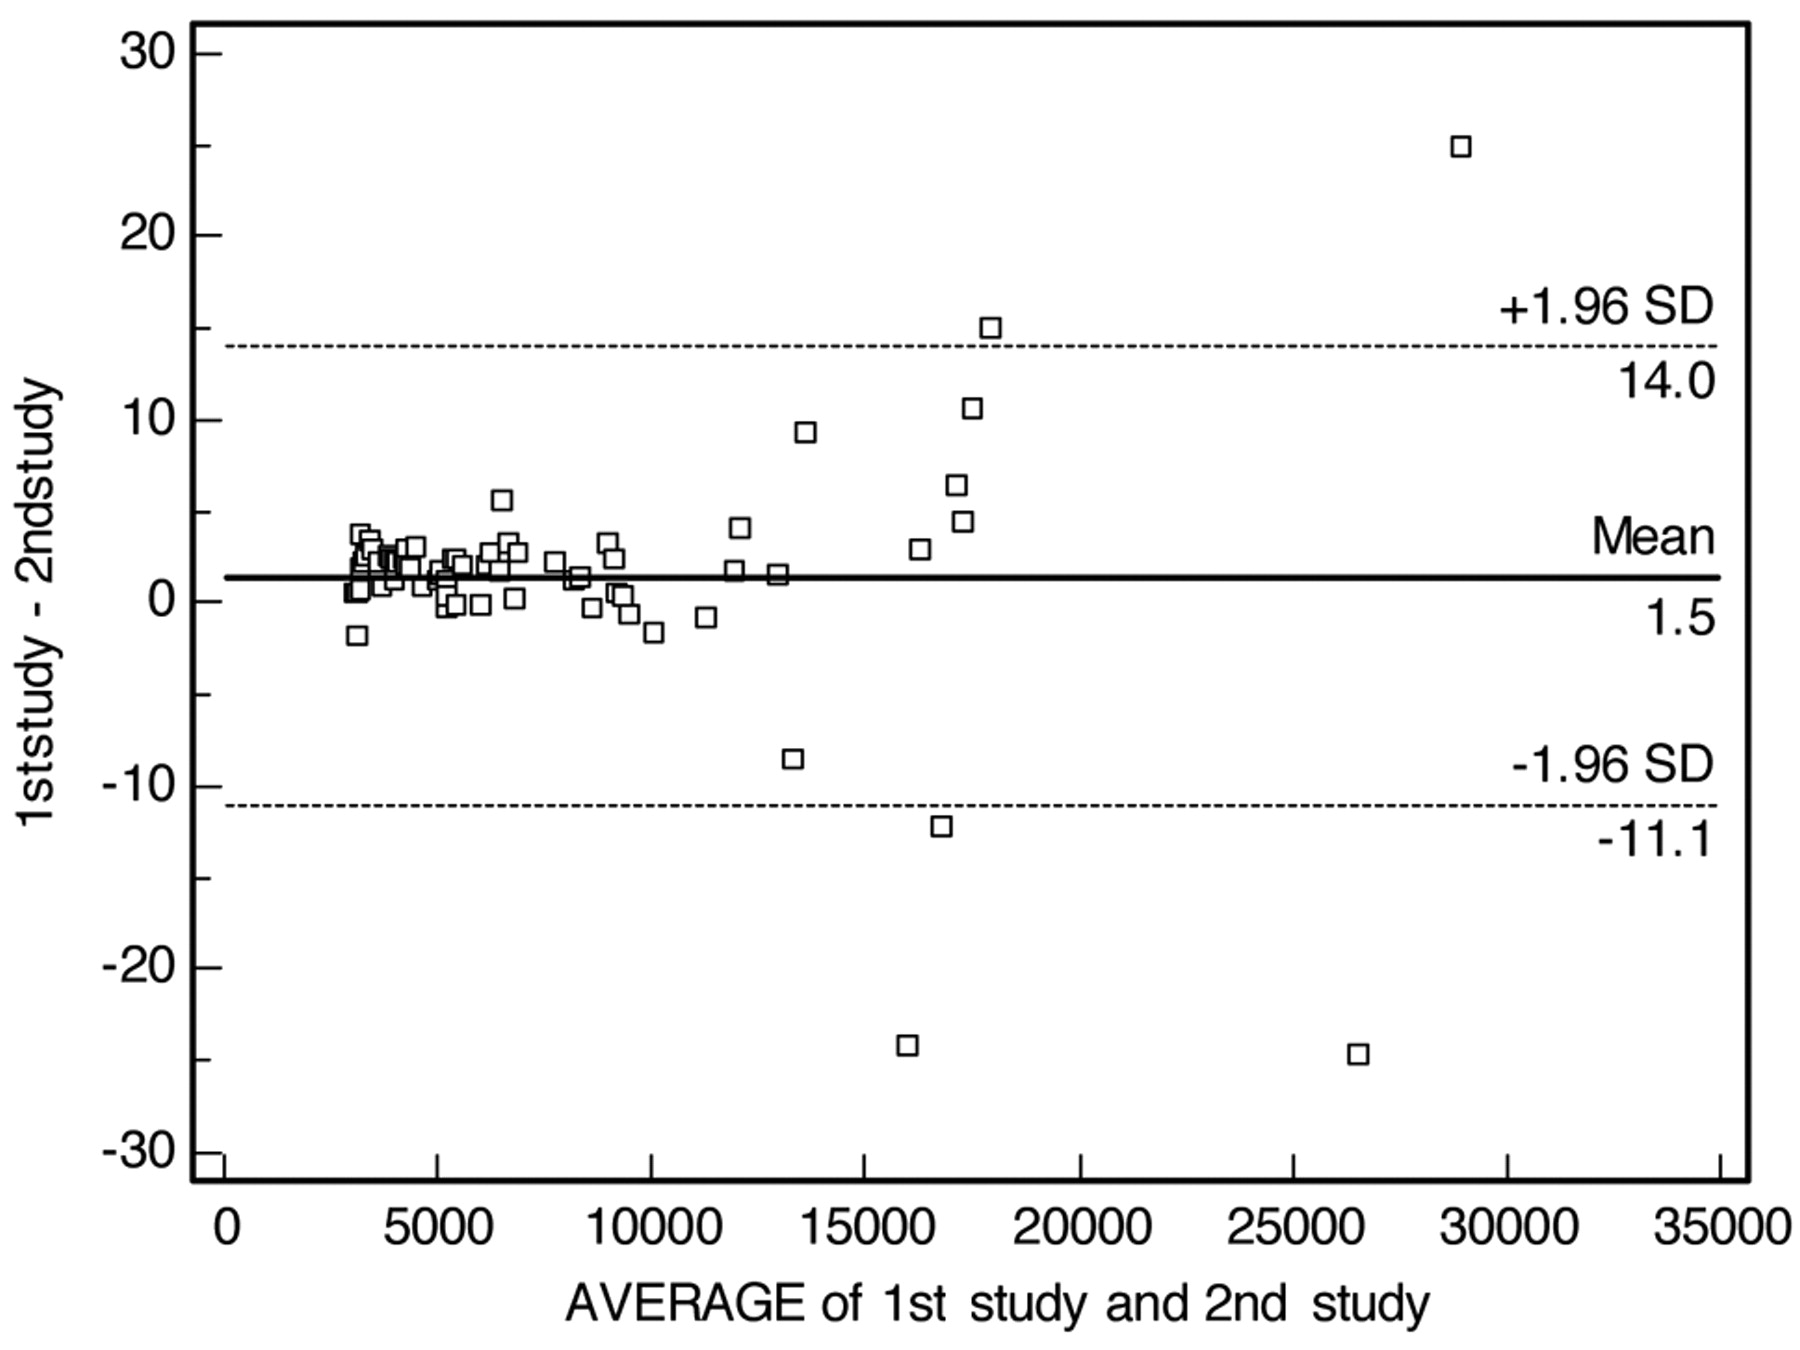
A Bland and Altman plot of the two comparative studies testing the reproducibility of SELDI-TOF MS analysis of archival serum samples. The vast majority of peak values lay within 2 standard deviations. The concordance correlation coefficient was 1, indicating a high degree of agreement between the two studies. Less agreement was observed at higher m/z values of the test. This could be related to ex vivo proteolytic activity, limitation in SELDI-TOF MS detection at the higher mass range or different preparation and analysis sites.
Data processing, peak detection and statistical analysis. Spectra had baselines subtracted, and were then normalised to total ion current within the m/z range of 3-100kDa. Once the normalisation step was completed, normalisation factors were examined to identify outlier spectra indicating possible variation due to sample processing. Spectra that had normalisation factors greater than two-fold higher than the average were deleted. A cluster graph was then generated using the ProteinChip Data Manager v3.0.7 Software, where each peak intensity was plotted against m/z for the two sample groups (cancer and healthy). Comparisons between groups were made using the Mann-Whitney U test. A p-value of <0.05 for a given peak indicated the significant differential expression of this peak. The coefficients of variations (CVs) of the pooled reference (QC) samples were calculated using the formula: CV=√ ((CV12+CV22 +CVn2)/n) where n represents the number of peaks within the spectra.
Results
A proof of concept study was undertaken using archival serum samples initially at the University of Southampton. Weak cation exchange arrays (CM10, pH 4.0) generated the highest quality peak-rich spectra of any array type and were consequently employed for analysis. SELDI-TOF MS analysis generated 128 peak clusters across the spectra from all analysed fractions. The same samples were reanalysed using identical conditions 3 months later as part of a validation study at the Bio-Rad Laboratories in Denmark. The results of a Bland and Altman analysis showed that the vast majority of peaks were within 2 standard deviations with a concordance coefficient of 1 (Figure 1). This concurrence was especially evident within the low molecular weight mass region, which is known to be the main focus of SELDI-TOF MS profiling. The coefficients of variations (CVs) between the separate runs were 18% -20%, which lies within the acceptable range for this methodology (29, 30). We also compared the spectra obtained over a period of 7 days to compare the CVs of our historic samples with others obtained from analysis of the recently collected Wessex serum samples. The CVs in both analyses were comparable with no significant difference found between the CVs in both groups. The Wessex reference samples CVs compared to the 30 year old Guernsey cohort samples were 16.4% vs. 18.2%, respectively. Analysing the same samples seven days later showed comparable CVs of 18.2% and 20.6%, correspondingly.
SELDI protein peaks in serum discriminating cancer from non-cancer groups (p<0.05).
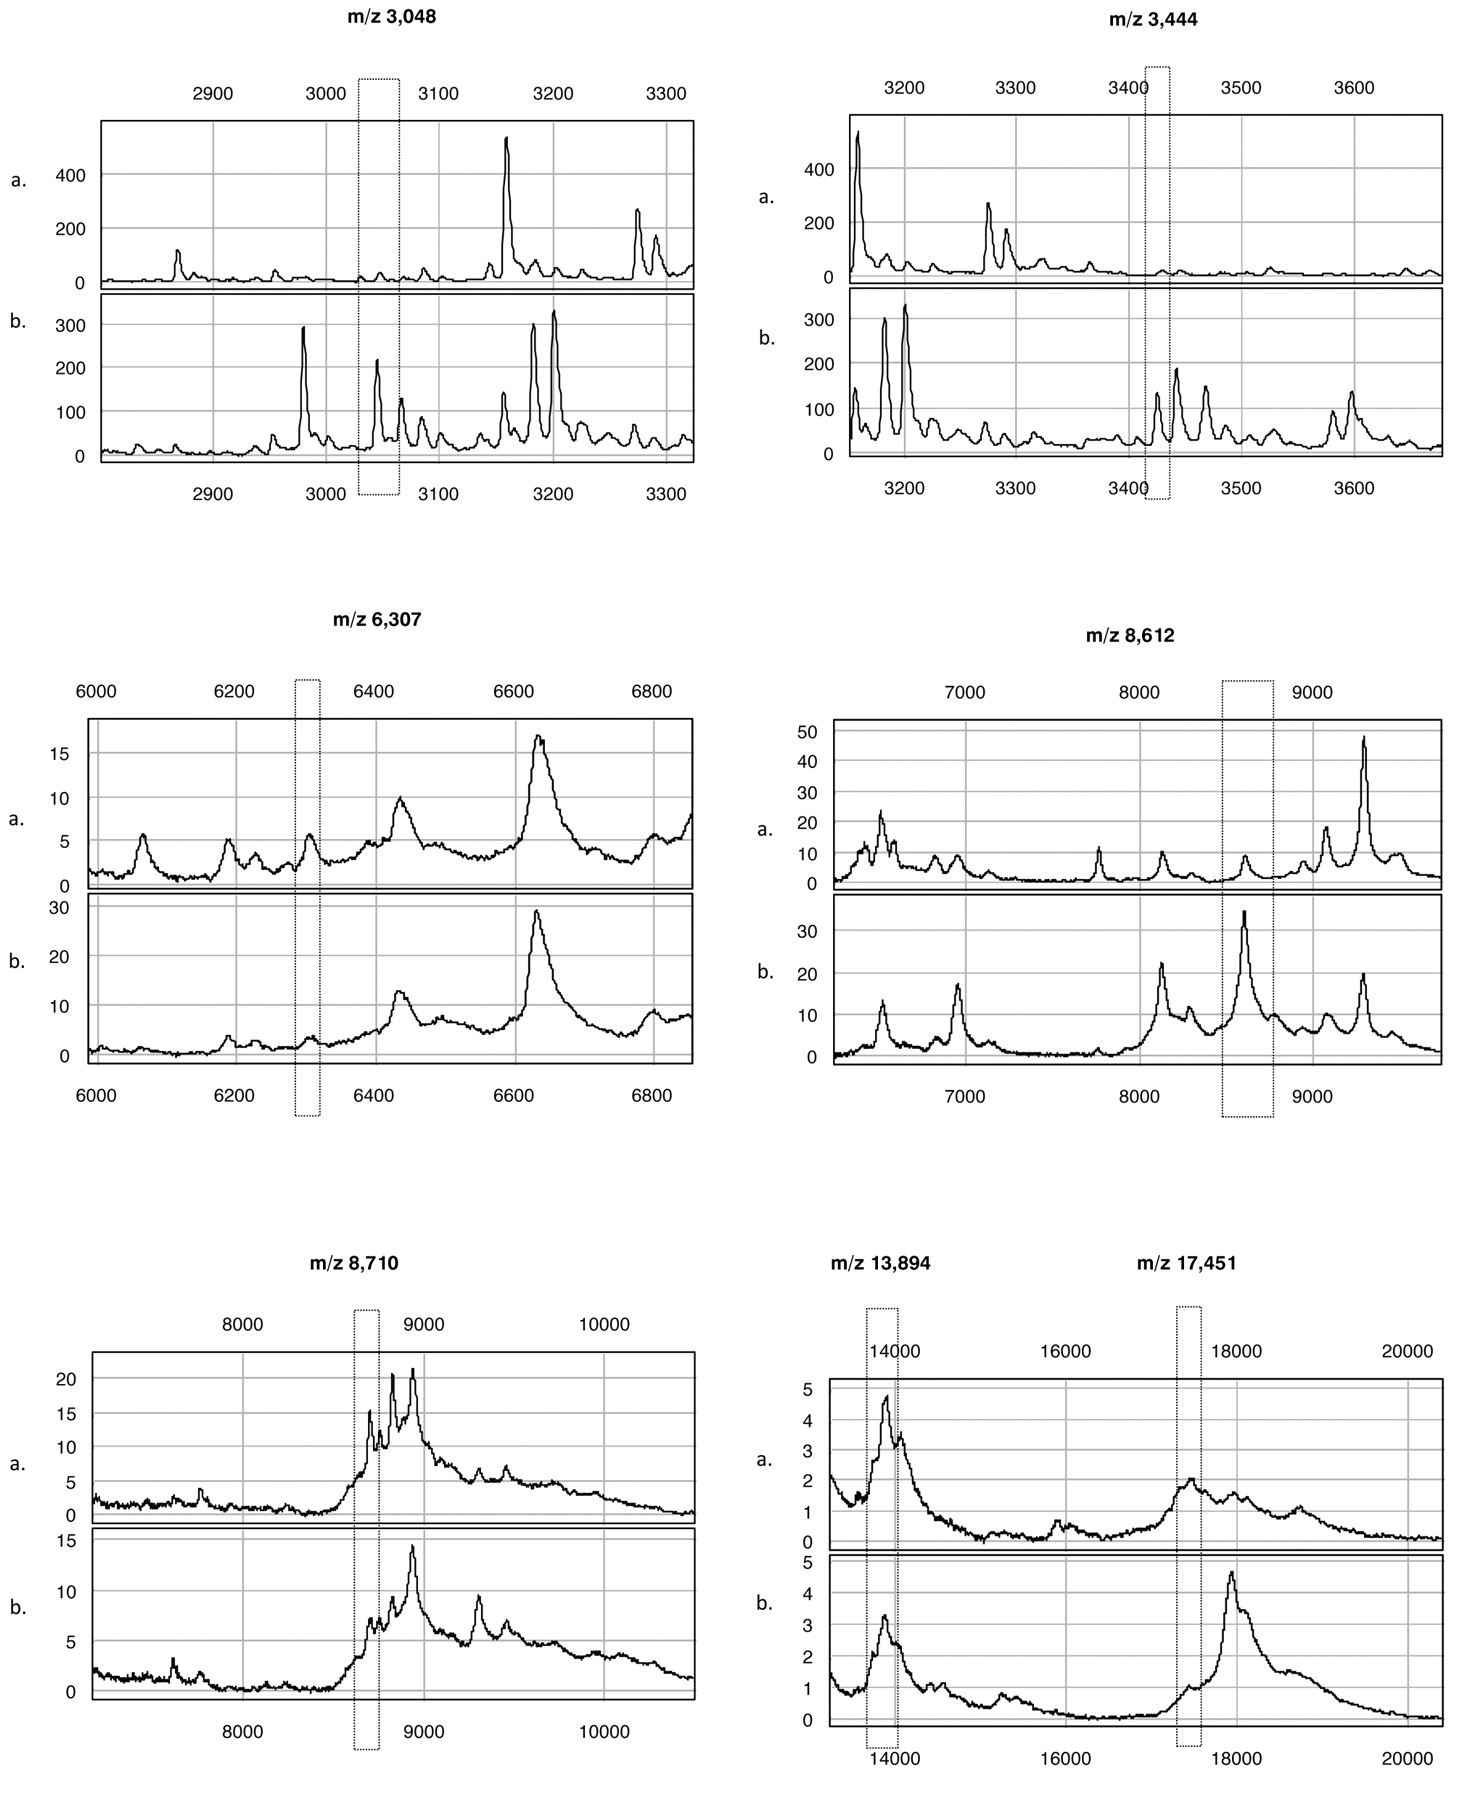
Although beyond the aim of the study, data analysis did demonstrate that some peaks were differentially expressed between the cancer and non-cancer serum samples. We noticed 16 statistically significant differentially expressed peaks with p-values <0.05, which differentiated the two groups in this study (Table I). Seven overexpressed and nine underexpressed peaks were detected in serum samples from cancer patients of this cohort (Figure 1).

A representative SELDI-TOF MS spectra comparing serum from healthy volunteers (a) and volunteers who had developed breast cancer at the time of serum collection (b). The boxed regions identify differentially expressed protein peaks 3.0, 3.4 and 8.6 kDa were overexpressed in cancer patients, and the peaks at 6.3, 8.7, 13.9 and 17.4 kDa were under expressed in cancer patients. Previously reported peaks at 8.1 and 8.9 kDa are also illustrated (X and Y axis represent mass in Daltons and peak intensity in μ amperes, respectively).
The most plausible differentiating protein ion peaks (p≤0.01) between the two groups were the 3.4, 6.3, 8.6, 8.7, 10.9, 13.9 and 17.4 kDa peaks. These peaks showed reproducible differentially expressed group specific behaviour in both studies. Specifically, the 3.4, 8.6 and 10.9 kDa peaks were overexpressed in sera from the breast cancer group, whereas the 6.3, 8.7, 13.9 and 17.4 kDa signals were underexpressed in all sera from women in the breast cancer group.
Discussion
Detection of cancer at an early stage would improve the likelihood of cure and increases life expectancy and quality of life. Nonetheless, current screening and diagnostic tools for breast cancer have limitations and it is important to identify alternative approaches to detect breast cancer. Proteins represent the preponderance of biologically active molecules responsible for most cellular function. The proteome is therefore an attractive area for novel biomarker discovery (18, 31). New technologies allowing rapid detection of proteins secreted in body fluids may provide an additional means for the early detection of cancer. Using blood samples for proteomic analysis is a simple, minimally-invasive, reproducible and cost effective method which can be used as a simple adjunct in addition to current tests, or even possibly as an alternative to current screening test in the future.
In this work, we have used MS as a tool to investigate archival serum proteomic profiles in a proof of concept study. SELDI-TOF with its high throughput abilities is a powerful approach for proteomic profiling (32). However, as with other clinical proteomic techniques, it has become clear that preanalytical variation has a major impact on the proteomic profiles detected (23). We believe SELDI-TOF may be particularly sensitive to these artefacts since it focuses on low molecular weight proteins and peptides, a part of the proteome that may be particularly susceptible to interference from proteolysis of serum proteins. As such, SELDI analysis of archival tissue is an intuitive method to explore this area. Should this approach provide a proof of concept for reliable archival proteomics analysis; applications using higher resolution and quantification approaches would be practical.
Historic collections may offer great promise for the identification of disease biomarkers, especially from large cohorts of healthy individuals' collections where subsequent onset of a disease is known. However, the identification of reliable biomarkers may not be possible, due to the technical variation introduced during non-optimised sample collection, processing and storage. Clearly, clinical proteomics is challenged by a paradox where on one hand standardised sample handling is critical for relevant biomarkers discovery, yet; clinically relevant biomarkers must survive the real world sampling and handling protocols.
Despite these concerns, relatively little work has been reported on the technical quality of MS analysis of archival serum samples. Translation of MS-based tumour bank serum discovery into immune-based quantitative assays was recently reported (33). This adds more power and utility to serum archival proteomics. In this study, we demonstrated the potential for proteomic biomarkers discovery using serum samples stored for decades. Despite the small size of our cohort, this is the first study demonstrating the feasibility, reproducibility and reliability of this technology in profiling serum samples stored at -20°C for up to 30 years. Comparing profiles of the breast cancer group and the control group revealed a number of statistically significant differentially expressed protein peaks (Table I). Key to this study was that unique differentiating peaks were also detected with an identical expression profile(s) using the same samples and conditions on a different research site.
Although the small sample size clearly precludes meaningful biomarker discovery in this study, it was interesting to note that peaks of a very similar mass have been reported in other breast cancer studies analysing both serum and nipple aspirate fluids (NAF) (7, 16, 34, 35). Despite differences in pre- and analytical techniques, similar peaks have been noted particularly at 3.0, 3.4 and 8.6 kDa, respectively (7, 16, 34, 35). Although we did not detect some other reported peaks such as the BC1 (4.3 kDa) peak in our analysis, our pilot study recovered other repeatedly referenced peaks potentially including BC2 and BC3 (8.1 and 8.9 kDa, respectively) (15, 36, 37). It is noteworthy that within our analysis we have used CM10 binding surfaces as we found these to be the most optimal as opposed to other studies which have used IMAC. Could our findings demonstrate a replication of these biomarkers? This challenging subject necessitates further validation and bona fide biomarker(s) identification studies to prove or dismiss any possible correspondence between the discriminatory protein peaks found in this study and other reported studies. Whether any of our observations are due to collection, storage, analysis settings or true biological discrimination in our samples is to be answered by future studies. It is anticipated that analysing older serum samples, which have a wealth of associated follow-up data, with high concordance and reproducibility will direct future breakthroughs in the field of proteomic profiling. This could lead to a revolutionary biomarker discovery programmes as older samples already stored in tissue banks will have had a greater duration to accrue information on relevant outcome measures.
Acknowledgements
We would like to thank both the Wessex Medical Research and Wessex Cancer Trust for funding this research and the women of Guernsey and Wessex for providing such valuable serum samples. BZ is the 12th States of Guernsey clinical fellow on the grant held by PAT. An extra special thank you goes to Mr Roger Allsopp for help and tremendous enthusiasm in instigating this proteomic study. We would also like to thank Caroline Hogarth and the Bio-Rad team for their help in conducting the second analysis in their laboratories. Finally, we thank Professor Ian Fentiman and Diane Allen for providing both the Guernsey samples and their clinical details and continuous enthusiasm and support for this study.
Footnotes
- Received May 8, 2009.
- Accepted May 14, 2009.
- Copyright© 2009 International Institute of Anticaner Research (Dr. John G. Delinassios), All rights reserved


