


Abstract
Background/Aim: Compared to other breast cancer types, triple-negative breast cancer (TNBC) has historically had few treatment alternatives. Therefore, exploring and pinpointing potentially implicated genes could be used for treating and managing TNBC. By doing this, we will provide essential data to comprehend how the genes are involved in the apoptotic pathways of the cancer cells to identify potential therapeutic targets. Analysis of a single genetic alteration may not reveal the pathogenicity driving TNBC due to the high genomic complexity and heterogeneity of TNBC. Therefore, searching through a large variety of gene interactions enabled the identification of molecular therapeutic genes. Materials and Methods: This study used integrated bioinformatics methods such as UALCAN, TNM plotter, PANTHER, GO-KEEG and PPIs to assess the gene expression, protein-protein interaction (PPI), and transcription factor interaction of apoptosis-regulated genes. Results: Compared to normal breast tissue, gene expressions of BNIP3, TNFRSF10B, MCL1, and CASP4 were downregulated in UALCAN. At the same time, BIK, AKT1, BAD, FADD, DIABLO, and CASP9 was down-regulated in bc-GeneExMiner v4.5 mRNA expression (BCGM) databases. Based on GO term enrichment analysis, the cellular process (GO:0009987), which has about 21 apoptosis-regulated genes, is the top category in the biological processes (BP), followed by biological regulation (GO:0065007). We identified 29 differentially regulated pathways, including the p53 pathway, angiogenesis, apoptosis signaling pathway, and the Alzheimer’s disease presenilin pathway. We examined the PPIs between the genes that regulate apoptosis; CASP3 and CASP9 interact with FADD, MCL1, TNF, TNFRSRF10A, and TNFRSF10; additionally, CASP3 significantly forms PPIs with CASP9, DFFA, and TP53, and CASP9 with DIABLO. In the top 10 transcription factors, the androgen receptor (AR) interacts with five apoptosis-regulated genes (p<0.0001; q<0.01), followed by retinoic acid receptor alpha (RARA) (p<0.0001; q<0.01) and ring finger protein (RNF2) (p<0.0001; q<0.01). Overall, the gene expression profile, PPIs, and the apoptosis-TF interaction findings suggest that the 27 apoptosis-regulated genes might be used as promising targets in treating and managing TNBC. Furthermore, from a total of 27 key genes, CASP2, CASP3, DAPK1, TNF, TRAF2, and TRAF3 were significantly correlated with poor overall survival in TNBC (p-value <0.05); they could play important roles in the progression of TNBC and provide attractive therapeutic targets that may offer new candidate molecules for targeted therapy. Conclusion: Our findings demonstrate that CASP2, CASP3, DAPK1, TNF, TRAF2, and TRAF3 were substantially associated with the overall survival rate (OS) difference of TNBC patients out of a total of 27 specific genes used in this study, which may play crucial roles in the development of TNBC and offer promising therapeutic interventions.
Breast cancer (BC) is the most common malignant tumor in women and the biggest threat to the health of women worldwide (1). Triple-negative breast cancer (TNBC), which lacks the expression of the human epidermal growth factor receptor two (HER2), estrogen (ER), and progesterone (PR) receptors, has shown a significant increase in interest in recent years (2). The typical characteristics of this condition are early onset, aggressiveness, earlier local recurrence, distant metastases, insensitivity to endocrine and targeted therapy, the rapid development of treatment resistance, a greater prevalence in premenopausal women under 50, and a poor progression (3). Due to its aggressive biological nature and resistance to current treatments, TNBC is thought to have a poor prognosis (4). However, the exact pathophysiology of BC is still unknown. Understanding the molecular genesis of BC is essential to developing screening indicators and new therapeutic targets for the disease’s prevention and treatment (5). Previous research has revealed a significant association between numerous molecular TNBC genes and therapy (6). According to our previous studies using TNBC cell lines, thymoquinone (TQ) treatment significantly altered the expression of many apoptosis-related genes in MDA-MB-231 and MDA-MB-468 cells (7). Also, the natural compound rosmarinic acid (8) and oleuropein (9) substantially altered the expression of many of the apoptosis mentioned above genes in MDA-MB-231 and MDA-MB-468 TNBC cells.
Meanwhile, the inactivation of proapoptotic proteins or the overexpression of antiapoptotic proteins can cause uncontrolled cell proliferation, leading to cancer. Apoptosis requires the activation of numerous processes, including regulated protein-protein interactions (PPIs) (10). During apoptosis, several proteins are released into the cytoplasm through the intermembrane gap of the mitochondria, activating initiator caspases to start a series of PPIs in the caspase cascade (11). Apoptotic dysregulation is associated with various clinical conditions, including cancer, immunological disorders, and neurodegenerative diseases (12). Therefore, apoptosis-regulated genes might serve as therapeutic implication genes for TNBC.
Understanding the molecular processes underlying carcinogenesis and tumor development requires identifying cancer-related genes. These genes may involve processes or pathways that enable cancer cells to evade growth regulation, metastasis, or invasion (13). Several cancer-related genes have been revealed in the last decade using rapidly developing technologies, particularly high-throughput methods like gene expression microarrays and proteomics (14). For instance, microarray-based comparative genomic hybridization has been used to identify both known and new breast cancer genes (15). Transcriptome sequencing coupled with computational methods (16) has also been used to find genes related to colorectal cancer (17). For example, BRCA1 and BRCA2 in breast cancer (18), prostate-specific antigen (PSA) in prostate cancer (19), WAP four-disulfide core domain protein 2 gene (WFDC2) in ovarian cancer (20), and BIRC5 in TNBC (21) are well-known targets for certain cancers. These genes’ complementary biological roles offer hints for studying the biology of cancer. However, the few cancer target genes discovered do not behave as standalone biological units. Integrated omics profiles provide the chance to find more cancer genes through the advancement of sequencing technology (22).
Due to TNBC’s extreme heterogeneity and complexity, it is difficult to fully comprehend the molecular processes that drive tumor growth (23). Researchers have identified potential risk-causing genes in the development of TNBC tumors. An increasing number of genes are strongly connected to TNBC progression due to advancements in experimental methods and high-throughput sequencing technologies (24). The absence of specific and accurate treatment for TNBC is one of the biggest challenges in cancer treatment.
Understanding the underlying molecular mechanism can help develop more effective therapies (4). The molecular mechanisms of cancer and development have been studied using bioinformatics analysis based on gene expression profile data. The usage of public data is growing because of increased availability and reliability in several cancers. Therefore, a comprehensive understanding of the mechanisms driving carcinogenesis is required. The public database evaluates candidate genes by monitoring the presence of typical oncogene somatic mutation patterns. It also determines the biological functions of candidate genes through literature curation. The various online tools for gene-wide screening are crucial to understanding cancer pathophysiology. In this study, the data collection from the integrated public databases could support the significance of the genes. Furthermore, the Gene Expression database’s data, PPI network screens of differential genes, and the subset of apoptotic-regulated genes were examined. A PPI network and co-expression integration analysis were employed in this study to find possible risk-causing genes in TNBC. The identified genes are essential in the carcinogenesis and progression of TNBC. Our previous findings confirmed the effects of specific genes that promote the malignant progression of TNBC (7). In addition, the chemoresistance gene “BIRC5” strongly contributes to the poor prognosis of TNBC (21).
Our objective was to expedite the biological networks that characterize apoptosis-regulated genes/pathways that may be involved in the carcinogenesis of TNBC. A thorough examination of protein-protein interactions may make it easier to pinpoint the pathways and genes that impact TNBC. Significant advancement has been made in our understanding of apoptosis on the connectivity of death pathways.
This study offers a theoretical framework for investigating potential TNBC treatment targets. Overall, our findings can serve as a roadmap for investigating the biological processes involved in the carcinogenesis of TNBC and offer different perspectives on how TNBC might be treated in the future.
Materials and Methods
Data source and selection of genes. The apoptotic pathway’s dysregulation or dysfunction is a contributing factor in a variety of clinical disorders, including cancer. The apoptotic pathway-related genes have previously undergone experimental validation and statistical analysis in our lab (7). Based on comparing the control and the treatment groups of our TNBC cells (MDA-MB-231 and 468), we identified 27 apoptotic-regulated genes from 88 genes. The PCR based identified genes are AKT1, APAF1, BAD, BAX, BIK, DAPK1, FADD, TNF, TNFRSF10A, TNFRSF10B, TNFRSF11B, TNFRSF21, BAG1, ACTB, TRAF2, TRAF3, BCL10, BNIP3, CASP2, CASP3, CASP4, CASP9, DFFA, DIABLO, GADD45A, MCL1, and TP53. Based on these genes, the gene expression profile and human PPI network were built and examined using an integrated bioinformatics tool.
Use of the University of Alabama at Birmingham Cancer (UALCAN) database. UALCAN database is a portal for facilitating tumor gene expression and survival analyses (25, 26). In this database, we set the conditions for filtering and data mining. The screening conditions set in this study are: “Input gene: Apoptotic genes”, “Link for analysis: expression”, “Analysis Type: Triple-negative breast Cancer vs. Normal”, “Cancer Type: Breast invasive carcinoma”, “Data Type: TCGA dataset” (26).
Use of bc- GeneExMiner v4.5 mRNA expression database (BCGM). Breast Cancer Gene-Expression Miner v4.5 (bc-GenExMiner v4.5) was used to explore the expression of various apoptotic-related genes in this study. The screening conditions set in this study are: “Analysis: expression-targeted”, “gene expression data: DNA microarrays”, Population: TNBC(IHC) and/or Basal-like (PAM50)”. The Breast Cancer Gene-Expression Miner v4.5 (bc-GenExMiner v4.5 was used (27-29).
Use of TNM Plotter. The TNM plotter (https://www.tnmplot.com, accessed on August 2, 2022) is an online tool that allows for a real-time comparison of gene-expression changes in the tumor, normal, and metastatic tissues across many platforms. The program combined and examined all selected gene expressions using the TCGA datasets. The Mann-Whitney test was employed to directly compare tumor and normal tissues (30).
Gene ontology (GO) and Kyoto Encyclopedia of Genes and Genomes (KEGG) pathway enrichment analysis. The functional annotation bioinformatics microarray analysis tool DAVID (https://david.ncifcrf.gov) was used to import the DEG data. GO analysis was used to analyze the biological processes (BP) that these genes are mostly engaged in, and functional enrichment of DEGs was performed. The inclusion criterion was a false discovery rate (FDR) of less than 0.05. ConsensusPathDB, a database of molecular functional interactions, was used mostly for the analysis of cancer-related pathways (http://cpdb.molgen.mpg.de/). Cellular components, molecular function, and biological process are the three basic subcategories of Gene Ontology (GO). To provide a thorough understanding of the biological information of the genes, proteins, and their associated pathways, Kyoto Encyclopedia of Genes and Genomes (KEGG) (31) pathway analyses for the DEGs from the clusters were carried out using the functional annotation tool called Enrichr (32, 33) (https://amp.pharm.mssm.edu/Enrichr). The threshold parameter for screening the KEGG enrichment pathways was set at an adjusted p-value of <0.05. The Rich factor, the ratio of the number of DEGs to the number of genes identified in the related pathway, was used to rank the KEGG results. Accordingly, the degree of enrichment increases with an increase in the Rich factor. All data were accessed on June 30, 2022. ShinyGO (v.0.61), which may be found online at http://bioinformatics.sdstate.edu/go/ (accessed on July 17, 2022), was used for the analysis of Enriched biological processes.
PANTHER Classification System analysis. The apoptosis-regulated genes were then uploaded to PANTHER (Protein ANalysis THrough Evolutionary Relationships) Classification System online to find gene/protein networks that were over-represented within the gene collection. The PANTHER website (http://pantherdb.org/about.jsp, viewed on June 21, 2022) offers tools for functional analysis of gene or protein lists. Gene lists, for example, can be graphically evaluated using sortable functional classes and pie or bar charts or statistically using overrepresentation or enrichment tests (34-37).
Protein-protein interaction (PPI) network construction and subnetwork analysis. To predict functional connections of proteins, the STRING (search tool for retrieval of interacting genes) database was used (http://www.string-db.org/, version 9.1, accessed on June 25/2022) (38), which combines known and predicted PPIs. Currently, STRING includes 24.6 million proteins from 5090 different species (39). The STRING program was used to look for potential relationships between DEGs and other tissues. The PPI networks were built using active interaction sources such as combined score (>0.7), text mining (score >0.7), experimentally determined interaction (score >0), databases, co-expression, and species limited to “Homo sapiens” and an interaction score >0.4. For PPIs, there are often three different types of confidence scores: Low confidence is defined as a score of 0.4, medium confidence as a score of 0.4, and high confidence as a score of >0.7 (40). To get more accurate results in the current investigation, we chose a high confidence score, which allowed us to rule out PPIs with low probability or significance. The PPI network was viewed using Cytoscape software 3.6.1 (41). The following criteria were employed with ClusterONE 1.0 software to find areas of the network that were strongly connected: minimum size=5, minimum density=0.05, and edge weights=combined score. The protein nodes that had no connections with other proteins were deleted. Genes functioned as nodes in the PPI network, while associated interactions were represented by edges. The CentiScaPe plugin for Cytoscape was used to investigate the connectivity degree of each node, which reveals the number of contacts of the related gene. Hub genes were designated nodes with a connectivity score of less than 15. The Molecular Complex Detection plugin (MCODE) (43) also performed protein complex analysis to find the important major clusters in this extensive PPI network. The advanced options were set to a degree cutoff of 2 and a K-Core of 2, respectively. Protein complexes with a score of less than five were chosen as important sub-networks. Additionally, we used the STRING database to perform co-expression analysis on every cluster gene in order to determine which clusters may be co-regulated with other clusters. The results of the co-expression study were then combined to form clusters to determine which clusters are linked to other clusters by co-expression genes. This might be useful for comprehending and forecasting the network analysis clusters that are co-regulated by co-expression genes. The DEGs in all clusters were then analyzed for BP and KEGG pathway enrichment using the Enrichr program (42).
Network analysis. GeneMANIA (www.genemania.org, accessed on August 4, 2022), an online analysis tool that provides protein and genetic co-expression, co-localization, interactions, pathways, and shared protein domains of submitted genes, was used to perform a gene-gene interaction network for selected apoptosis regulated genes (43).
Verification of genes. OS analyses were performed based on the expression and clinical data from KM Plotter (http://www.kmplot.com) (accessed on September 1, 2022) to verify the therapeutic implication of hub genes and their significant genes. KM Plotter used Cox proportional hazards regression were used to perform survival analysis for each gene, and the Benjamini-Hochberg method was used to correct for multiple hypothesis testing (44, 45). We divided the patients into high and low-expression groups according to their average expression value of hub genes, and FDR corrected the p-value of the survival analysis results. The log-rank p-values <0.05 were statistically significant.
Statistical analysis. The TNM plotter web analytic tool was used to analyze tumor and normal-tissue gene expression statistically. Kruskall-Wallis nonparametric test was used to compare measurements across patient groups for overall analyses. The Mann-Whitney U-test was used to compare the normal and tumor samples. The Kaplan-Meier plotter web analytic tool was also used to generate Kaplan-Meier survival plots with the number of people at risk, hazard ratio (HR), 95 percent confidence intervals (CI), and log-rank p-values. The GO-based overrepresentation of a gene list (the analyzed list) compared to a reference homo sapiens gene list was examined using the PANTHER website. After entering the lists, we selected the Fisher’s Exact Test with FDR correction. The FDR is a better correction to apply for this kind of study, especially given the high degree of class overlap. The p-value was set to <0.05 to imply that there was a statistically significant difference in overall survival between the high-expression and low-expression groups.
Results
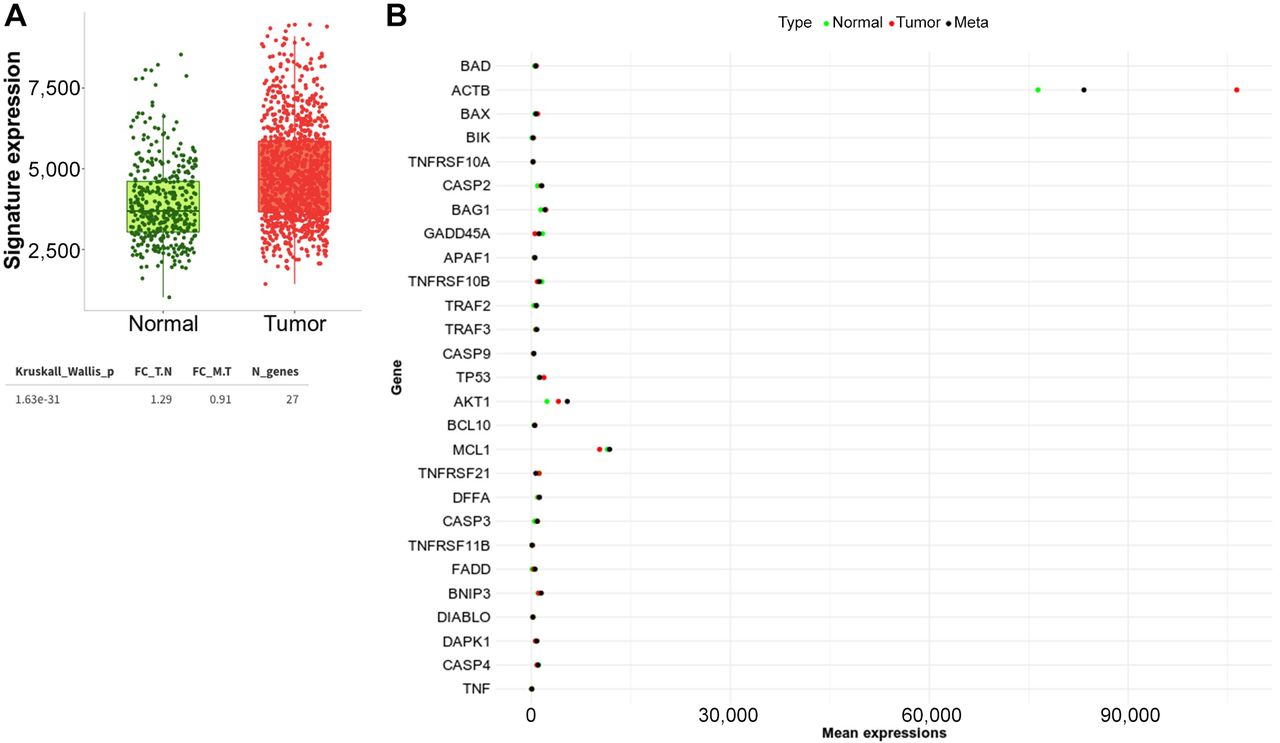
The expression of apoptosis-regulated genes in BC. We first used TNMplot to examine the gene expression profile in normal and tumor in invasive breast carcinoma. The Gene Signature Analysis uses data from RNA-Seq to determine the means of the selected gene signature across each patient individually and produce a summary plot, as shown in Figure 1A. Compared to normal breast tissue, we found that the combined effect of all the selected gene signature expressions is significantly elevated in the tumor (Kruskall-wallis p<0.0001). We also provide a real-time comparison of changes in gene expression across all 27 genes in the tumor, normal, and metastatic tissues. Figure 1B and Table I show a typical boxplot of the result. When compared to normal, the expression of the genes TNFRSF10A and TNFRSF11B is up-regulated in the tumor but down-regulated in metastasis, with log2FC values of 12.1 and −13.9, 1.2, and - 18.3, respectively. With log2FC values of −7.8 and 19.2, - 68.2 and 2.3, −6.4 and 24.6, respectively, CASP9, DAPK1, and MCL1 gene expression are up-regulated in metastasis but down-regulated in the primary tumor. Even when the value of gene expression varies between tumor and metastasis, GADD45A, CASP4, DIABLO, TNFRSF10B, and TNFRSF21 are down-regulated compared to normal tissue (Table I).

Expression of apoptosis-regulated genes in breast cancer (BC). (A) The overall effect of 27 apoptosis-regulated genes in invasive breast carcinoma. Kruskall-Wallis nonparametric test is used to compare measurements across patient groups for overall analyses. (B) Differential gene expression analysis in tumor, normal,] and metastatic tissues of the 27 apoptosis genes in breast invasive carcinoma patients according to TNMplot.
An overview of the means of the selected apoptosis genes in breast cancer (BC) in multiple gene analyses using RNA-seq-based data. The Log2FC is presented compared to normal.
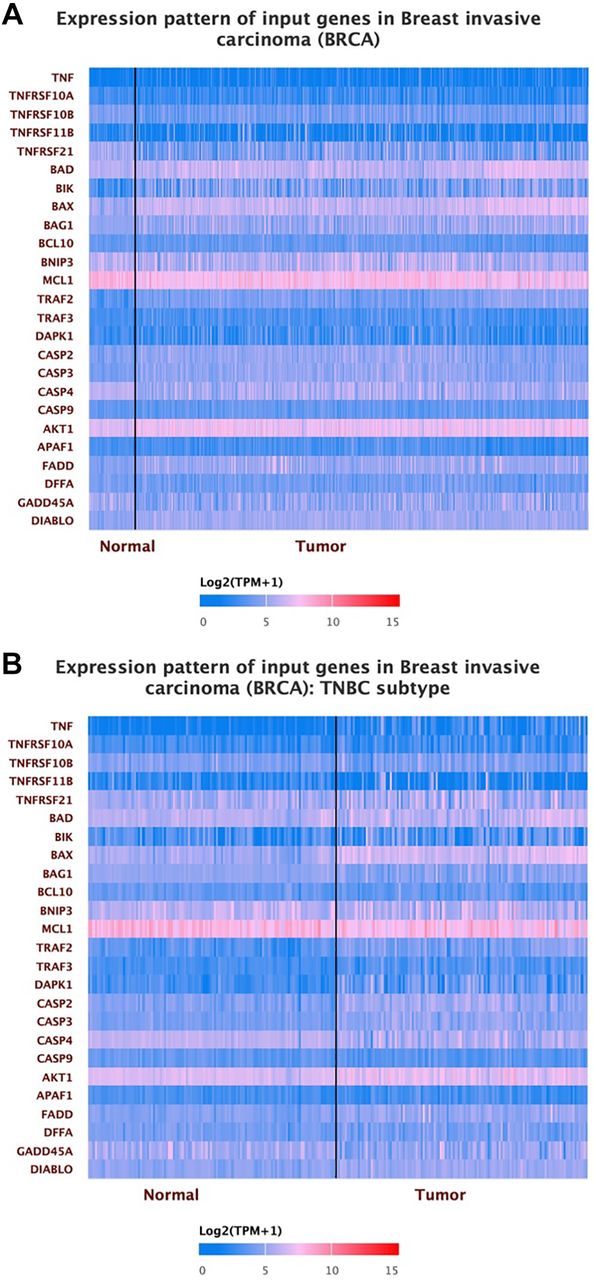
The expression of the apoptosis-regulated genes in the BC and TNBC. We then analyzed and used the UALCAN database to investigate the level of apoptosis-related gene expression in normal breast tissue, TNBC, and invasive breast carcinoma. After inserting our list of genes into the database, the expression of apoptotic genes in normal breast tissue, invasive breast carcinoma, and TNBC is depicted in Figure 2. BIK, BAX, BAG1, TRAF2, TRAF3, CASP2, CASP3, AKT1, FADD, and DIABLO are all increased in the tumor compared to normal breast tissue, but TNFRSF10A, TNFRSF11B, BCL10, BNIP3, MCL1, CASP9, and APAF1 have not demonstrated a significant difference between tumor and normal breast tissue. At the same time, the rest of the genes were down-regulated in the tumor (Figure 2A and Table II). The heatmap expression shows that TNF, TNFRSF21, BAD, BIK, BAX, TRAF2, CASP2, CASP3, AKT1, FADD, and DIABLO are all up-regulated in TNBC compared to normal breast tissue. At the same time, TNFRSF10A, TNFRSF10B, TNFRSF11B, BCL10, BNIP3, MCL1, APAF1, and DFFA have no significant differences between normal and TNBC, and the rest of the genes are down-regulated in TNBC (Figure 2B, Table II). The levels of apoptosis-related gene expression in invasive breast carcinoma and TNBC were compared for observation. When we examined the expression between the normal breast tissue in TNBC and BRCA as well as in the tumor, there was a noticeable difference in gene expression, even though the expression levels in the tumor and normal breast tissue were indistinguishable.

The apoptosis-regulated genes in tumor and normal breast tissue using UALCAN heatmap expression. (A) The difference in expression between the invasive breast tumor and normal breast tissue. (B) the differences in expression between tumor and normal breast tissue in TNBC.
The p-value of each gene expression compared to normal breast tissue expression. The p-value is directly extracted from the UALCAN database without the need for additional statistical analysis.
Individual apoptosis gene expression profile for TNBC patients based on the UALCAN database. In our findings, according to the UALCAN repository database, TNBC patients have higher TNF mRNA expression than normal breast tissue (NBT), with average transcripts of 3.3 vs. 1.64, respectively (Figure 3A). Even though there is no statistical difference between TNBC and the NBT, TNBC patients have lower TNFRSF10A mRNA expression, with average transcripts of 5.6 vs. 7.0, respectively (p>0.05, Figure 3B). TNBC has lower expression compared to NBT, with average transcripts of 18.71 vs. 21.30 for TNFRSF10B (p>0.05, Figure 3C) and 1.48 vs. 4.2 (p<0.5) for TNFSRF11B (Figure 3D), but a higher expression for TNFSRF21 (38.9 vs. 38.2, p<0.05, Figure 3E) as well as lower BAG1 expression (p<0.05, Figure 3F). Although there is no statistical difference between TNBC and NBT, TNBC patients have higher expression of BCL10 (13.0 vs.12.3, Figure 3G) and lower mRNA expression of BNIP3 (44.7 vs. 55.0, Figure 3H) and MCL1 (205.5 vs. 269.5, Figure 3I). TNBC patients have significantly higher mRNA expression of BIK (10.13 vs. 8.86, p<0.001, Figure 3J), BAX (89.99 vs. 39.5, p<0.01, Figure 3K), BAD (64.4 vs. 57.1, p<0.01, Figure 3L), and lower DFFA expression (18.4 vs. 19.0, Figure 3M) compared to NBT. TNBC patients have considerably higher mRNA expression of DAPK1 (12.5 vs. 7.1, Figure 3N), FADD (31.0 vs. 2.01, Figure 3O), and DIABLO (35.4 vs. 29, Figure 3P). TNBC patients have significantly higher CASP2 (p<0.0001, Figure 3Q) and CASP3 mRNA expression (27.78 vs. 18.62, Figure 3R) but lower CASP4 (48.2 vs. 63.8, Figure 3S) and CASP9 (13.6 vs. 9.8, Figure 3T) mRNA expression compared to NBT. TARF2 (21.2 vs. 9.8, Figure 3U), TRAF3 (9.1 vs. 7.5, Figure 3V), TP53 (74.8 vs. 67.3, Figure 3W), and ACTB (p<0.05, Figure 3X) are higher mRNA expression compared to NBT. TNBC patients had significantly lower GADD45A (28.1 vs. 35.3, Figure 3Y), higher APAF1 (108.3 vs. 105.9, p<0.0001, Figure 3Z), and no difference in AKT1 (108.3 vs. 105.9, p>0.05, Figure 3AA) mRNA expression compared to NBT.
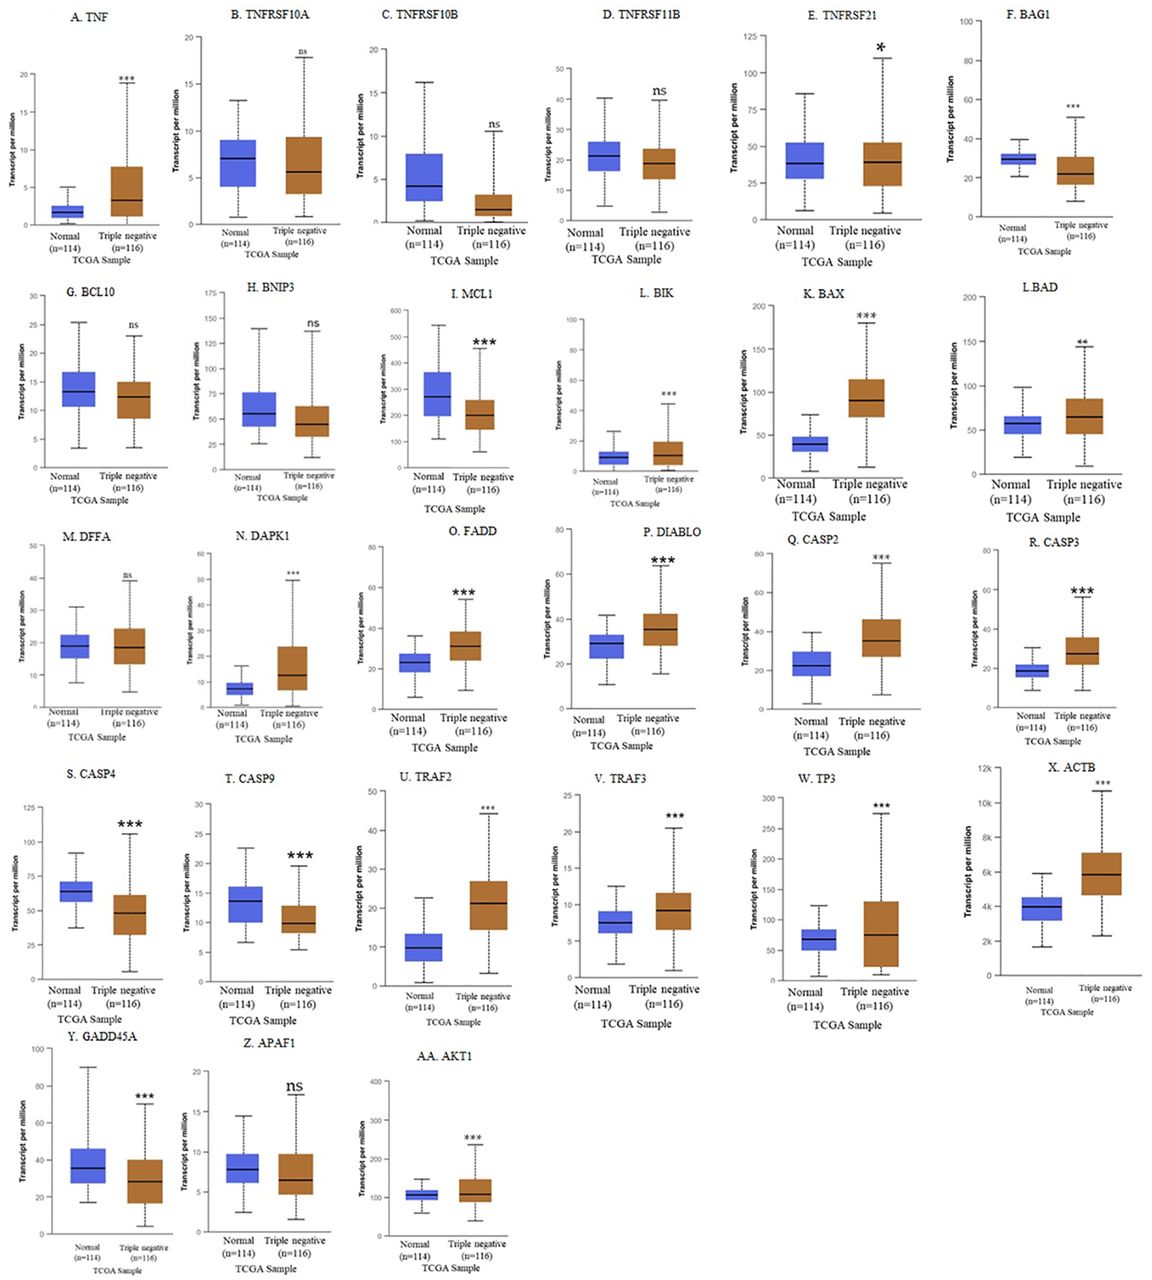
Apoptosis gene expression profile based on the UALCAN databases. The difference between normal breast tissue (NBT) and TNBC is shown as *p<0.05, **p<0.01, ***p<0.001, and ns: nonsignificant.
Individual apoptosis gene expression profile for TNBC patients based on BCGM databases. In our findings, TNBC patients have higher TNF (0.3094 vs. −0.0491, Figure 4A), TNSRSF10A (Figure 4B), TNSRSF10B (0.1397 vs. −0.0777, p<0.05) (Figure 4C), nearly equal TNFRSF11B expression (0.1740 vs. 0.1525, p>0.05, Figure 4D), and higher TNFRSF21 (0.6860 vs. −0.1520, p<0.05, Figure 4E) mRNA expression compared to non-TNBC patients. TNBC patients have lower BAG1 expression than non-TNBC patients, which is consistent with UALCAN data (p<0.0001, Figure 4F). TNBC has higher BCL10 (−0.0179 vs. −0.0580, Figure 4G), BNIP3 (0.2424 vs. 0.160, Figure 4H), MCL1 (0.2034 vs. −0.0496, Figure 4I in contrast to the UALCAN database), lower BIK expression (−0.6572 vs. 0.0107, p<0.0001, Figure 4J, contradicted with UALCAN data), higher BAX expression (p<0.0001, Figure 4K) and lower BAD expression (p<0.0001, Figure 4L contradicts UALCAN data) compared to non-TNBC patients. TNBC patients have higher DFFA expression (0.4543 vs. −0.0523, Figure 4M, contradicts UALCAN data), higher DAPK1 expression (0.7553 vs. −0.0562, Figure 4N, similar to UALCAN), lower FADD expression (−0.3725 vs. −0.0511, Figure 4O, contradicts UALCAN data) and lower DIABLO expression (−0.0892 vs. 0.0504, Figure 4P, contradicts UALCAN data) compared to non-TNBC patients. TNBC patients have higher mRNA CASP2 expression (p<0.0001, Figure 4Q), CASP3 (0.2315 vs. −0.0471, Figure 4R), and CASP4 (0.1313 vs. −0.0902, Figure 4S), but lower CASP9 (−0.2539 vs. 0.0368, Figure 4T) mRNA expressions compared to non-TNBC patients. TNBC patients had higher TRAF2 expression (0.1958 vs. −0.0242, Figure 4U, similar to UALCAN), higher TRAF3 expression (0.2767 vs. −0.0605, Figure 4V), no significant change in TP53 expression (−0.0297 vs. −0.0569, Figure 4W), lower ACTB expression (p<0.0001, Figure 4X, consistent with UALCAN data), no significant difference in GADD45A expression (−0.0068 vs. −0.0176, Figure 4Y, in contrast to UALCAN), comparable APAF1 expression (contrary to UALCAN findings, Figure 4Z), and lower AKT1 expression (0.3564 vs. 0.0723, Figure 4AA, in contrast to UALCAN) compared to non-TNBC patients.

Apoptosis gene expression profile based on the bc- GeneExMiner v4.5 mRNA expression (BCGM) databases. The difference between normal breast tissue (NBT) and TNBC is shown as ****p<0.0001, ns: nonsignificant. The values are expressed as mean±standard deviation.
When the expression of the investigated apoptosis-related genes was compared across the UALCAN, and BCGM online data sets, BNIP3, TNFRSF10A, TNFRSF10B, MCL1, CASP4, and DFFA were up-regulated in BCGM and downregulated or non-significantly changed on UALCAN. At the same time, BIK, AKT1, BAD, FADD, DIABLO, and CASP9 were down-regulated in BCGM and up-regulated in UALCAN databases. These differences may demonstrate the heterogeneity of TNBC and other factors, which need further research. Table III summarizes the expression of apoptotic genes between online data sources.
Comparable apoptosis gene expression of TNBC and non-TNBC patients from two online databases. The p-values for each database shown in the table are compared with normal breast tissue. The p-value is directly extracted from the UALCAN and BCGM databases without the need for additional statistical analysis.
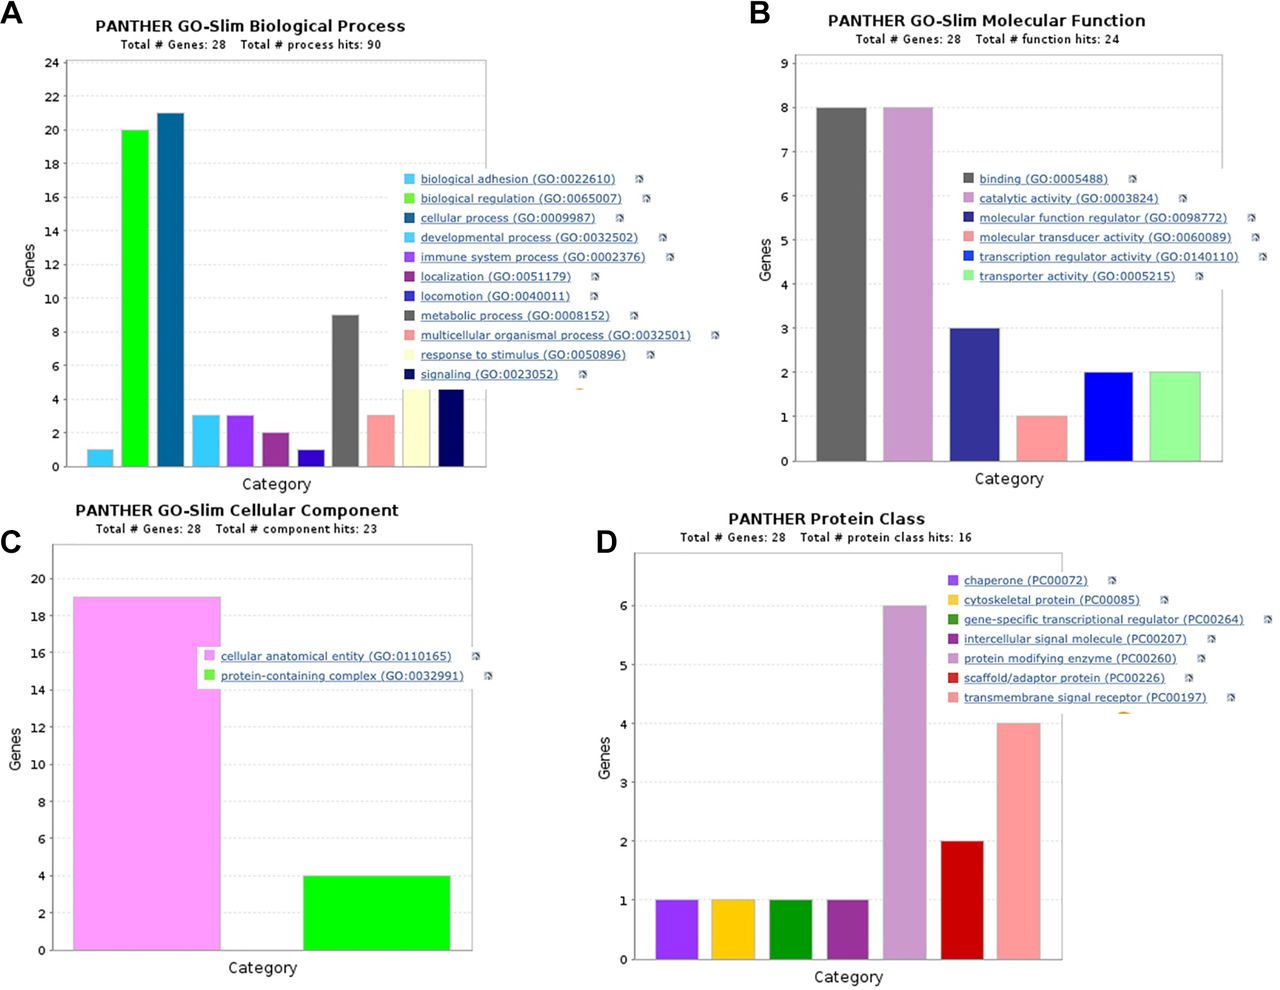
Functional enrichment analyses. Gene ontology (GO) was used to find distinctive biological characteristics in the RNA-seq raw data. Utilizing Enrichr, a separate Gene Ontology Enrichment Analysis tool was conducted. These significantly enhanced terms could help us understand DEGs’ function in TNBC. Based on the GO term enrichment analysis results, they were divided into functional categories for biological process (BP), molecular function (MF), cellular component, and protein class. Cellular process (GO:0009987), which has about 21 apoptosis-regulated genes, is the top category in the BP, followed by biological regulation (GO:0065007), which has 20 genes. Biological adhesion (GO:0022610) and signaling (GO:0023052), on the other hand, was the lowest categories in terms of the number of apoptosis-regulated genes involved in the process (Figure 5A). With eight apoptosis-regulated genes respectively, binding (GO:0005488) and catalytic activity (GO:0003824) are the most significant categories in the molecular function; by contrast, molecular transducer activity (GO:0060089) was the lowest, with only one gene in the function (Figure 5B). Only two categories in cellular components were identified: cellular, anatomical entity (GO:0110165), and protein-containing complex (GO:0032991), which have 19 and 4 apoptosis-regulated genes, respectively (Figure 5C). In the PANTHER protein class, the protein modifying enzyme (PC00260), which has six apoptosis-regulated genes, is the next highest category, followed by transmembrane signal receptor (PC00197), which has four apoptosis-regulated genes (Figure 5D).

Gene ontology (GO) analysis. (A) Biological process, (B) molecular function, (C) cellular components, and (D) protein class. The color of the bar graph represents the specific cellular activities, while the height represents the number of genes associated with each process.
The overlapping DEGs were subjected to GO enrichment analyses. Transcription regulator activity, molecular transducer activity, binding, molecular function regulator, catalytic activity, and transporter activity were all highly enriched in the DEGs according to molecular function classification. The 11 biological processes that these DEGs were involved in are shown in Table IV, where biological adhesion, biological regulation, cellular process, developmental process, immune system process, localization, locomotion, metabolic process, multicellular organismal process, response to stimulus, and signaling are all intimately related to the development of cancer. GO analysis revealed that transmembrane signal receptors, intracellular signal molecules, gene-specific transcriptional regulators, cytoskeletal protein, chaperon, and protein modifying enzymes were notably enriched in protein class. According to the results of the GO analysis, cellular, anatomical entities, and protein-containing complexes were primarily abundant in cellular components (Table IV).
GO analysis of the apoptosis-related genes associated with the respective functional categories.
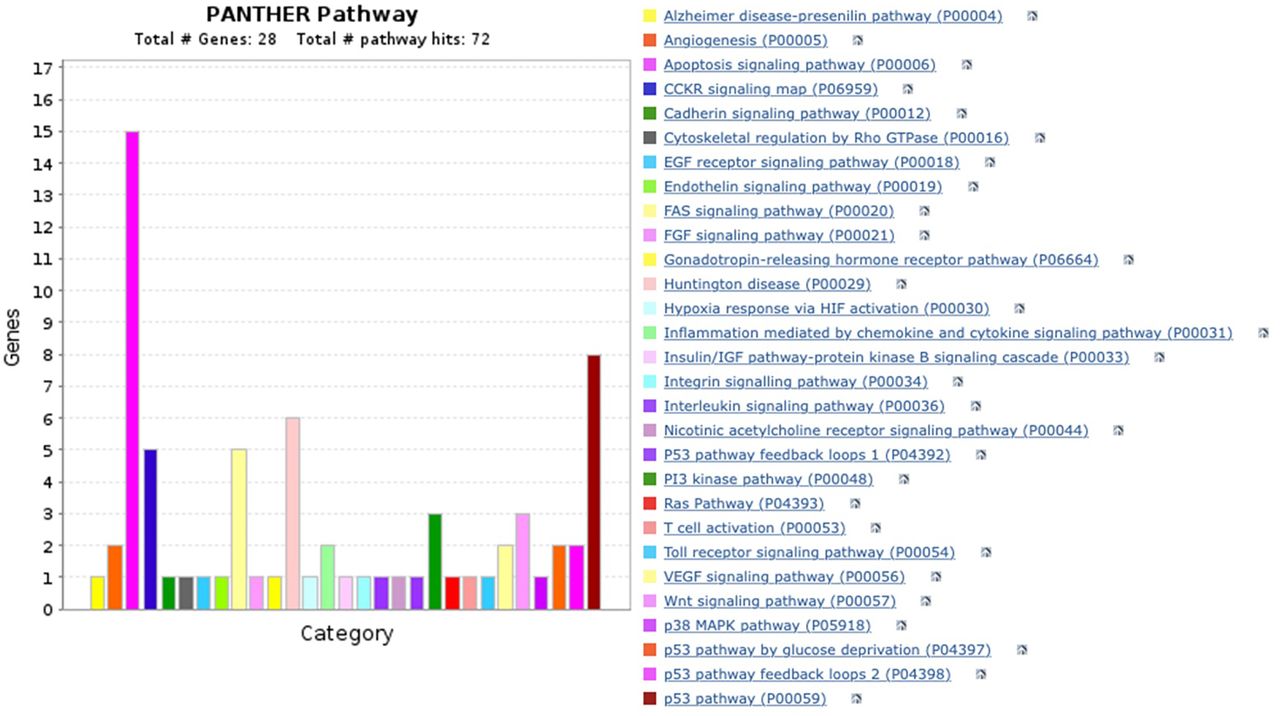
PANTHER pathway analysis. After characterizing the GO analysis, we examined the apoptosis-related genes that contribute to the relevant cellular pathways. We identified 29 pathways using the PANTHER pathway data analysis, including the p53 pathway, angiogenesis, apoptosis signaling pathway, and the Alzheimer’s disease presenilin pathway. As predicted, the apoptosis signaling pathway (p<0.0001) is one of these pathways, involving 15 genes, followed by the p53 pathway (p<0.001) comprising eight genes. Only one gene is involved in each of the 17 pathways, which include the EGF receptor, cadherin, and Alzheimer’s disease presenilin pathway (Figure 6). AKT1 is the most frequent gene involved in 17 various pathways, followed by CASP9 and ACTB, each of them involved in 7 different pathways (Table V).

PANTHER pathway analysis. The height of the bar indicates the number of genes on the corresponding pathways. Colors indicate the specific pathways. After inserting 27 genes, we found 29 various pathways which directly or indirectly contributed to apoptosis.
Apoptosis genes involved in various signaling pathways in the PANTHER pathway analysis.
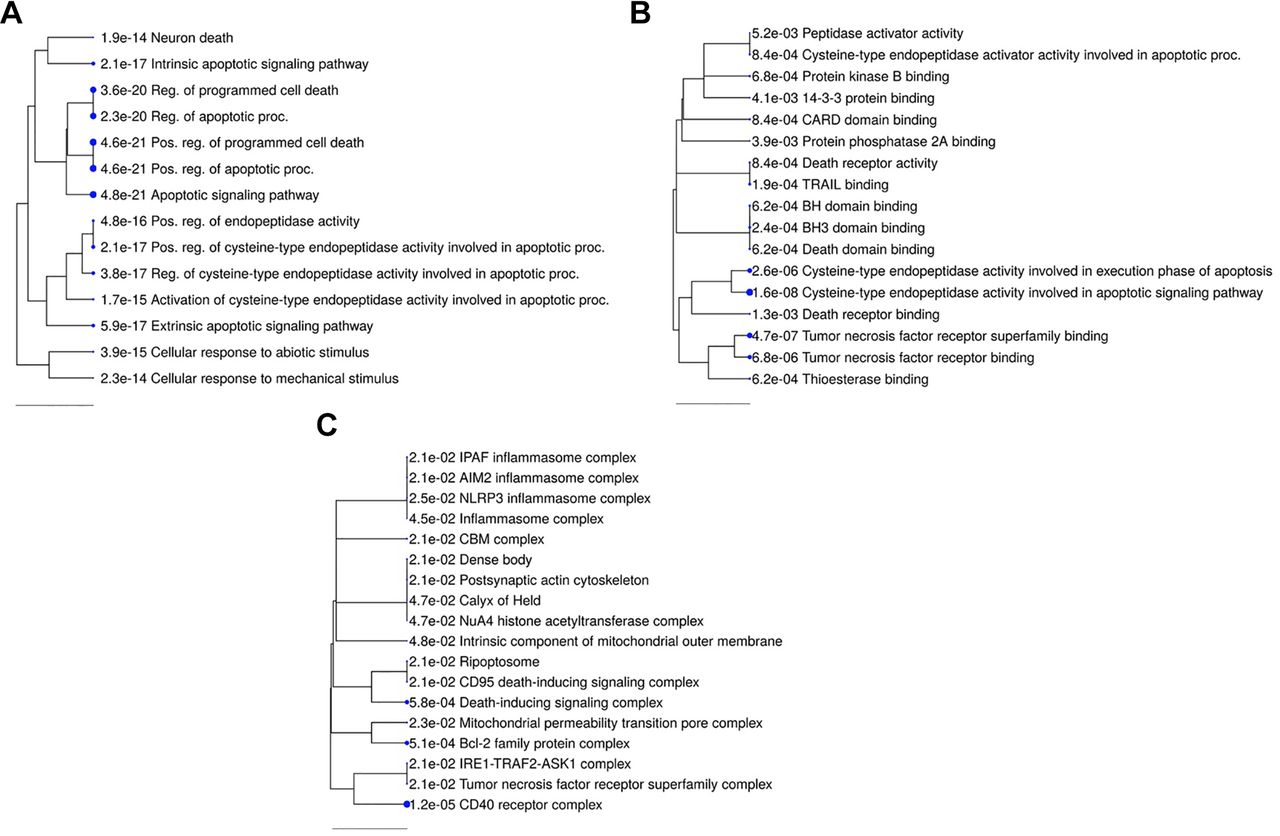
Gene Ontology enrichment analysis. Based on the data, we also conducted a ShinyGO Gene Ontology enrichment analysis employing differentially expressed genes and proteins. Figure 7 provides hierarchal clustering depictions of richer biological processes (A), molecular function (B), and cellular components (C). We found the enrichment of 10 identical biological processes involved in the apoptosis pathways, indicating that similar cellular mechanisms were activated. Regulation of programmed cell death, regulation of the apoptotic process, post-translational regulation of programmed cell death, post-translational apoptotic process, and apoptotic signaling pathway are the most important biological processes, indicated by bigger dots. Cysteine-type endopeptidase activity is involved in the execution phase of apoptosis and apoptotic signaling pathway, and tumor necrosis factor receptor superfamily binding is the most enriched in the molecular function. CD40 receptor complex, Bcl-2 family protein complex, and death-inducing signaling complex are the most significantly enhanced cellular components. The extrinsic apoptosis pathway participates in the biological process along with BAD, BAX, TNFRSF10A, CASP2, TNFRSF10B, TRAF2, CASP9, AKT1, BCL10, MCL1, CASP3, FADD, and DIABLO, whereas the intrinsic apoptosis pathway is composed of BAD, BAX, CASP2, APAF1, TNFRSF10B, TRAF2, CASP9, TP53, AKT1, MCL1, CASP3, BNIP3, DIABLO, and CASP4. The regulation of programmed cell death has the least fold enrichment (11.53). In contrast, cellular response to mechanical stimulus has the highest fold enrichment (94.98) and is followed by activation of cysteine-type endopeptidase activity involved in the apoptotic process (84.43). In contrast, only nine genes regulated the cellular response to mechanical stimuli, whereas 23 genes regulated apoptosis and programmed cell death, respectively (Table VI).

Enriched biological processes, molecular function, and cellular components. Following analysis of the gene array data, significantly enhanced processes are displayed as an interactive hierarchical clustering tree with ShinyGO. (A) Biological processes, (B) molecular function, and (C) cellular components that share a lot of genes tend to group. Larger dots indicate more significant p-values. Following examination of the genes, enriched processes that were similar were highlighted and marked.
The different pathways in the biological processes. False discovery rate (FDR) expresses the enrichment, and the number and names of each gene involved in each pathway are displayed.
Protein-protein interaction (PPI) network construction. Next, we performed a PPI on these apoptosis-regulated genes, which is essential in providing insight into how proteins work and facilitated the ability to model functional pathways and reveal the biological processes’ molecular mechanisms. To construct a PPI network, we used Cystoscope and STRING. Each edge is given a score to serve as the edge weight, which is used to compute the interaction confidence in the network. This rating reflects the assessed likelihood that a specific interaction has biological significance. PPIs with a confidence score greater than 0.7 were chosen to guarantee the quality of interactions and reduce false-positive outcomes. In the STRING database, the PPI data for DEGs in the TNBC cell line indicated 27 nodes and 188 edges (Figure 8A). The 27 apoptosis-regulated genes were clustered into 5 different groups, of which cluster 1 is comprised of five proteins (BCL10, TRAF2, TRAF3, and TNF), whereas cluster 2 is formed by the combination of seven proteins (AKT1, BAX, BAG1, DAPK1, GADD45A, MCL1, and TP53) (Figure 8B). The protein interactions with the highest combined scores (>0.9995) in the analysis of protein connectivity were APAF1 with CASP9 and CASP3, FADD with TNF, TNFRSF11B, and TNFRSF10A, TNF with TRAF2, and BAX with MCL1 (Table VI).

The 27-apoptosis regulation protein-protein interactions (PPIs). Network analysis from the PPI network showed TNBC. (A) Minimum required interaction score: we set up the highest confidence at 0.9000 using Cytoscape. The nodes’ sizes indicated the count of interactions (degree) in the PPI network. There are 188 edges and 27 nodes in the circular structure of the protein-protein interaction, with an average node degree of 13.9 and an average local clustering coefficient of 0.76. The red line indicates the presence of fusion evidence; the green line is neighborhood evidence; the blue line is co-occurrence evidence; the purple line is experimental evidence; the yellow line is text mining evidence; the light blue is database evidence; the black line is co-expression evidence. (B) clustered PPIs. Twenty-seven genes were predicted from a cluster analysis using STRING. Associations within the same cluster are indicated by solid and dotted lines. Different colors denote various types of interactions.
When we examined the PP1s between the genes that regulate apoptosis, AKT1 interacts with CASP3, TP53, TNF, and CASP9 with automated text mining scores of 0.882, 0.877, 0.826, and 0.814, respectively. APAF1 forms an interaction with CASP9, CASP3, BAX, MCL1, and CASP2, with automated textmining scores of 0.995, 0.909, 0.749, 0.721, and 0.715, respectively. TRAF2, BIK, and DAPK1 only interact with TRAF3, MCL1, and TP53, scoring 0.978, 0.82, and 0.919 in automatic textmining tests. Both CASP3 and CASP9 interact with FADD, MCL1, TNF, TNFRSRF10A, and TNFRSF10. Additionally, CASP3 significantly forms PPIs with CASP9, DFFA, and TP53, while CASP9 with DIABLO. Table VII demonstrates the top high score protein-protein interactions.
Protein-protein interactions of the apoptosis regulatory genes having a high score for automated textmining, combined, edge betweenness, and experimentally determined interaction scores.
Functional analysis of the protein network. The GeneMANIA database was used to construct the gene-gene interaction (GGI) network of the genes that regulate apoptosis (Figure 9). A total of 27 genes were inputted, and 20 related genes were enriched in this network based on shared protein domains, predicted, co-localization, physical interactions, co-expression, pathways, and genetic interactions. Physical interaction accounted for around 35.50% of gene-gene interactions, followed by predicted (16.69%) and pathways (14.56%).

Gene-gene interaction network among the apoptosis-regulated genes predicted by GeneMANIA. Different colors indicate various networks of gene-gene interactions. A total of 27 genes were input shown in big blue black color circle, and 20 related genes, shown in the small blue black color circle, were enriched in this network based on shared protein domains with 47 total genes, 0 attributes, and 1411 total links.
Transcription factor PPI analysis. From the results of the transcription factor, PPI analysis shows the number of apoptosis-regulated genes interacting with the transcription factors in Table VIII. In the top 10 transcription factors, the androgen receptor (AR), a nuclear hormone receptor transcription factor, interacts with five apoptosis-regulated genes (p<0.0001; q<0.01), followed by Retinoic Acid Receptor Alpha (RARA) (p<0.0001; q<0.01) and ring finger protein (RNF2) (p<0.0001; q<0.01), each of which interacts with four apoptosis-regulated genes. The most interactive apoptotic-regulated gene, TP53, interacts with seven transcription factors (AR, RNF2, NR4A1, ATF3, TFAP2A, STAT1, and SREBF2), followed by AKT1, which interacts with five (AR, RARA, IRF3, NR4A1, and STAT1), and CASP3, interacts with four (AR, RNF2, TFAP2A, and SREBF2) transcription factors (Table VIII).
Among the 27 genes, the top 10 significant p-values and q-values for transcription factor PPIs are displayed.
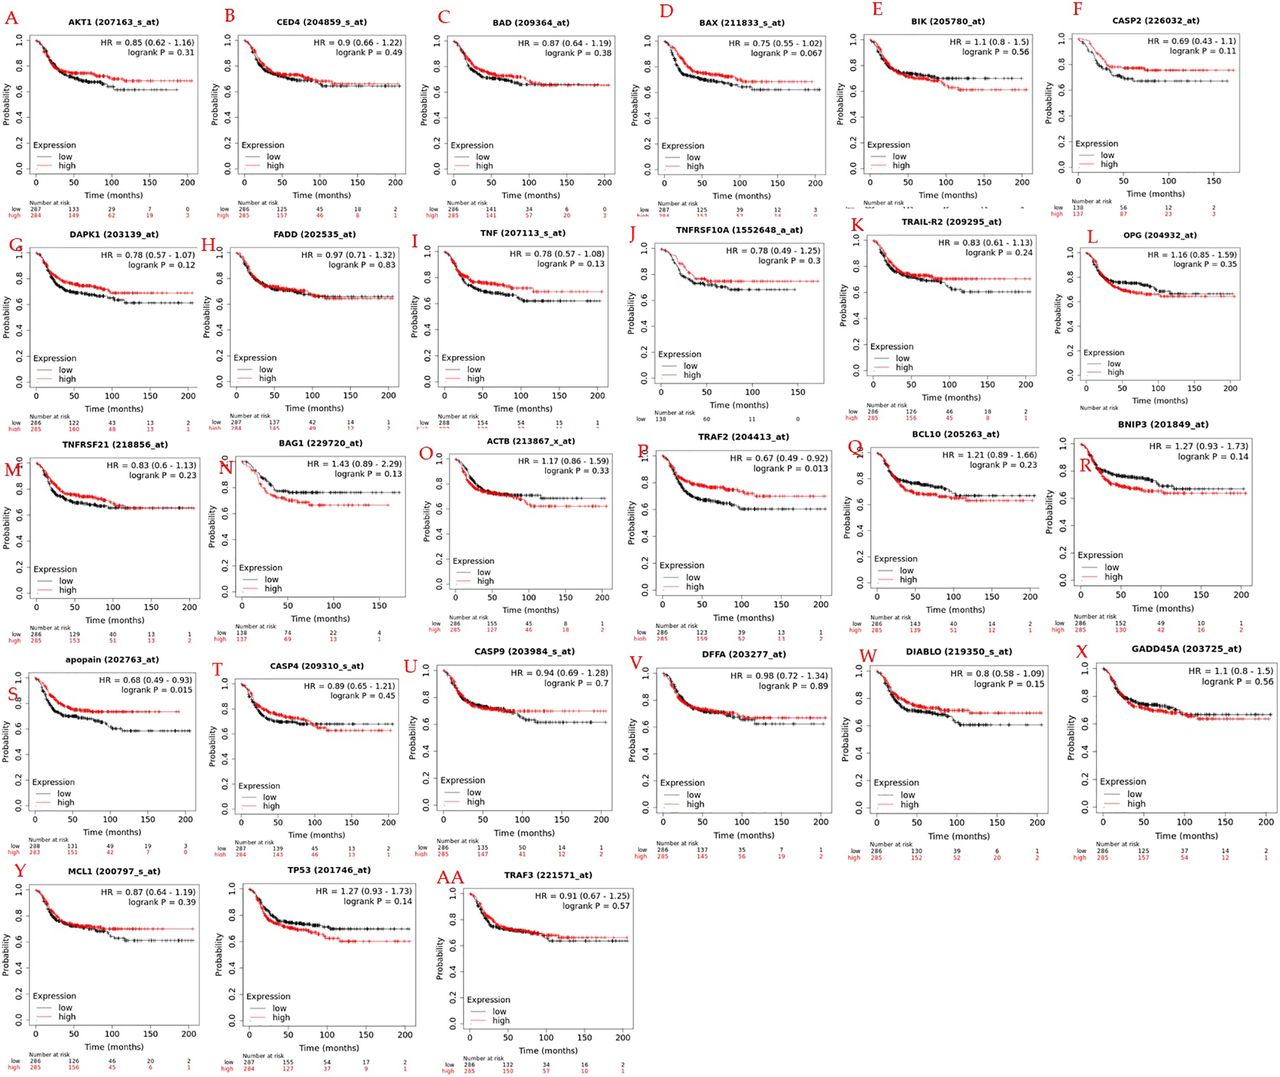
Survival analysis verification of key genes. To verify the therapeutic implications of 27 hub genes, KM Plotter was applied to 278 TNBC patients for OS analysis. Among the 27 pivot genes, the survival rate of CASP2, CASP3, DAPK1, TNF, TARF2, and TRAF3 in the OS analysis was significantly different between the high and low expression groups (p<0.05, Figure 10A-F). OS in months of TNBC patients having increased expression of these six important genes are 85.2, 97.48, 95.08, 98.14, 85.2, and 98.14 for CASP2, DAPK1, TRAF2, TNF, CASP3 and TRAF3 respectively with their corresponding low expression of 44.4, 37.64, 48, 47.51, 0.77 and 44.4 months, respectively.

Overall survival (OS) analysis of 27hub genes in TNBC patients by KM Plotter (n=278). (A) CASP2, (B) DAPK1, (C) TNF, (D) TRAF2, (E) APONON/CASP3, (F) TRAF3, (G) AKT1, (H) CED4/APAF1, (I) FADD, (J) BAD, (K) TNFRSF10A, (L) DFFA, (M) TRAIL-R2/TNFRSF10B, (N) OPG-TNFRSF11B, (O) TNFRSF21, (P) BAG1, (Q) ACTB, (R) DIABLO, (S) BAX, (T) BCL10, (U) BNIP3, (V) BIK, (W) CASP4, (X) GADD45A, (Y) MCL1, (Z) TP53, (AA) CASP9.
Protein expression for validation of key genes in breast carcinoma. We examined immunohistochemistry images of human normal and BC tissues stained with antibodies against the TRAF2, TRAF3, DAPK1, CASP2, CAPS3, and TNF protein from the Human Protein Atlas (https://www.proteinatlas.org/, accessed on December 12, 2022), to validate the gene-expression data. In contrast to BC tissues, which had a mixed response of “no detected” or “low” staining with “negative or low” intensities, all normal tissues were reported to have “moderate, medium, or strong” staining with “strong or moderate” intensities (Figure 11A-F). This suggests that breast carcinomas have no, low or moderate levels of the proteins TRAF2, TRAF3, DAPK1, CASP2, CAPS3, and TNF.

Breast cell cancer selected protein expression. (A-F) Immunohistochemistry showing the expression of theTRAF2, TRAF3, DAPK1, TNF, CASP2 and CASP3 proteins in normal breast tissue and breast cancer as shown on the Human Protein Atlas website.
Discussion
Triple-negative breast cancer (TNBC) is regarded as an aggressive type of BC. It is characterized by the lack of expression of progesterone, estrogen, and human epidermal growth factor receptors, which accounts for 15-20% of all BCs (46). TNBC has historically had limited treatment options compared to other BC types. Even though chemoresistance and undesired side effects are the primary problems, the mainstay of treatment for TNBC remains chemotherapy, despite the emergence of new biological and targeted agents.
One of the main goals of cancer research is to identify genetic markers associated with the onset of cancer. Targeting genes only expressed in cancer cells can reveal novel diagnostic and therapeutic indicators (47). It is preferable to incorporate data from numerous comparable studies to undertake an integrative analysis to find and define the biological functions of cancer-associated genes. Multiple gene expression analysis methods have been created and employed for many purposes, including classifying tumor types and identifying tumor stages. Because of the limits of clinicopathologic characteristics, predicting the potential therapeutic genes of cancer is still difficult for many malignancies, which is important for cancer management. Identification of gene expression profiles can aid in the improvement of patient care by offering directions for individualized treatment strategies (48). Twenty-seven apoptosis-regulated genes were included for statistical comparison in the current study. It was possible to identify statistically significantly expressed genes in TNBC using various online bioinformatic tools. An extensive bioinformatics investigation of these genes identified critical biological functions enriched in them. Further research into the biology of TNBC will benefit from these expanded functionalities or pathways, which may also pave the path for developing novel diagnostic and therapeutic markers.
Gene expression of BNIP3, TNFRSF10B, MCL1, and CASP4 was up-regulated in BCGM and down-regulated in UALCAN. At the same time, BIK, AKT1, BAD, FADD, DIABLO, and CASP9 were down-regulated in BCGM and up-regulated in UALCAN databases. These differences may demonstrate the distinct gene expression patterns of TNBC patients, which require further research.
Understanding the role of PPI in inhibiting apoptosis could provide a foundation for understanding the biology of cancer as an integrated system (49). Numerous studies have used PPI networks to identify potential genes (50-52). Most biological networks are scale-free networks, meaning they are characterized by having innumerable hubs with many interactions. Several protein-protein interactions are required for the activation of caspases, which are essential for apoptosis. For instance, procaspase-8, the adaptor molecule Fas-associated protein with death domain (FADD), and caspase-8 sequentially oligomerize to activate caspase-8, whereas procaspase-9 is triggered by the interaction of at least cytochrome c, Apaf-1, and caspase-9 to create an apoptosome (53), the PPI data can be used in conjunction with GO functional analysis (52, 54, 55).
Furthermore, GO functional analysis also demonstrated that the DEGs were mainly involved in cellular processes, biological regulation, response to stimulus, biological adhesion, metabolic process, and cell-cell signaling based on the analysis of biological processes. Gene expression regulation, protein modification, or interaction with a protein or substrate molecule are just a few of the ways that biological processes are regulated. Cellular processes, stimulus-response, biological regulation, and cell signaling make up 75.5% of all biological processes. TRAF3, TNFRSF10A, BAX, DIABLO, BCL10, TNFRSF10B, MCL1, TRAF2, CASP9, DAPK1, AKT1, BNIP3, and TNF are all considerably enriched in all of them. These processes are regulated in various ways, such as through altering the expression of genes, altering protein expressions, or interacting with proteins (56). Binding and catalytic activity contribute to 66.6% of the molecular function, as indicated in Table IV. Except for BCL10 and TRAF2, which are present in both, binding is enriched for BAX, MCL1, ACTB, TP53, BAG1, and TNF, whereas catalytic activity is enriched for CASP2, CASP4, CASP9, DAPK1, CASP3, and AKT1. Cellular anatomical entities make up 82.2% of the cellular components that are enriched in TRAF3, TNFRSF10A, BAX, DIABLO, BCL10, CASP2, GADD45A, TNFRSF21, TNFRSF10B, CASP4, MCL1, TRAF2, CASP9, DAPK1, CASP3, ACTB, BNIP3, BAG1, and TNF. The molecular function and cellular component have played a significant role in regulating apoptosis (57). The genes mentioned above in the molecular and cellular components may have a direct or indirect role in controlling their specific role in apoptosis.
Transcription factors (TFs) are significant regulators of tissue growth and embryonic development, processes that, if controlled improperly, can lead to cancer and other diseases. TFs also play critical roles in regulating various cellular functions (58). Therefore, establishing a systems-level understanding of the TF network would provide a crucial foundation for future research and therapeutic methods. In our analysis, AR, RARA, RNF2, IRF3, Tp53, NR4A1, ATF3, TFAP2A, STAT1, and SREBF2 were the top 10 TF interactors that were most frequently seen. Out of the 27 investigated genes, the following apoptotic genes have been associated with these TFs: CASP3, BAG1, AKT1, TP53, ACTB, APAF1, GADD45A, CASP9, TRAF3, BAX, DIABLO, DAPK1, TNFRSF10B, and FADD. TP53 is the most frequently apoptosis-regulated gene that interacts with the seven TF listed above.
Our findings demonstrated that AR binds TP53, ACTB1, BAG1, AKT1, and CASP3. Previous research showed that the JNK kinase MEKK1, which induces apoptosis in prostate cancer cells, is regulated by the activation of the AR (59). Similar studies revealed that in transgenic mice and cultured cells, AR-dependent apoptosis was seen after the probasin promoter directed the AR to the prostate cancer cells (60). Both AR-dependent and AR-independent pathways can be used by several substances to cause apoptosis. Because the AR is believed necessary for nuclear DHT function, ligand-dependent events coincide with AR-mediated nuclear events (61). As a result, the current research shows that apoptosis genes may control apoptosis in TNBC by activating or deactivating in response to interaction with the AR transcription factor; however, more research is required.
RARA has been shown to regulate the cell cycle and proliferation and initiate and control apoptosis in breast and pancreatic cancer cells (62, 63). Other studies confirmed that RARA caused apoptosis in leukemic cells by reducing Bcl-2 expression (62) and by enhancing TRAIL in human non-small cell lung cancer and head and neck squamous cell carcinoma (HNSCC) cell lines (64). In line with these findings, RARA has been found to down-regulate Bcl-2 expression in acute promyelocytic and myeloid leukemia cancer cells, and sustained overexpression of Bcl-2 has been demonstrated to confer resistance to apoptosis (65). These results imply that RARA interacts with apoptosis-regulated genes, which may be related to increased or suppressed apoptosis in TNBC.
According to our results, RNF2 interacts with CASP3, CASP9, TP53, and ACTB. In a wide range of cancer types, including breast, ovarian, pancreatic, bladder, melanoma, and lymphoma, RNF2 has been reported to be highly expressed (66-68). RNF2 expression is positively correlated with tumor progression and shortened survival. Hence, RNF2 is thought to be a potential therapeutic target for these cancer types. Furthermore, research has shown that RNF2 knockdown causes cell cycle arrest, triggers apoptosis, and inhibits proliferation in prostate cancer cells (69). Studies on colorectal cancer cells showed that RNF2 binds to p53 directly and encourages p53 ubiquitination, which prevents apoptosis. Similarly, in RNF2-knocked down cells, p53 protein levels were higher, its half-life was longer, and its ubiquitination was lower. In contrast, p53 protein levels, half-lives, and ubiquitination were all lowered in cells overexpressing RNF2 (70). Our findings imply that RNF2 may contribute to TNBC progression by preventing gene expression in apoptosis, including TP53 and caspases, and it might be an ideal target for TNBC prevention or treatment.
According to previous studies, IRF3 induced apoptosis in BC cells (71), and IRF3 signaling is essential for triggering apoptosis in hormone-sensitive prostate cancer cells by activating intrinsic and extrinsic apoptotic pathways (72). On the other hand, clear cell renal cell carcinoma abundantly expressed IRF3, and its overexpression was strongly associated with worse clinical outcomes and overall adverse survival (73). Increasing proapoptotic protein expression in BC cells increases cytoplasmic NR4A1 and contributes to the process of apoptosis (74). ATF3 is a significant regulator of Kruppel-like factor 6-induced apoptosis in prostate cancer cells (75) and enhances doxorubicin-induced apoptosis in TNBC cells (76). In BC cells, STAT1 has been associated with the suppression of cell growth and apoptosis induction (77).
Similarly, STAT1 modulates chemotherapy-induced apoptosis in MDA-MB 435 BC cells (78). Up-regulated SREBP1 expression promotes breast cancer cell growth and proliferation, is positively correlated with tumor metastasis, and predicts a poor progression in individuals with breast cancer (79, 80). SREBP1 activation has been seen in human glioblastoma cell lines (81). Additionally, research has indicated that men with prostate cancer had higher levels of SREBP1 expression (82). Taken together, these TFs may be a promising target for TNBC treatment and prevention since they may directly or indirectly influence the progression of TNBC by regulating the expression of genes that control apoptosis.
On MDA-MB-231 and MDA-MB-468 triple-negative breast cancer cells, muscadine grape extracts showed substantial anticancer activity (83). Previous studies demonstrated that various natural compounds have significantly targeted apoptosis-regulated genes. In TNBC, several natural compounds target some of these apoptosis-regulated genes, which may be useful to consider as alternative compounds for chemoprevention. In MDA-MB-231 and MDA-MB-468 TNBC cells, thymoquinone fundamentally altered the expression of numerous apoptotic genes, increased mRNA levels of caspases (CASP 2, 3, 6, 9), BAX, BID, BIK, APAF1, and GADD45A, while down-regulating BIRC5 (7); it also significantly altered several oxidative stress-regulated genes (84, 85). Similar to our previous studies, the natural compound polyphenol gossypol dramatically increased the expression of GADD45A, TNFRSF9, and BNIP3 in MDA-MB231 cells, whereas GADD45A and BNIP3 were increased in MDA-MB468 cells (86). Similarly, curcumin, a well-known natural compound, significantly enhanced Pacilitaxel’s ability to induce apoptosis in TNBC cells by up-regulating CASP3, 8-TP53, BAD, and BAX while down-regulating BCL2 (87, 88). Other comparable studies found that resveratrol dramatically boosted the expression of cleaved-PARP1 and cleaved-Caspase3 while considerably decreasing the expression of full-length PARP1, PCNA, and BCL-2 in MDA-MB-231 TNBC cells (89). Similar studies on natural compounds reported that rosmarinic acid dramatically increased BNIP3’s mRNA expression in the MDA-MB-231 cell line while considerably increasing the transcription of TNF, GADD45A, and BNIP3 in the MDA-MB-468 cell line. Additionally, rosmarinic acid suppressed the expression of TNFRSF11B in MDA-MB-231 cells and TNFSF10 and BIRC5 in MDA-MB-468 cells (8). Another study found that oleuropein significantly activated the transcription of the genes BNIP3, BID, GADD45A, FADD, and TNFRSF21 in MDA-MB-468 cells, while substantially increasing the mRNA expression of TNFRSF10A and CASP4 in MDA-MB-231 cells (9). Similarly, Snail mucus can induce programmed cell death and has therapeutic potential by achieving a chemosensitizing effect in TNBCs (90). These results might imply that natural compounds that target apoptosis-regulated genes could be exploited to be used for chemoprevention or to increase the effectiveness of chemotherapy treatments.
Concerning the study’s limitations, the findings here, like those of other bioinformatic analyses, need to be verified through extensive experimental approaches. TNBC patients have distinct gene expression patterns that limit us from drawing a firm conclusion about our results. Additionally, combining several datasets associated with apoptosis-regulated genes is recommended to acquire a deeper understanding of the underlying mechanisms of TNBC.
Conclusion
The mechanism of programmed cell death is driven by a highly controlled network of protein-protein interactions. Controlling the outcome of these interactions offers great benefits in treating many human diseases, including cancer. Understanding the basis of these interactions is key to uncovering the gap in the treatment of TNBC. Extensive studies would increase knowledge of the pathogenesis of advanced TNBC and divulge several useful apoptosis-related genes and pathways for further research on their therapeutic implications. We were able to identify crucial PPIs, TF-PPIs, and pathways that can be utilized in TNBC studies. To corroborate the function of the identified genes associated with TNBC, more molecular biological tests, computational procedures, and gene co-expression network analyses are needed. Due to TNBC’s heterogeneity and histologic classification, each TNBC subtype should be analyzed and interpreted independently. Important genes and pathways for normal and tumor samples were found in this instance, allowing the determination of various stages of TNBC progression. Finding genetic or protein alterations may enable researchers to develop new targeted therapies. Researching genetic or protein changes can contribute to predicting whether a person with cancer will likely have a better or worse prognosis. The analysis of genes involved in apoptosis regulation revealed potential TNBC therapeutic targets. Genes, in particular CASP2, CASP3, DAPK1, TNF, TRAF2, and TRAF3, are significantly correlated with poor overall survival in TNBC and may offer new candidate molecules for targeted therapy. These findings show that genetic alterations altering apoptosis could be possible therapeutic targets for TNBC. The six important genes found in this study may help us better understand the molecular mechanisms causing TNBC and facilitate the search for novel treatment targets for TNBC.
Acknowledgements
We thank The Title III program. This research was supported by the National Institute of Minority Health and Health Disparities of the National Institutes of Health through Grant Number U54 MD 007582 and Grant Number P20 MD006738.
Footnotes
Conflicts of Interest
The Authors declare no conflicts of interest.
Authors’ Contributions
Conceptualization, GMA and KFAS; methodology, GMA; formal analysis, GMA; resources, KFAS; Investigation, GMA; data curation, GMA; writing—original draft preparation, GMA.; writing—review and editing, KFAS, GMA, SSM, ET, and SAA; visualization, KFAS, GMA, SSM, ET, and SAA; supervision, SSM and KFAS; project administration, KFAS; funding acquisition, KFAS. All Authors have read and agreed to the published version of the manuscript.
- Received January 11, 2023.
- Revision received February 9, 2023.
- Accepted February 19, 2023.
- Copyright © 2023, International Institute of Anticancer Research (Dr. George J. Delinasios), All rights reserved
This article is an open access article distributed under the terms and conditions of the Creative Commons Attribution (CC BY-NC-ND) 4.0 international license (https://creativecommons.org/licenses/by-nc-nd/4.0).
References
In this issue


Jump to section
Related Articles
Cited By...
- No citing articles found.