


Abstract
Background/Aim: Structural abnormalities of chromosome bands 8q11-13, resulting in rearrangement of the pleomorphic adenoma gene 1 (PLAG1), are known to characterize lipoblastoma, a benign fat cell tumor, found mainly in children. Here, we describe 8q11-13 rearrangements and their molecular consequences on PLAG1 in 7 lipomatous tumors in adults. Materials and Methods: The patients were 5 males and 2 females between 23 and 62 years old. The tumors, namely five lipomas, one fibrolipoma and one spindle cell lipoma, were examined using G-banding with karyotyping, fluorescence in situ hybridization (FISH; three tumors), RNA sequencing, reverse transcription (RT) PCR, and Sanger sequencing analyses (two tumors). Results: All 7 tumors had karyotypic aberrations which included rearrangements of chromosome bands 8q11-13 (the criterion for selection into this study). FISH analyses with a PLAG1 break apart probe showed abnormal hybridization signals in both interphase nuclei and on metaphase spreads indicating PLAG1 rearrangement. RNA sequencing detected fusion between exon 1 of heterogeneous nuclear ribonucleoprotein A2/B1 (HNRNPA2B1) and exon 2 or 3 of PLAG1 in a lipoma and fusion between exon 2 of syndecan binding protein (SDCBP) and exon 2 or 3 of PLAG1 in a spindle cell lipoma. The HNRNPA2B1::PLAG1 and SDCBP::PLAG1 fusion transcripts were confirmed using RT-PCR/Sanger sequencing analyses. Conclusion: As 8q11-13 aberrations/PLAG1-rearrangements/PLAG1-chimeras may evidently be a defining pathogenetic feature of lipogenic neoplasms of several histological types and not just lipoblastomas, we suggest that the term “8q11-13/PLAG1-rearranged lipomatous tumors” be generally adopted for this tumor subset.
- Chromosome band 8q11-13
- pleomorphic adenoma gene 1
- PLAG1 fusion genes
- HNRNPA2B1::PLAG1
- SDCBP::PLAG1
- lipoma
- lipoblastoma
- lipomatous tumors
The pleomorphic adenoma gene 1 (PLAG1), which is located in chromosome subband 8q12.1, was initially found to be rearranged in pleomorphic adenomas carrying the reciprocal chromosome translocation t(3;8)(p22;q12). The translocation resulted in fusion of PLAG1 with the catenin beta 1 (CTNNB1) gene from 3p22.1, generating two reciprocal chimeras, CTNNB1::PLAG1 and PLAG1::CTNNB1 (1). The fusion points were in the 5′-end non-coding regions of both genes bringing the coding sequence of PLAG1 under the control of the CTNNB1 promoter whereas the coding region of CTNNB1 came under the control of the PLAG1 promoter. The result was high expression of PLAG1 and reduced expression of CTNNB1 (1). Subsequently, numerous chimeras in which PLAG1 is the 3′-end partner gene have been described in various tumors (2-11). As a consequence, the PLAG1 gene becomes either overexpressed or activated resulting in deregulation of the genes it targets, ultimately leading to tumor development (12-16).
In adipocytic neoplasms, structural abnormalities of chromosome bands 8q11-13 resulting in rearrangement of PLAG1 are recognized as the genetic hallmarks of lipoblastomas, i.e., benign, predominantly pediatric neoplasms composed of embryonal white fat (4, 5, 7, 9, 17-20). The vast majority of lipoblastomas are found before the age of three years (19, 20). Only a few lipoblastomas have been described in adolescents, and even fewer in adults (17, 18, 21-23).
In addition to lipoblastomas, structural abnormalities of chromosome bands 8q11-13 have also been reported in other lipomatous tumors, namely eight lipomas, two atypical lipomas/well differentiated liposarcomas, and one hibernoma (Table I) (24-31). In a well differentiated liposarcoma and a lipoma, these chromosomal changes were demonstrated to correspond to PLAG1 rearrangements (28, 29). In the present study, we report another 7 lipomatous tumors carrying 8q11-13 structural chromosomal rearrangements and describe their molecular consequences on the PLAG1 gene.
Lipomatous tumors reported with structural chromosome rearrangements involving bands 8q11-13.
Materials and Methods
Materials. Information about patients’ sex and age, diagnosis, and tumor locations is given in Table II. There were 5 males and 2 females between 23 and 62 years old. The diagnosis was lipoma (5 cases), fibrolipoma (1 case), and spindle cell lipoma (1 case). As part of this study, all tumors were re-evaluated by an experienced sarcoma pathologist (IL). The study was approved by the Regional Ethics Committee (Regional komité for medisinsk forskningsetikk Sør-Øst, Norge, http://helseforskning.etikkom.no). All patient information has been de-identified.
Clinicopathological data, karyotypes, interphase FISH results of the PLAG1 and HMGA2, and PLAG1-fusion transcripts in seven lipomatous tumors.
G-Banding and karyotyping. As part of our diagnostic routine, fresh tissues from a representative area of resected tumors were received and analyzed cytogenetically. The methodology for cytogenetic investigation of solid tumors was described elsewhere (32). In brief, the samples were disaggregated mechanically and enzymatically with collagenase II (Worthington, Freehold, NJ, USA) and the resulting cells were cultured and harvested using standard techniques (33, 34). Chromosome preparations were G-banded with Wright’s stain (Sigma-Aldrich; St Louis, MO, USA) and examined. Metaphases were analyzed and karyograms prepared using the CytoVision computer assisted karyotyping system (Leica Biosystems, Newcastle, UK). The karyotypes were described according to the International System for Human Cytogenomic Nomenclature (35).
Fluorescence in situ hybridization (FISH) analysis. Homemade break-apart PLAG1 and HMGA2 probes were used. The probes were made from commercially available bacterial artificial chromosomes (BAC) purchased from BACPAC Resource Center operated by BACPAC Genomics, Emeryville, CA, USA (https://bacpacresources.org/). The BAC probes were based on the contigs used to construct the GRCh38 (hg38) genome assembly (Table III). The FISH probes were prepared from bacteriophage Phi29 DNA polymerase-amplified BAC DNAs using previously described methodology and kits for DNA isolation, amplification, labelling, and hybridization according to the manufacturers’ recommendations (36-38). In brief, single isolated bacterial colonies were grown in 5 ml Luria-Bertani (LB) broth medium overnight, and BAC DNA was purified using the QIAprep Spin Miniprep Kit together with Qiacube (Qiagen, Hilden, Germany). After purification, BAC DNAs were amplified with Phi29 DNA polymerase using the GenomiPhi V2 DNA Amplification kit (Cytiva, Marlborough, MA, USA). Subsequently, the Phi29 amplified DNA was labelled and hybridized using Abbott’s nick (Abbott Molecular, Des Plaines, IL, USA) translation kit according to the manufacturer’s recommendations (36). The centromeric, proximal part of probes of both PLAG1 and HMGA2 genes were labelled with Texas Red-5-dCTP (PerkinElmer, Boston, MA, USA) in order to obtain a red signal. The telomeric, distal part of the probes was labelled with fluorescein-12-dCTP (PerkinElmer) in order to obtain a green signal. FISH mapping of the probes on normal controls was performed to confirm their chromosomal location. Chromosome preparations were counterstained with 0.2 μg/ml 4′,6-diamidino-2-phenylindole (DAPI) and overlaid with a 24×50 mm2 coverslip. Fluorescent signals were captured and analyzed using the CytoVision system (Leica Biosystems).
BAC probes used for fluorescence in situ hybridization (FISH) experiments in order to detect rearrangements of the pleomorphic adenoma gene 1 (PLAG1) and the high-mobility group AT-hook 2 (HMGA2) gene. The positions of the PLAG1 and HMGA2 genes are also given.
RNA sequencing. Total RNA was extracted from frozen tumor tissue adjacent to that used for cytogenetic analysis and histologic examination using the miRNeasy Mini Kit (Qiagen) and 1 μg of RNA was sent to the Genomics Core Facility at the Norwegian Radium Hospital, Oslo University Hospital for high-throughput paired-end RNA-sequencing. The FASTQC software was used for quality control of the raw sequence data (available online at: http://www.bioinformatics.babraham.ac.uk/projects/fastqc/). Fusion transcripts were found using the FusionCatcher software (39).
Reverse transcription (RT) PCR and Sanger sequencing analyses. The primers used for PCR amplifications are shown in Table IV. The methodologies for cDNA synthesis and RT-PCR amplification are described elsewhere (8, 40, 41). 3 μl of the PCR products were stained with GelRed (Biotium, Hayward, CA, USA), analyzed by electrophoresis through 1.0% agarose gel, and photographed. Gel electrophoresis was performed using lithium borate buffer (42). The remaining PCR products were purified using the MinElute PCR Purification Kit (Qiagen) and cloned into the pCR4-TOPO vector using TOPO TA Cloning Kit for Sequencing, according to the manufacturer’s recommendations (ThermoFisher Scientific, Waltham, MA, USA). Single isolated bacterial colonies were picked and cultured overnight in 5 ml LB broth medium. Plasmid DNAs were isolated using QIAprep Spin Miniprep Kit together with Qiacube (Qiagen) and sequenced using T3 and T7 primers. Sequencing was run on the Applied Biosystems SeqStudio Genetic Analyzer system (ThermoFisher Scientific). The basic local alignment search tool (BLAST) was used to compare the sequences which were obtained by Sanger sequencing with the NCBI reference sequences NM_002655.2 (Pleomorphic adenoma gene 1, PLAG1), NM_002137.4 (heterogeneous nuclear ribonucleoprotein A2/B1, HNRNPA2B1), and NM_005625.4 (syndecan binding protein, SDCBP) (43). They were also aligned on the Human GRCh37/hg19 assembly using the BLAST-like alignment tool (BLAT) and the human genome browser hosted by the University of California, Santa Cruz (44, 45).
Designation, sequence (5′->3′), and position in reference sequences of the forward (F) and reverse (R) primers of the pleomorphic adenoma gene 1 (PLAG1), heterogeneous nuclear ribonucleoprotein A2/B1 (HNRNPA2B1), and the syndecan binding protein (SDCBP) genes, which were used for polymerase chain reaction amplification.
Results
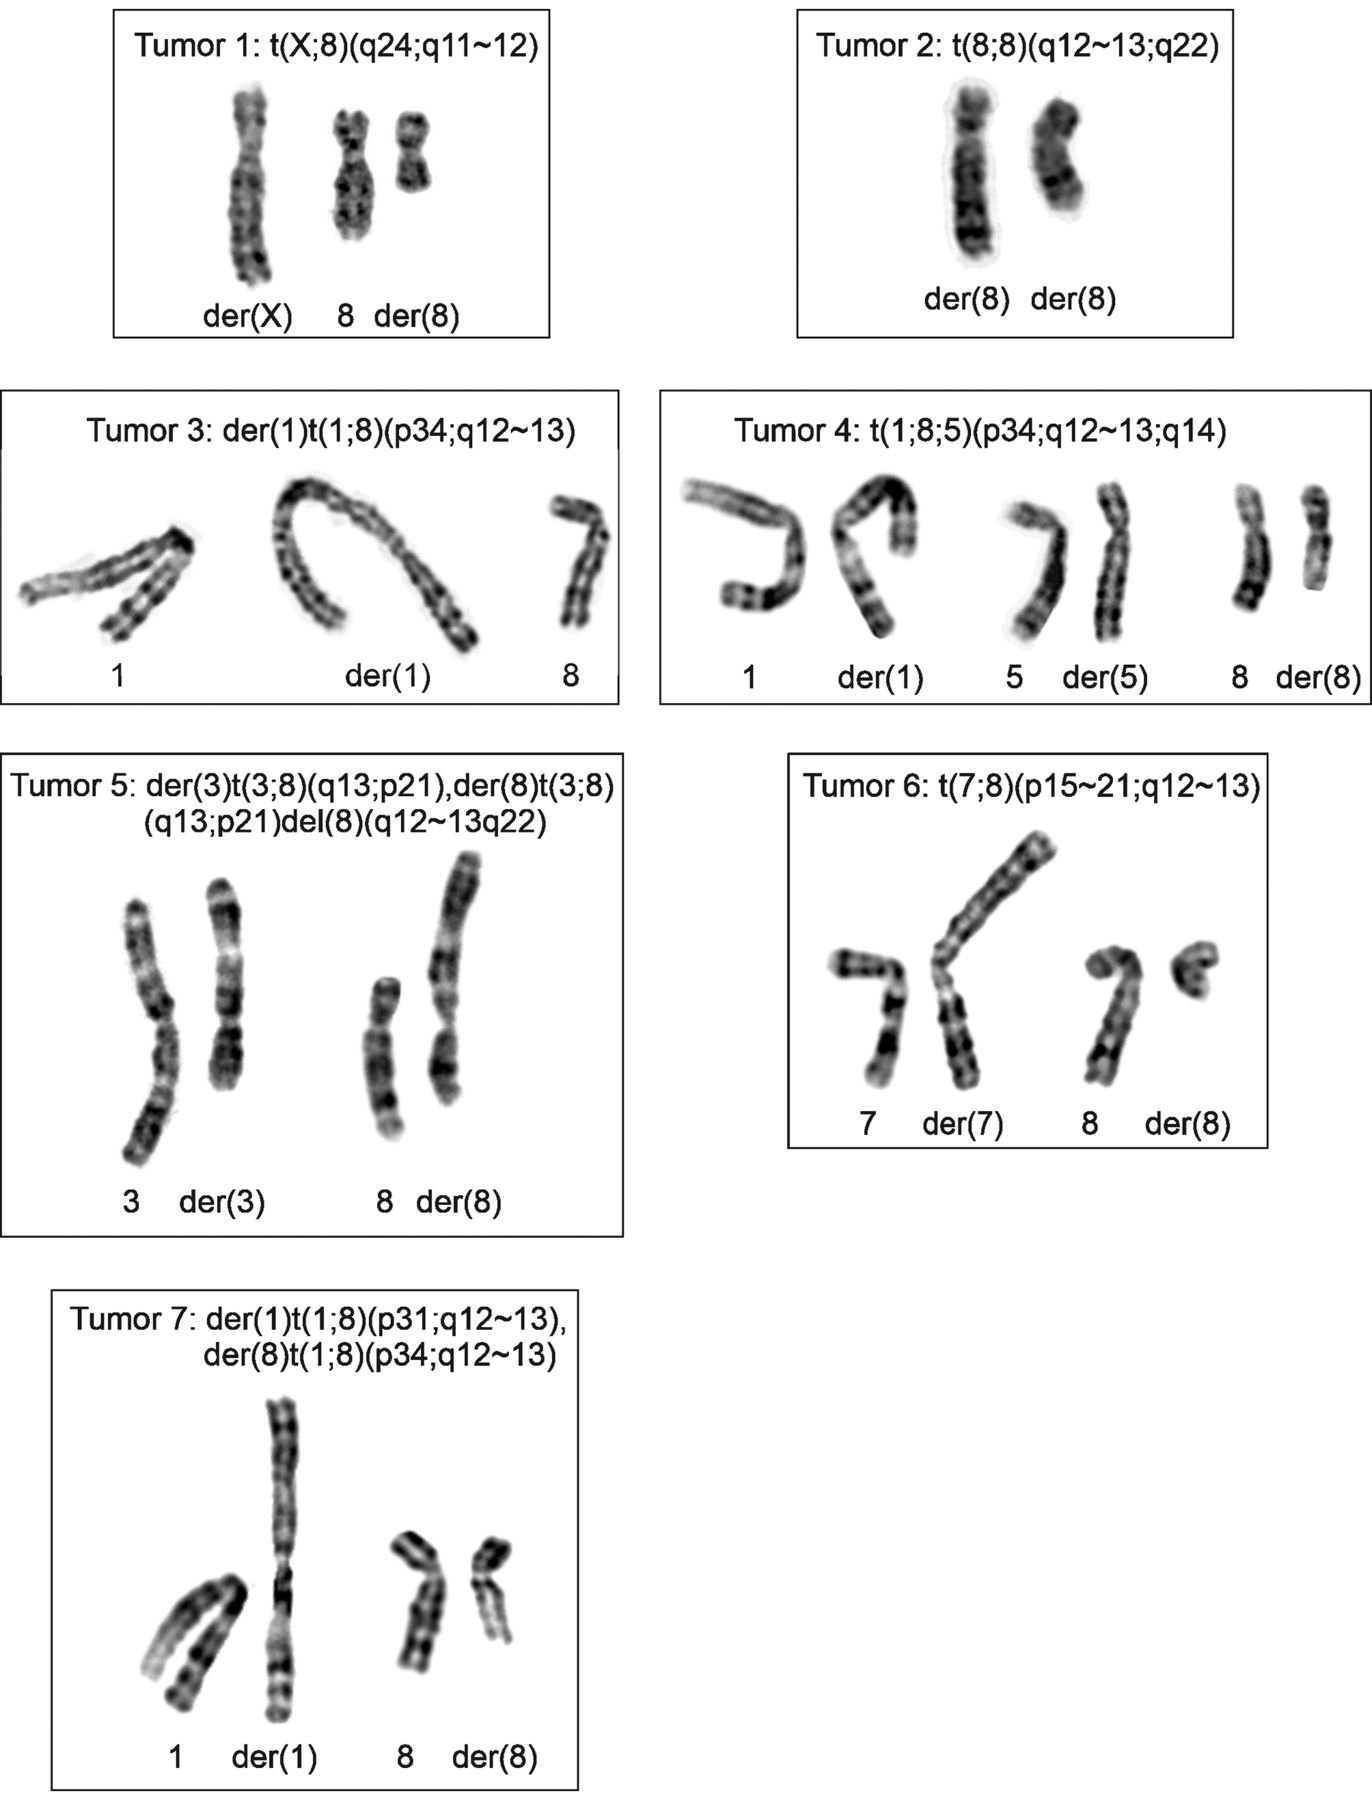
Karyotyping. All tumors had cells carrying clonal chromosomal aberrations (Table II). The abnormal karyotypes were pseudo- or near-diploid and had aberrations involving chromosome bands 8q11-q13 (Figure 1; this was the basis on which the cases were selected). No two tumors were karyotypically identical. Nevertheless, in tumors 3, 4, and 7, recombination between bands p31-34 on the short arm of chromosome 1 and 8q11-13 had occurred (Table II, Figure 1). Three tumors (numbers 1, 2, and 6) had a simple balanced translocation, one tumor (number 4) had a seemingly balanced three-way translocation, whereas three tumors (numbers 3, 5, and 7) carried unbalanced translocations (Table II). Figure 1 shows partial karyograms for tumors 1 to 7 demonstrating their 8q11-13 rearrangements.

Cytogenetic analysis of lipomatous tumors. Partial karyotypes showing 8q11-13 abnormalities. The derivative (der) chromosomes together with the corresponding normal chromosome homologs are shown. For tumor 1, the der(X)t(X;8)(q24;q11∼12) and der(8) t(X;8)(q24;q11∼12) together with chromosome 8 are shown. For tumor 2, both der(8) chromosomes of the translocation t(8;8)(q12∼13;q22) are shown. For tumor 3, the der(1)t(1;8)(p34∼35;q11) together with chromosomes 1 and 8 are shown. For tumor 4, der(1), der(5), and der(8) of t(1;8;5)(p34;q12∼13;q15) together with chromosomes 1, 5, and 8 are shown. For tumor 5, der(3)t(3;8)(q13;p21),der(8)t(3;8)(q13; p21)del(8)(q12∼13q22) together with chromosomes 3 and 8 are shown. For tumor 6, der(7) t(7;8)(p15∼21;q12∼13) and der(8)t(7;8)(p15∼21;q12∼13) together with chromosomes 7 and 8 are shown. For tumor 7 der(1)t(1;8)(p31;q12∼13) and der(8)t(1;8)(p34;q12∼13) together with chromosomes 1 and 8 are shown.
FISH analysis. Cells for FISH analyses were available for three tumors (numbers 2, 3, and 4). The results are presented in Table II. In tumor 2, 48 out of 100 examined interphase nuclei showed a split of the PLAG1 break-apart probe (Table III, Figure 2A). FISH on metaphase spreads showed that the proximal red part of the PLAG1 break-apart probe (Figure 2A) hybridized to the short der(8), whereas the distal green part of the probe hybridized to the long der(8) (Figure 2B). In tumor 3, 67 out of 100 examined interphase nuclei lacked the proximal red part of the PLAG1-probe (Table III). Loss of the proximal red part of the probe (Figure 2A) was also found in metaphase spreads whereas the distal green part of the probe hybridized to der(1) (Figure 2A and B). In tumor 4, loss of the distal green signal of the probe was found in 100 out of 107 interphase nuclei (Table III). FISH on metaphase spreads showed that the proximal red part of the probe hybridized to der(8) confirming the lack of the distal green part of the probe (Figure 2A and B). FISH with a break-apart probe for HMGA2 (Table III) revealed no HMGA2 rearrangements on 100 examined interphase nuclei from each of tumors 2, 3, and 4 (Table II).
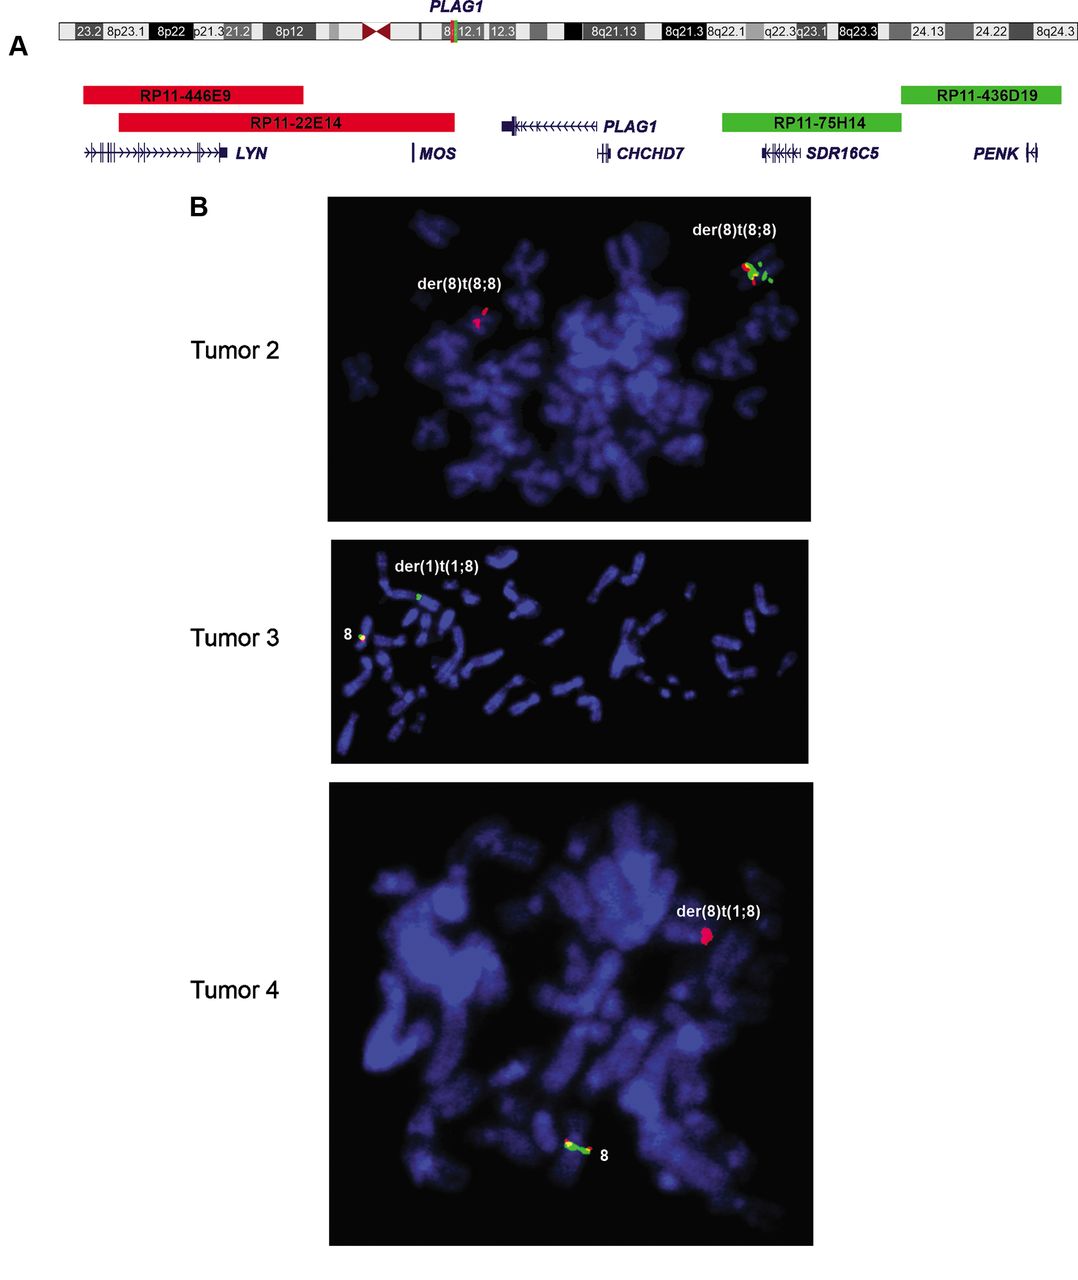
Fluorescence in situ hybridization on metaphase spreads using a PLAG1 break-apart probe. (A) Ideogram of chromosome 8 showing the mapping of PLAG1 on chromosome sub-band 8q12.1 and the centromeric proximal (red) and telomeric distal (green) parts of the PLAG1 break apart probe. (B) Metaphase spreads of tumors 2, 3, and 4 showing the hybridization patterns of the PLAG1 break-apart probe. Green/red signal indicates intact PLAG1 locus. In tumor 2, the proximal red part of the PLAG1 break-apart probe is hybridized to the short der(8), whereas the distal green part of the probe is hybridized to the long der(8), distal to the red/green signal of the intact PLAG1. In tumor 3, the proximal red signal is absent, the distal green part of the probe is hybridized to der(1), and the green/red signal is hybridized to normal chromosome 8. In tumor 4, the proximal red part of the probe is hybridized to der(8), the distal green signal is absent and the green/red signal is hybridized to the normal chromosome 8.
RNA sequencing, RT-PCR, and Sanger sequencing analyses Samples for RNA sequencing were available only for tumors 6 and 7. In tumor 6, a lipoma with t(7;8)(p15∼21;q12), analysis of the raw RNA sequencing data with FusionCatcher detected two fusion transcripts between HNRNPA2B1 and PLAG1. In the first transcript, exon 1 of HNRNPA2B1 fused to exon 2 of PLAG1: GGCTGCGGGAAATCGGGCTGAAGCGACTGAG TCCGCGATGGAG::GTTGCCTCTTGGTGCTGCCTTGGCC GTATTTGGCACCCAGAAT. In the second transcript, exon 1 of HNRNPA2B1 fused to exon 3 of PLAG 1: GGCT GCGGGAAATCGGGCTGAAGCGACTGAGTCCGCGATG GAG:: ATTGGCCAAAATGGGAAGGATTGGATTCCACTC TCTTCCACGA.
In tumor 7, a spindle cell lipoma carrying der(1)t(1;8) (p31;q11∼12) and der(8)t(1;8)(p?32∼33;q11∼12) chromosome abnormalities, the analysis of raw RNA sequencing data with FusionCatcher detected two fusion transcripts between SDCBP and PLAG1. In the first transcript, exon 2 of SDCBP from 8q12.1 fused to exon 2 of PLAG1: CTATCCATCTCTCGAAGACTTGAAGGTAGACAAAGT AATTCAG::GTTGCCTCTTGGTGCTGCCTTGGCCGTAT TTGGCACCCAGAAT. In the second transcript, exon 2 of SDCBP from 8q12.1 fused to exon 3 of PLAG1: CTATCCATCTCTCGAAGACTTGAAGGTAGACAAAGT AATTCAG:: ATTGGCCAAAATGGGAAGGATTGGATTC CACTCTCTTCCACGA.
RT-PCR using HNRNPA2B1-46F1 and PLAG1-498R1 primer combination amplified two cDNA fragments (data not shown), which, by cloning and Sanger sequencing, confirmed the HNRNPA2B1::PLAG1 fusion transcripts detected by the RNA sequencing/FusionCatcher analysis (Figure 3A). RT-PCR with SDCBP-31F and PLAG1-498R1 primers amplified two cDNA fragments (data not shown). Their cloning and Sanger sequencing confirmed the SDCBP::PLAG1 fusion transcripts detected by RNA sequencing/FusionCatcher (Figure 3B).

Sanger sequencing of lipomatous tumors. (A) Partial sequence chromatograms showing the junction between HNRNPA2B1 and PLAG1. (B) Partial sequence chromatograms showing the junction between SDCBP and PLAG1.
Discussion
Our data support the notion that some lipomatous tumors in adults are genetically characterized by aberrations targeting chromosome bands 8q11-13, leading to rearrangement of the PLAG1 gene with generation of a PLAG1 chimera. The G-banding analysis in the 7 tumors described in this study showed involvement of 8q11-13 in a two- or three-way, balanced or unbalanced translocations. In tumors 2, 3 and 4, FISH analyses using a PLAG1 break-apart probe showed a split signal indicating rearrangement of the gene. In two others from which material was available, RNA sequencing and additional molecular studies confirmed the presence of chimeras in which PLAG1 constitutes the 3′-end of a novel fusion gene: tumors 6 and 7 carried HNRNPA2B1::PLAG1 and SDCBP::PLAG1 fusion transcripts, respectively. In both chimeras, the fusion points were in the 5′-end, non-coding regions of the genes. As a consequence, the coding sequence of PLAG1 came under promoter control of the ubiquitously expressed HNRNPA2B1 or SDCBP (46-49). HNRNPA2B1 codes for a member of the A/B subfamily of heterogeneous nuclear ribonucleoproteins (50). Both HNRNPA2B1 and HNRNPA1 are abundant proteins within the 40S ribonucleoprotein complex (50). SDCBP (also known as melanoma differentiation associated gene-9 and syntenin-1) codes for a multifunctional protein which interacts with a number of other proteins and is implicated in protein trafficking, cell adhesion, cytoskeletal-membrane organization, and regulation of transcription factors (51, 52).
PLAG1 on 8q12.1 is transcribed from telomere to centromere whereas both HNRNPA2B1 on 7p15.2 and SDCBP on 8q12.1 are transcribed from centromere to telomere. The orientation of the three genes and the location of SDCBP indicate that: a) the cytogenetically visible translocations of tumors 6 and 7 are not alone sufficient to generate the PLAG1-chimeras, and b) sub-microscopic inversions or insertions probably exist contributing to the generation of chimeras.
Apart from pleomorphic adenomas and lipoblastomas, PLAG1-chimeras have also been reported in neoplasms, such as uterine myxoid leiomyosarcoma (6, 53), chondroid syringoma (8), pediatric fibromyxoid tumor (11, 54), carcinoma ex pleomorphic adenoma (55), acute myeloid leukemia (56, 57), myoepithelioma/myoepithelial carcinoma/mixed tumors (58, 59), and other soft tissue tumors (10, 60). Correspondingly, identical PLAG1-fusion genes were found in different tumor types. For example, TRPS1::PLAG1 was reported in soft tissue myoepithelial tumor, uterine myxoid leiomyosarcoma, and chondroid syringoma (6, 8, 59), YWHAZ::PLAG1 was found in lipoblastoma and pediatric fibromyxoid tumor (17, 54), and so on. All this indicates that the PLAG1 rearrangements/fusion genes hit a stem cell capable of both transformation and differentiation in several directions.
The microscopic and histologic appearance of a tumor is mostly what decides the diagnosis and what the tumor is called. In lipomatous tumors, considerable histopathologic overlap exists between lipoblastomas and other fat cell tumors (4, 17-19, 21, 22, 28, 31, 61-71). The detection of specific acquired genomic aberration patterns can increase diagnostic precision considerably, and for the diagnosis of lipoblastoma, the presence in tumor cells of 8q11-13 chromosome aberrations/PLAG1 rearrangement/PLAG1-chimeras has come to play such a role (4, 22, 61). In lipoma-like and hibernoma-like lipoblastomas, Gisselsson et al. (61) found that PLAG1 rearrangement was not restricted to lipoblasts only but could be found also in other mesenchymal cell components, i.e., in mature adipocytes, stellate primitive mesenchymal cells and fibroblast-like cells. On the other hand, PLAG1 was not rearranged in the vascular elements, endothelial cells, and leukocytes within the tumor (61).
Conclusion
In summary, our present data as well as findings in previously published studies show that 8q11-13 aberrations/PLAG1-rearrangements/PLAG1-chimeras may be detected in various histological type lipomatous tumors that have hitherto been reported as lipomas, spindle cell/pleomorphic lipomas, atypical lipomas/well differentiated liposarcomas, lipoblastomas, and hibernomas (17, 18, 21-31). We are of the opinion that a term, such as “8q11-13/PLAG1-rearranged lipomatous tumors”, may be appropriate for these lipogenic neoplasms, underscoring the common pathogenetic mechanism they may share.
Acknowledgements
This work was supported by grants from Radiumhospitalets Legater.
Footnotes
Conflicts of Interest
The Authors declare that they have no potential conflicts of interest in regard to this study.
Authors’ Contributions
IP designed and supervised the research, performed molecular genetic experiments and bioinformatics analysis, and wrote the article. LG performed the cytogenetic analysis. KA performed molecular genetics and FISH experiments and evaluated the data. ML-I and IL performed the pathological examination. FM evaluated the data. SH evaluated the cytogenetic data and assisted in the writing of the article. All Authors read and approved of the final manuscript.
- Received December 14, 2022.
- Revision received January 4, 2023.
- Accepted January 17, 2023.
- Copyright © 2023, International Institute of Anticancer Research (Dr. George J. Delinasios), All rights reserved
This article is an open access article distributed under the terms and conditions of the Creative Commons Attribution (CC BY-NC-ND) 4.0 international license (https://creativecommons.org/licenses/by-nc-nd/4.0).
References
In this issue


Jump to section
Related Articles
Cited By...
- No citing articles found.