


Abstract
Background/Aim: The aberrant regulation of erythropoietin-producing hepatocellular carcinoma (EPH) receptors and ephrin ligands has been implicated in breast carcinoma, and artesunate has been shown to have anticancer effects. The aim of this study was to characterize the involvement of EPH receptors and ephrin ligands in mediating artesunate (ART)-induced growth suppression of normal breast cells and breast carcinoma cell lines. Materials and Methods: The normal breast epithelial cells (MCF10A), non-invasive ductal breast carcinoma cells (MCF7), and invasive triple-negative breast carcinoma cells (MDA-MB-231) were grown in the absence or the presence of different concentrations of artesunate. The cells were counted, and total RNA was isolated. The abundance of transcripts corresponding to EPH receptors and ephrin ligands was determined by quantitative polymerase chain reaction. Results: Cell viability was significantly reduced when cells were treated with artesunate, with MDA-MB-231 cells having the highest sensitivity. Artesunate had no significant effect on transcription of EPH/ephrins in MCF10A cells, but markedly increased EPHA8, EPHA10, EPHB6 and ephrin-A2 expression in MCF7 cells, and significantly increased EPHA3 and EPHA10 expression while reducing that of EPHA7 and ephrin-A3 in MDA-MB-231 cells. Conclusion: The relative changes in artesunate-treated MCF7 and MDA-MB-231 cells as compared to similarly treated MCF10A cells allow us to implicate combinatorial expression and receptor interactions for EPH receptor-mediated signal transduction that converges into pathways responsible for cell growth, proliferation, and apoptosis. Specifically, the alterations in EPHA7, EPHA8, EPHA10 and EPHB6 transcripts appear to be important participants in artesunate-mediated cellular effects.
- Breast carcinoma
- artesunate
- apoptosis
- tumorigenic breast cancer cells
- triple-negative breast cancer cells
- EPH receptors
- ephrin ligands
- MCF10A cells
- MCF7 cells
- MDA-MB-231 cells
- apoptosis
- AKT pathway
- EPH receptor interaction
Breast cancer is the second leading cause of cancer mortality in women (1). It is important to determine which type of cell causes the cancer in order to choose the best treatment. Despite the use of combinatorial management with surgery, radiation therapy, chemotherapy, hormone therapy, targeted therapy and immunotherapy, less than satisfactory response, resistance and cancer recurrence continue to pose major concerns (2). These challenges have prompted newer investigations on therapeutic significance of naturally occurring plant compounds (3).
Erythropoietin-producing hepatocellular carcinoma (EPH) receptors make up the largest family of receptor tyrosine kinases that are grouped based on their sequences and binding preferences to ephrin ligands. They comprise nine EPHA receptors (EPHA1-EPHA8 and EPHA10) that bind to ephrin-A (ephrin-A1 – ephrin-A5) ligands and five EPHB receptors (EPHB1-EPHB4 and EPHB6) that bind with ephrin-B (ephrin-B1 – ephrin-B3) ligands (4). Two exceptions exist, EPHA4 and EPHB2, which have been shown to bind to ligands from both classes (5, 6).
The signaling mediated by EPH receptors requires that the receptor-bearing cells must contact the ephrin ligand-containing cells to transduce the signal in a bidirectional manner. Such contact between the EPH receptors and their cognate ligands influences tissue and neuronal development and organization, cell morphology, cell adhesion, angiogenesis, and cell invasion (7-9). The impairment of normal interactions between EPH receptors and ephrin ligands have been observed in a variety of human cancer types (10). The susceptibility of these interactions to chemicals and biologicals is therefore being exploited to develop modalities for therapeutic intervention of human cancer.
Artemisia annua L, sweet wormwood, is a rich source of artemisinin and has been used in traditional Chinese medicine (11, 12). The chemical modifications of this compound have led to the development of its more soluble derivatives such as artesunate, dihydroartemisinin, arteether and artemether (13, 14). The effectiveness of A. annua against multidrug-resistant malaria infections caused by Plasmodia has been attributed to artemisinin-mediated effects on endoplasmic reticulum export of plasma membrane ATPase 1 protein 1, redox cycling, and Plasmodium falciparum ATPase 6 (15, 16).
Artemisinin and artemisinin derivatives have also been used to treat diseases such as diabetes, atherosclerosis, trypanosomiasis, schistosomiasis, viral infections, autoimmune diseases, and cancer. Such expansion of its usage is largely due to its desirable effects observed in the short term at doses below cytotoxic levels (17, 18). The inhibition of tumor cell proliferation by artemisinin derivatives has been investigated in the context of the oxidative stress response, iron, DNA damage and repair, cell-cycle arrest, and cell death (19). It has been shown that artemisinin and its derivatives induce cell-cycle arrest both by interfering with cyclin-dependent kinase-driven pathways and by disturbing cell-cycle kinetics (19) Given the effects of artemisinin and artemisinin-derivatives on a variety of cellular pathways (19), the ability of these chemicals to influence apoptosis in breast cancer cells (3), and involvement of EPH receptors in breast tumorigenesis, we investigated the alterations in the abundance of EPH receptors and ephrin ligands in artesunate-treated breast cancer cell lines.
Materials and Methods
Cell culture method. The cell lines used in this study were obtained from the American Type Culture Collection in Manassas, VA, USA. MCF10A cells were cultured in Dulbecco’s modified Eagle’s medium (VWR, Radnor, PA, USA) supplemented with 10% horse serum, 1% penicillin/streptomycin, 10 ng/ml epidermal growth factor, 10 μg/ml insulin, 0.1 μg/ml cholera toxin, and 500 ng/ml hydrocortisone (Sigma-Aldrich, St. Louis, MO, USA). MCF7 (tumorigenic breast carcinoma) and MDA-MB-231 (triple-negative, invasive breast carcinoma) cell lines were cultured in Dulbecco’s modified Eagle’s medium supplemented with 1% penicillin/streptomycin and 10% horse serum. Cells were grown in a humidified chamber at 37°C with 5% CO2.
Treatment of cells with drug. Artesunate (Sigma-Aldrich) in powder form was dissolved in dimethyl sulfoxide at appropriate concentrations and stored in aliquots in –80°C. Each aliquot was subjected to a maximum of two freeze/thaw cycles for experiments. Based on the concentrations of artesunate that produced significant changes in cell viability in different cell lines, MCF10A cells were treated with 150 μM artesunate for 24 h before harvesting the cells. MCF7 cells were treated with 100 μM artesunate and MDA-MB-231 cells were treated with 50 μM artesunate for 24 h. Equal number of cells in triplicate plates were grown in the presence or absence of artesunate as described above. The viable cells were then counted using a hemocytometer. The starting cell count was considered as 100% to normalize across cell lines and treatments.
Total RNA isolation. After cells were treated with artesunate for 24 h, RNA was isolated from 75 cm2 tissue culture flasks at 80-90% confluency using E.Z.N.A.® HP Total RNA Kit (Omega Bio-tek®, Norcross, GA, USA). Cells were detached from the surface using Trypsin (Sigma-Aldrich, St. Louis, MO, USA) and centrifuged at 1,000 × g. The cells were then homogenized with a 700 μl mixture of guanidinium thiocyanate lysis buffer and 2-mercaptoethanol. Cell lysate was vortexed and transferred to an RNA Homogenizer Mini Column (Omega Bio-Tek, Norcross, GA, USA) inserted into a 2 ml collection tube. The RNA Homogenizer Mini Column was centrifuged at 13,000 × g for 1 min, the lysate was saved and mixed thoroughly with 700 μI of 70% ethanol. The lysate/ethanol mixture was transferred to a HiBind® RNA Mini Column (Omega Bio-Tek) inserted into a 2 ml collection tube and centrifuged at 10,000 × g for 1 min. Next, 500 μl of RNA wash buffer I was added to the HiBind® RNA Mini Column and the column was centrifuged at 10,000 × g for 1 min, followed by a second wash with 500 μl of RNA wash buffer II and centrifugation at 10,000 × g for 1 min. The second wash was repeated and followed by a dry spin at 16,000 × g for 2 min. Lastly, the HiBind® RNA Mini Column was transferred to a clean 1.5 ml Eppendorf tube and RNA was eluted with 30 μl of diethyl pyrocarbonate-treated water at 16,000 × g for 2 min. The concentration of RNA was measured using Nanodrop Lite spectrophotometer (Thermo Scientific, Waltham, MA, USA) and aliquots were stored at –80°C.
cDNA synthesis. The cDNA was synthesized using the SuperScript VILO cDNA Synthesis Kit (Thermo Fisher Scientific, Grand Island, NY, USA). The reaction was carried out using 4 μl of 5X VILO™ reaction mix, 2 μl of 10X SuperScript™ enzyme mix, 2.5 ng RNA, and up to 20 μl of diethyl pyrocarbonate-treated water by priming at 25°C for 10 min, reverse transcription at 42°C for 60 min, and termination at 85°C for 5 min. The cDNA was diluted to 5 ng/μl and aliquots were stored at –20°C.
Reverse transcription-quantitative polymerase chain reaction. Quantitative polymerase chain reaction was performed using StepOnePlus Real-Time PCR System and PowerUp™ SYBR™ Green (Applied Biosystems, Foster City, CA, USA). The reactions consisted of 5 μl PowerUp™ SYBR™ Green Master Mix, 10 ng cDNA, 800 nM forward primer, 800 nM reverse primer, and up to 10 μl nuclease-free water. The sequences of forward and reverse primers specific to all EPH (EPHA1-EPHA8 and EPHA10; EPHB1-EPHB5 and EPHB6) and ephrin (ephrin-A1 to ephrin-A5 and ephrin-B1 to ephrin-B3) transcripts investigated here are described elsewhere (4). The target was amplified by uracil DNA glycosylase activation at 50°C for 2 min, DNA polymerase activation at 95°C for 2 min followed by denaturation at 95°C for 15 s, annealing at 60°C for 15 s, and extension at 72°C for 10 s for 40 cycles. The amplification of a stable housekeeping gene peptidylprolyl isomerase A (PPIA) with forward primer (GGCAAATGCTGGACCCAACACA) and reverse primer (TGCTGGTCTTGCCATTCCTGGA) from OriGene, Rockville, MD, USA, was used for comparison. Results were analyzed by calculating EPH/ephrin gene expression relative to that of PPIA using the ΔΔCT model. Expression patterns of EPH/ephrin transcripts were plotted using PRISM (GraphPad Software Inc., La Jolla, CA, USA) Gene expression was determined as the ΔCT value. The CT value inversely correlates to RNA abundance i.e., lower ΔCT corresponds to higher abundance and vice versa.
Western blotting. The protein abundance corresponding to each selected transcript was determined by western blotting. After the cells were treated with artesunate for 24 h, protein was isolated from 75 cm2 tissue culture flasks using Trypsin-EDTA (Sigma–Aldrich). The trypsin containing medium was removed, the flask was washed with phosphate-buffered saline, the cells were scraped off the plate and spun at 1,000 × g for 5 min. Phosphate-buffered saline was aspirated, and the cells were resuspended in 250-500 μl of cell lysis buffer (RIPA) containing 1 mM phenylmethylsulphonyl fluoride (Sigma–Aldrich). The cells were then vortexed, incubated on ice for 15 min, and sonicated three times for 2 s each. The cells were incubated on ice again for 15 min, spun at 17,000 × g for 5 min, and the clear lysate was transferred to a clean Eppendorf tube and stored at –80°C. The concentration of protein was quantified using Pierce™ BCA Protein Assay Kit (Thermo Fisher Scientific, Grand Island, NY, USA). Stocks of bovine serum albumin protein standards were made at working concentrations of 20-2,000 μg/ml. The bovine serum albumin solution was diluted with RIPA buffer and added to a 96-well clear Costar microplate in duplicates. The aliquots of 200 μl working reagent were added to each well. The plate was incubated at 37°C for 30 min, cooled to room temperature, and the color was quantified using a plate reader. An aliquot of cell lysate was mixed with the reagent, and color quantified as above. The protein concentration in test samples was calculated using the equation produced for the standard curve
An aliquot of cell lysate (~44 μg protein) was electrophoresed on a 12% sodium dodecyl sulphate-polyacrylamide gel at 60 V for 30 min and then at 140 V for 45 min. The separated proteins were transferred to a polyvinylidene difluoride membrane at 100 V for 1.5 h. The membrane was blocked with 5% nonfat dry milk in Tris buffered saline and Tween 20 (TBS-T) for 1 h, incubated with EPHA7 antibody (Santa Cruz Biotechnology, Dallas, TX, USA) overnight at 4°C, washed three times for 5 min with TBS-T and blocked with 5% nonfat dry milk in TBS-T for 30 min. The membrane was then incubated with goat anti-rabbit IgG (Thermo Fisher Scientific, Waltham, MA, USA) for 2 h at room temperature, and washed again with TBS-T three times for 5 min each. The chemiluminescence was detected and the membrane imaged using the Molecular Imager VersaDoc MP Imaging System (BioRad, Hercules, CA, USA).
Statistical analysis. Data were analyzed using GraphPad Prism version 8.0 (La Jolla, CA, USA). Cell counts are expressed as the mean±standard deviation for three replicates. Welch’s t-test was used to measure significance; means were statistically different when p<0.05. ΔCT values are expressed as mean±standard deviation. A one-way analysis of variance was followed by Tukey–Kramer post-hoc test. Difference in means were considered statistically significant when p<0.05
Results
Effect of artesunate on viability of MCF10A, MCF7, and MDA-MB-231 cells. Artesunate had differing effects on each cell line based on the concentration added to the medium. MCF10A cells were the least responsive to the effects of artesunate. As shown in Figure 1A, a significant reduction in viability was observed for MCF10A cells. There was no significant difference in cell count in the presence of 20 μM artesunate (data not shown). The MCF7 cell count significantly decreased in the presence of 50 μM artesunate (Figure 1B). MDA-MB-231 cells were the most sensitive to artesunate as demonstrated by the very significant decrease in proliferation after treatment with 20 μM. The cell proliferation was not affected when cells were treated with dimethyl sulfoxide only. The cell count decreased by ~25% in MCF10A as compared to ~75% in MCF7 and MDA-MB-231 after treating the cells with 50 μM artesunate.
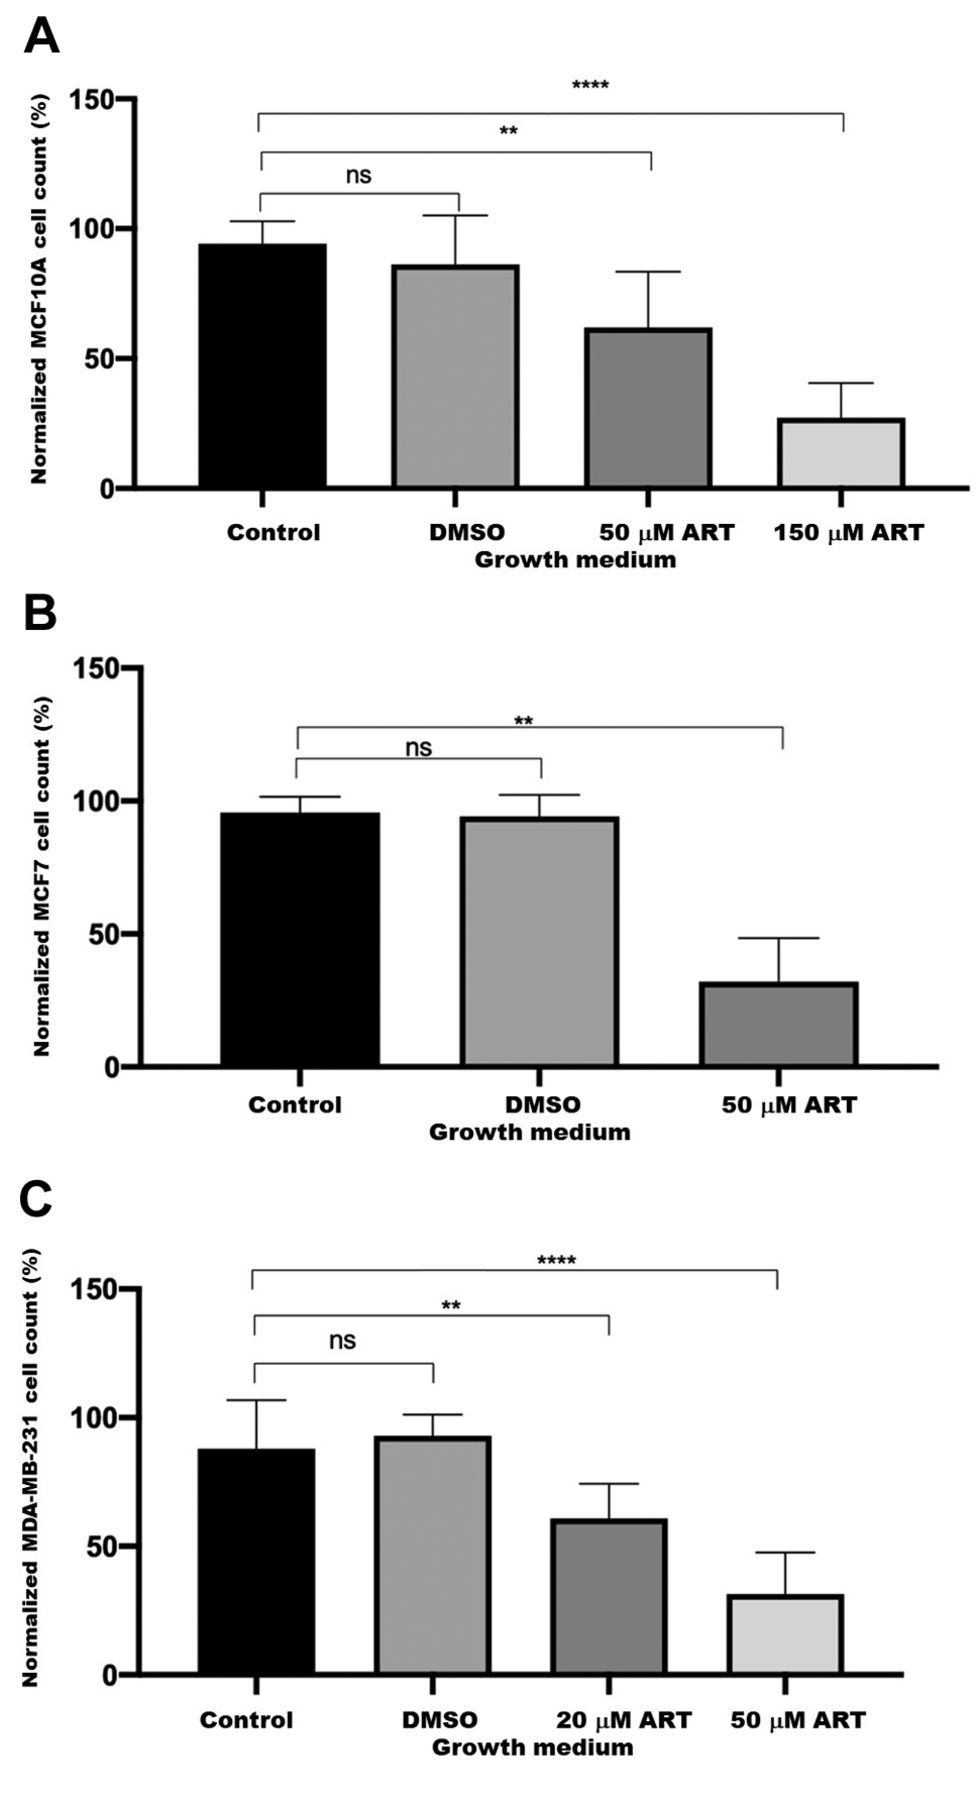
The effect of artesunate on cell proliferation. MCF10A (A), MCF7 (B) and MDA-MB-231 (C) cells were grown in the absence or presence of artesunate (ART) at the indicated concentration for 24 h. Control cells were untreated, dimethyl sulfoxide (DMSO) treatment was a mock control. The cells were counted in a hemocytometer and equal numbers of cells were plated. The starting cell count was considered as 100% for normalizing across treatments and cell lines. All data are shown as the mean±standard deviation of N=9 for MCF10A and MCF7 cells and N=15 for MDA-MB-231 cells. The data were analyzed using Welch’s t-test. Significantly different at: **p≤0.01 and ****p≤0.0001. ns: Not significantly different.
EPH/ephrin transcript expression profiles in nontumorigenic breast epithelial cells (MCF10A). The transcripts corresponding to all 14 EPH receptors and eight ephrin ligands were profiled. MCF10A cells were shown to have a unique expression pattern of EPH/ephrins by which EPHA6, EPHA7, EPHA10, and ephrin-A2 were not detectable under the experimental conditions used. Of the remaining 11 receptor and seven ligand transcripts profiled, none showed a significant difference in ΔCT values between control and artesunate-treated cells (data not shown).
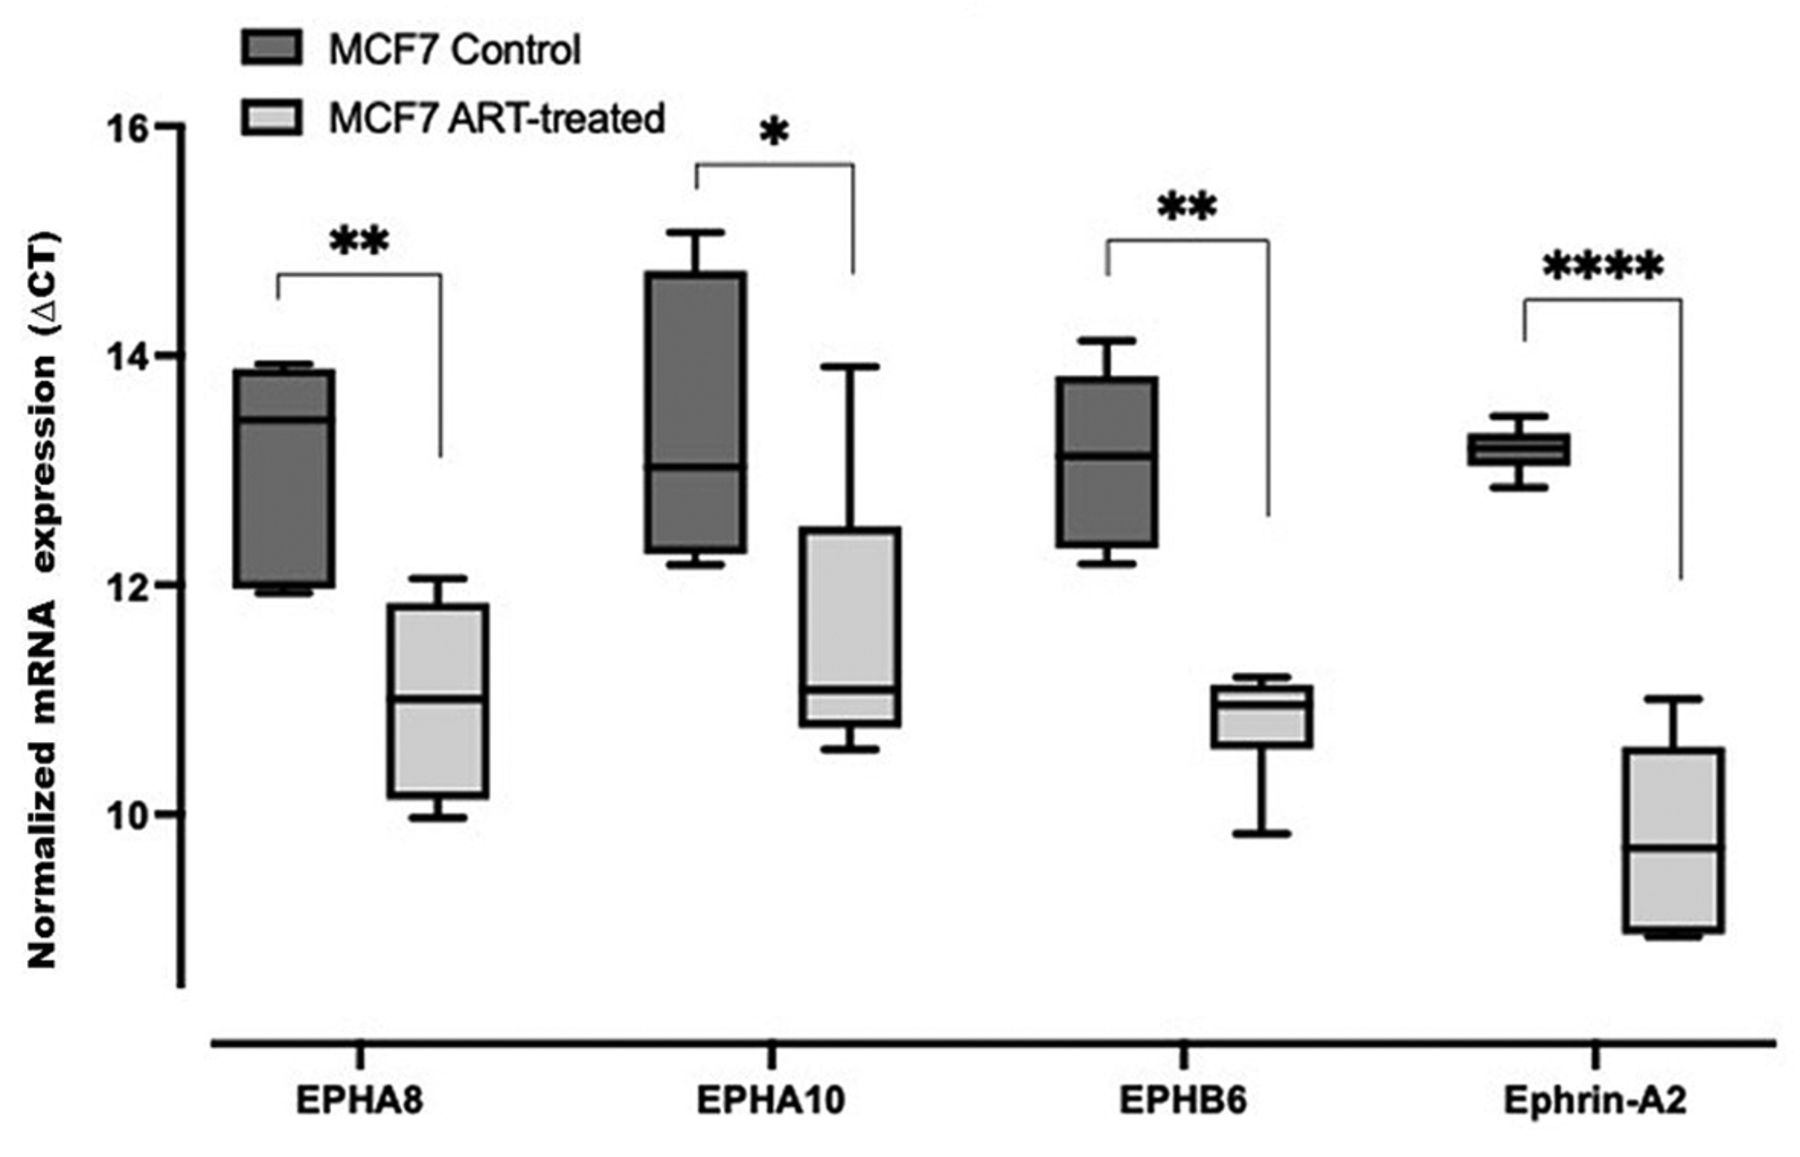
EPH/ephrin transcript expression profiles in tumorigenic breast carcinoma cells (MCF7). The cells isolated from tumorigenic breast carcinoma cells (MCF7) expressed all 14 EPH receptors and 8 ephrin ligands profiled. Transcripts for EPHA8, EPHA10, EPHB6, and ephrin-A2 were significantly differently expressed between control and artesunate-treated cells (Figure 2). The mean ΔCT values were lower for artesunate-treated cells than the cells grown in the control media, which is indicative of artesunate-mediated increase in the expression of EPHA8, EPHA10, EPHB6 and ephrin-A2.

Box and whisker plot of ΔCT values for expression of EPH receptors (EPH) and ephrin transcripts in control and artesunate (ART)-treated MCF7 cells. ΔCT values were obtained by normalizing EPH-ephrin to peptidylprolyl isomerase A expression. ΔCT value of three biological replicates is given as the mean±standard deviation. Significance of differences in ΔCT values was measured via two-way analysis of variance and Tukey’s post hoc multiple comparison test. Significantly different at: *p<0.0332, **p<0.0021 and ****p<0.0001. Lower CT values correspond to higher transcript abundance.
EPH/ephrin transcript expression profiles in invasive triple-negative breast carcinoma cells (MDA-MB-231). MDA-MB-231 cells were shown to have a unique expression pattern of EPH receptors where EPHA1, EPHA6, EPHA8, and EPHB6 were undetectable under the conditions used. Of the remaining 10 receptor and 8 ligand transcripts profiled, EPHA3, EPHA7, EPHA10, and ephrin-A3 were significantly differently expressed between control and artesunate-treated cells (Figure 3A). In fact, while the abundance of EPHA3 and EPHA10 was up-regulated, the transcripts for EPHA7 and ephrin-A3 were down-regulated in artesunate-treated MDA-MB-231 cells as compared to the control cells. The altered transcript abundance was accurately reflected in the amounts of EPHA7 protein in artesunate-treated cells. As shown in Figure 3B, the level of EPHA7 protein was higher in the untreated cells as compared to artesunate-treated MDA-MB-231 cells.

Expression of EPH receptors (EPH) and ephrin transcripts in control and artesunate (ART)-treated MDA-MB-231 cells. A: Box and whisker plot of ΔCT values. The ΔCT value of three biological replicates is presented as the mean±standard deviation. ΔCT values were obtained by normalizing expression to that of peptidylprolyl isomerase A. Significance of differences in ΔCT values was measured via two-way analysis of variance and Tukey’s post hoc multiple comparison test. Significantly different at: *p<0.0332, **p<0.0021, ***p<0.0002, and ****p<0.0001. Lower CT values correspond to higher transcript abundance. B: Detection of EPHA7 protein in control and artesunate-treated MDA-MB-231 cells. The left lane represents ~44 μg of total protein from MDA-MB-231 cells grown in regular media, and the right lane had ~44 μg of total protein from MDA-MB-231 cells grown in the presence of 50 μM artesunate for 24 h. The blot was probed with EPHA7 antibody. The protein size was determined using marker proteins.
Comparative EPH/ephrin expression in artesunate-treated non-tumorigenic breast epithelial cells (MCF10A), tumorigenic breast carcinoma cells (MCF7), and invasive triple-negative breast carcinoma cells (MDA-MB-231). To explore artesunate-mediated changes among cell lines, we made comparisons of artesunate-treated MCF10A with artesunate-treated MCF7 and artesunate-treated MDA-MB-231 cells, and of artesunate-treated MCF7 with artesunate-treated MDA-MB-231 cells. Expression of EPHA1, EPHA3, EPHA4, EPHB3, EPHB4, ephrin-A1, ephrin-A3 and ephrin-A4 was significantly higher in artesunate-treated MCF7 cells than artesunate-treated MCF10A cells (Figure 4A). In artesunate-treated MDA-MB-231 cells, EPHA2, EPHA4, and EPHB4 expression was significantly higher than in artesunate-treated MCF10A cells, whereas that of ephrin-A1, ephrin-A3, ephrin-A5, and ephrin-B2 was significantly lower (Figure 4B). Compared with artesunate-treated MCF7 cells, expression of EPHB2 was significantly higher and that of EPHA3, EPHA7, EPHA10, EPHB3, ephrin-A1, ephrin-A3, ephrin-A4, ephrin-A5 and ephrin-B3 was significantly lower in artesunate-treated MDA-MB-231 cells as (Figure 4C). These data reveal that as compared to artesunate-treated MCF10A cells, transcripts for selected EPH receptors as well as ephrin ligands were up-regulated in artesunate-treated MCF7 cells. In artesunate-treated MDA-MB-231 cells as compared to artesunate-treated MCF10A cells, however, the transcripts for EPH receptors were similarly up-regulated but the those for ephrin ligands were down-regulated. When the transcripts in artesunate-treated MCF7 cells are compared with artesunate-treated MDA-MB-231 cells, the EPH receptors and ephrin ligands were down-regulated, as indicated in the Figure, except for EPHB2.
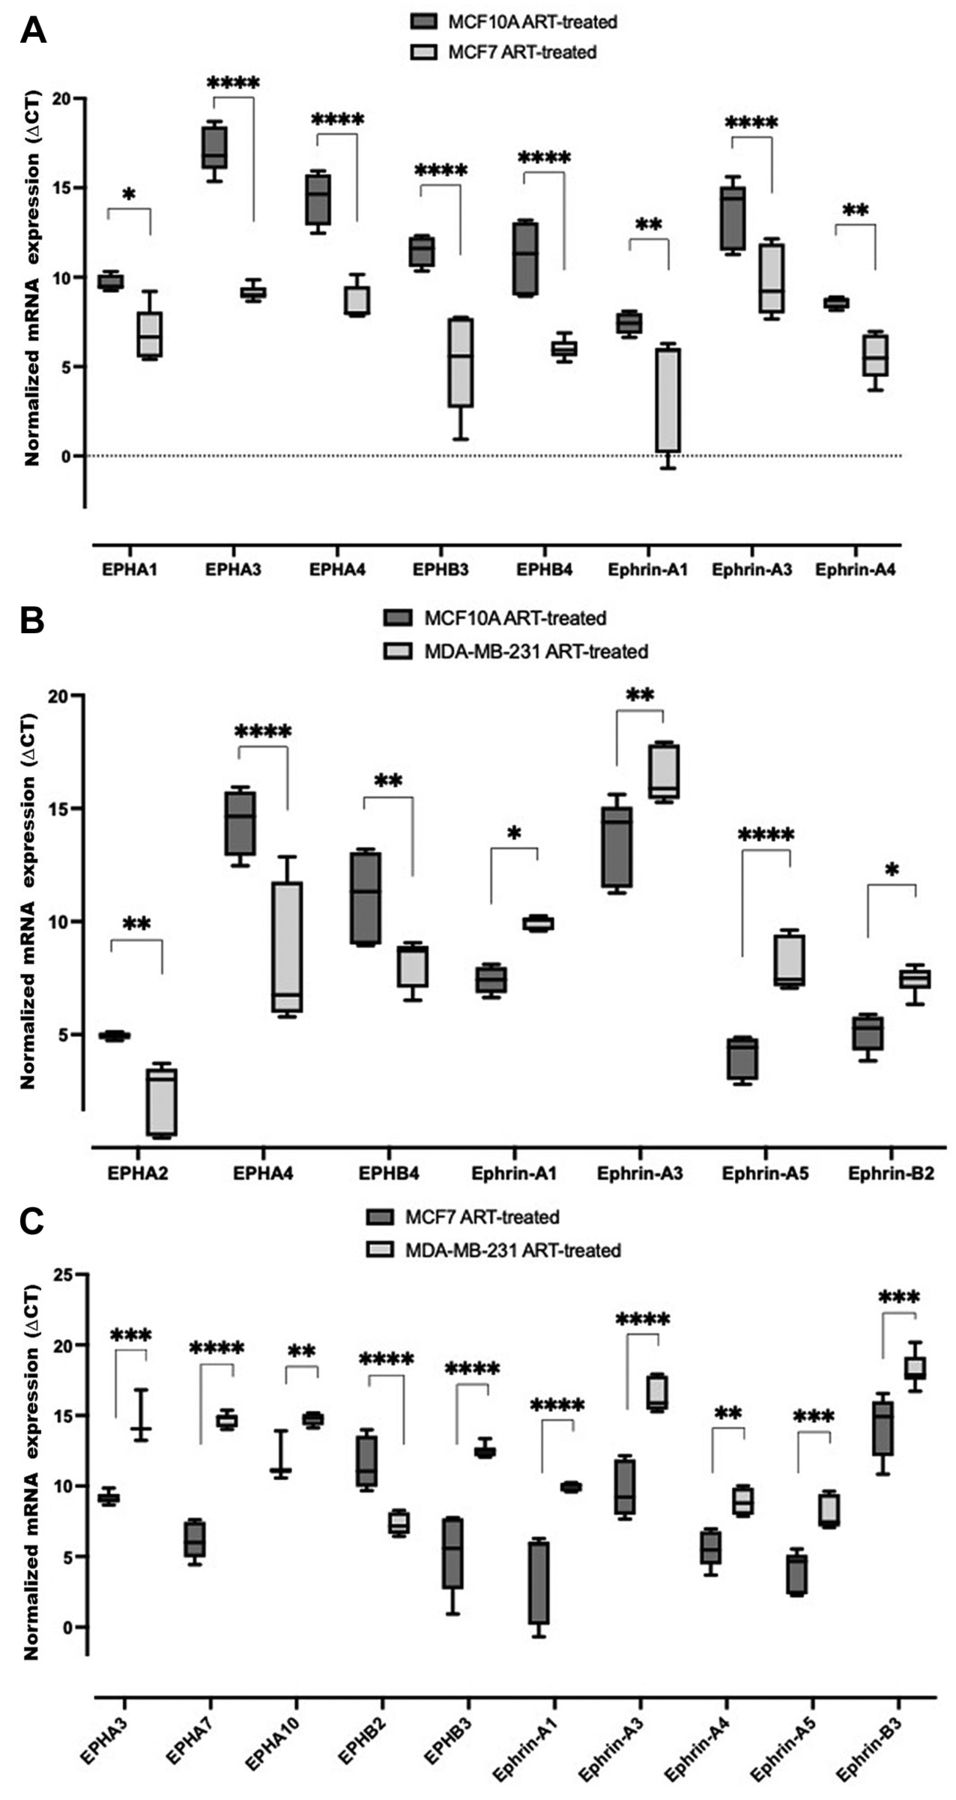
Comparison of EPH receptor (EPH) and ephrin transcript expression in artesunate (ART)-treated MCF10A, MCF7 and MDA-MB-231 cells. Comparative analysis of expression in MCF10A and MCF7 cells (A), MCF10A and MDA-MB-231 cells (B), and MCF7 and MDA-MB-231 cells (C). Box and whisker plots were generated by normalizing mRNA expression using peptidylprolyl isomerase A transcript as control. ∆CT values are presented as the mean±standard deviation of three biological replicates. Significance of differences in ∆CT values between transcripts were measured via two-way analysis of variance and Tukey’s post hoc multiple comparisons test. Significantly different at: *p<0.0332, **p<0.0021, ***p<0.0002, and ****p<0.0001. Lower CT values correspond to higher transcript abundance.
Discussion
The interactions among EPH/ephrin ligands and the balance of their relative abundance are critical for maintaining homeostasis (20). It is therefore likely that artesunate can influence homeostasis to counter abnormal signaling in cells during disease conditions. We observed significant changes in EPH/ephrin transcript levels after treating breast cancer cells with artesunate for 24 h. These changes can be attributed to alterations in pathways responsible for the regulation of EPH/ephrins. Based on the changes in the unique patterns of expression of certain EPH/ephrins in various cancer types and cell types, we have described below plausible mechanisms for antitumor activities of artesunate in the context of EPH receptors and ephrin ligands.
It is noteworthy that the transcripts for EPHA8, EPHA10, EPHB6 and ephrin-A2 increased in MCF7 cells after artesunate treatment. In MDA-MB-231 cells, however, EPHA3 and EPHA10 increased but EPHA7 and ephrin-A3 levels decreased. Although the normal function of EPHA10 is not well-characterized, it has been shown that this receptor is expressed in breast cancer cell lines but is not detectable in normal breast epithelial cells (4). We previously showed that EPHA7 interacts with kinase-deficient EPHA10 (21) and altered interactions of these proteins due to fluctuations in their abundance in artesunate-treated cells may trigger cell death. It has been shown by other investigators that artesunate treatment restored E-cadherin and β-catenin cell adhesion by inhibiting the Wnt/β-catenin pathway in myelodysplastic syndrome SKM-1 cells. The inhibition of Wnt/β-catenin leads to suppression of cell growth and stimulation of cell death (22). The loss of E-cadherin and β-catenin is also strongly associated with breast cancer (23). Similar effects of artesunate treatment have been reported for colorectal carcinoma cells (24), leukemia cells (25), and non-small cell lung carcinoma (26). We postulate that EPHA7 and EPHA10 interaction may intersect with artesunate-induced apoptosis.
The up-regulation of EPHA8 in treated MCF7 cells and its possible implications for restoring normal growth program may be drawn from the reported ability of EPH8 to suppress epithelial–mesenchymal transition (EMT) in glioma cells (27). Similarly, the increase in kinase-deficient EPHB6 may likely suppress the EMT phenotype in an artesunate-dependent manner. Expression of EPHB6 is inversely correlated with invasiveness of tumors and EMT markers β-catenin and vimentin (6, 27, 28). The suppression of EMT and up-regulation of EPHB6 might be a response to keep the cell in the epithelial state.
The down-regulation of EPHA7 in artesunate-treated MDA-MB-231 cells supports the hypothesis that the treated cells have decreased proliferation and strengthens the established link of EPHA7 with apoptosis, AKT serine/threonine kinase 1 (AKT) signaling, metastasis and poor prognosis in various cancer types (28-31). It is therefore plausible that artesunate-mediated decrease in the abundance of EPHA7 in MDA-MB-231 cells manifests via apoptotic factors, AKT or extracellular signal-related kinase cell survival pathways.
In conclusion, our results demonstrate cell line-specific alterations in EPH receptors and ephrin ligands because of artesunate treatment. The changes in the abundance of these molecules may influence the pathways involved in apoptosis, survival and the EMT. Furthermore, our findings lend support to biological relevance of EPH receptors and ephrin ligands as targets of therapeutic intervention in a variety of human cancers.
Acknowledgements
The Authors wish to thank various Western University of Health Sciences colleagues for making their facilities available for our use.
Footnotes
Authors’ Contributions
TZ executed the experiments, analyzed the data, and cowrote the article. ML contributed to the preliminary experiments of cell culture, RNA isolation, and RT-PCR; RPK served as the principal investigator, designed the experiments, supervised the overall project, and cowrote the article.
Conflicts of Interest
The Authors declare no conflicts of interest.
- Received September 29, 2021.
- Revision received November 1, 2021.
- Accepted November 4, 2021.
- Copyright © 2022, International Institute of Anticancer Research (Dr. George J. Delinasios), All rights reserved


