


Article Figures & Data
Figures
- Figure 1.
Impact of cisplatin on the viability and morphology of PC9 cells. (A) After 72 h of treatment with various cisplatin concentrations, the cell viability was analyzed by the WST-1 cell proliferation assay. Data were acquired and presented as the mean±SD from six independent experiments. *p<0.05 and **p<0.01 compared with the DMSO-treated group using one-way ANOVA with Bonferroni’s multiple comparison test. (B) Cells were treated with different concentrations of cisplatin (or DMSO as control) for 72 h and stained with Giemsa to detect morphological changes. Cells with cytoplasmic vacuolization (black arrows) and membrane blebbing (green arrows) were found among the cisplatin-treated cells but not the DMSO-treated controls. The images are representative results of three independent experiments. (C) Cells were treated at different concentrations of cisplatin (or with DMSO alone) for 72 h. Cells with condensed (red arrows) and fragmented (yellow arrows) fluorescent nuclei are seen among the cisplatin-treated cells but not the DMSO-treated control group. (D) The percentage of cells with nuclear shrinkage and nuclear fragmentation was increased in the cisplatin-treated groups but not in the DMSO-treated control cohort. Data were analyzed by one-way ANOVA with Bonferroni’s multiple comparison test. ***p<0.001 compared with the DMSO-treated group.
- Figure 2.
The impact of cisplatin on ROS generation. (A) PC9 cells incubated with cisplatin at different concentrations (or DMSO as control) for 72 h were stained with ROS deep red dye. The fluorescent signal was measured by flow cytometry, and the median fluorescence intensity (MFI) was determined. The histogram shows that the ROS levels increased in a concentration-dependent manner. (B) The bar diagram shows that the ROS production increased in a dose-dependent manner. Data (mean±SD) are representative of three technical replicates. Data were analyzed by one-way ANOVA with Bonferroni’s multiple comparison test. ***p<0.001 compared with the DMSO-treated group.
- Figure 3.
The impact of cisplatin on DNA fragmentation and the DNA damage signaling pathway. (A) PC9 cells were stained with fluorescein isothiocyanate-dUTP dye after incubation with cisplatin at different concentrations for 72 h. Fluorescence was measured by flow cytometry. DNA fragmentation increased in a concentration-dependent manner, as represented by the dot plot. (B) The percentage of cells expressing TUNEL increased in a dose-dependent manner, as represented in the bar graph. Results are the mean±SD of three independent experiments. ***p<0.001 compared with the DMSO-treated group, using one-way ANOVA with Bonferroni’s multiple comparison test. (C) Total cell lysates from cisplatin-treated PC9 cells for 72 h were subjected to a Western blot analysis with the following antibodies: ATR, p-ATR (Ser 428), ATM, p-ATM (Ser 1981), Chk1, p-Chk1 (Ser 345), Chk2, p-Chk2 (Thr 68), p-p53 (Ser 15), p-p53 (Ser 46), and γ-H2AX (Phospho S140). β-actin served as a loading control. Representative Western blots are shown from three independent experiments.
- Figure 4.
The impact of cisplatin on the MMP. (A) PC9 cells were incubated with various cisplatin concentrations for 72 h to examine the MMP, stained with JC-10 dye, and analyzed by flow cytometry. Representative results are shown from three independent experiments. (B) Quantitative data are presented by green fluorescence (depolarized MMP) of JC-10 monomer. Results are presented as the mean±SD of three independent measurements. *p<0.05 and ***p<0.001 compared with the DMSO-treated group, using one-way ANOVA with Bonferroni’s multiple comparison test.
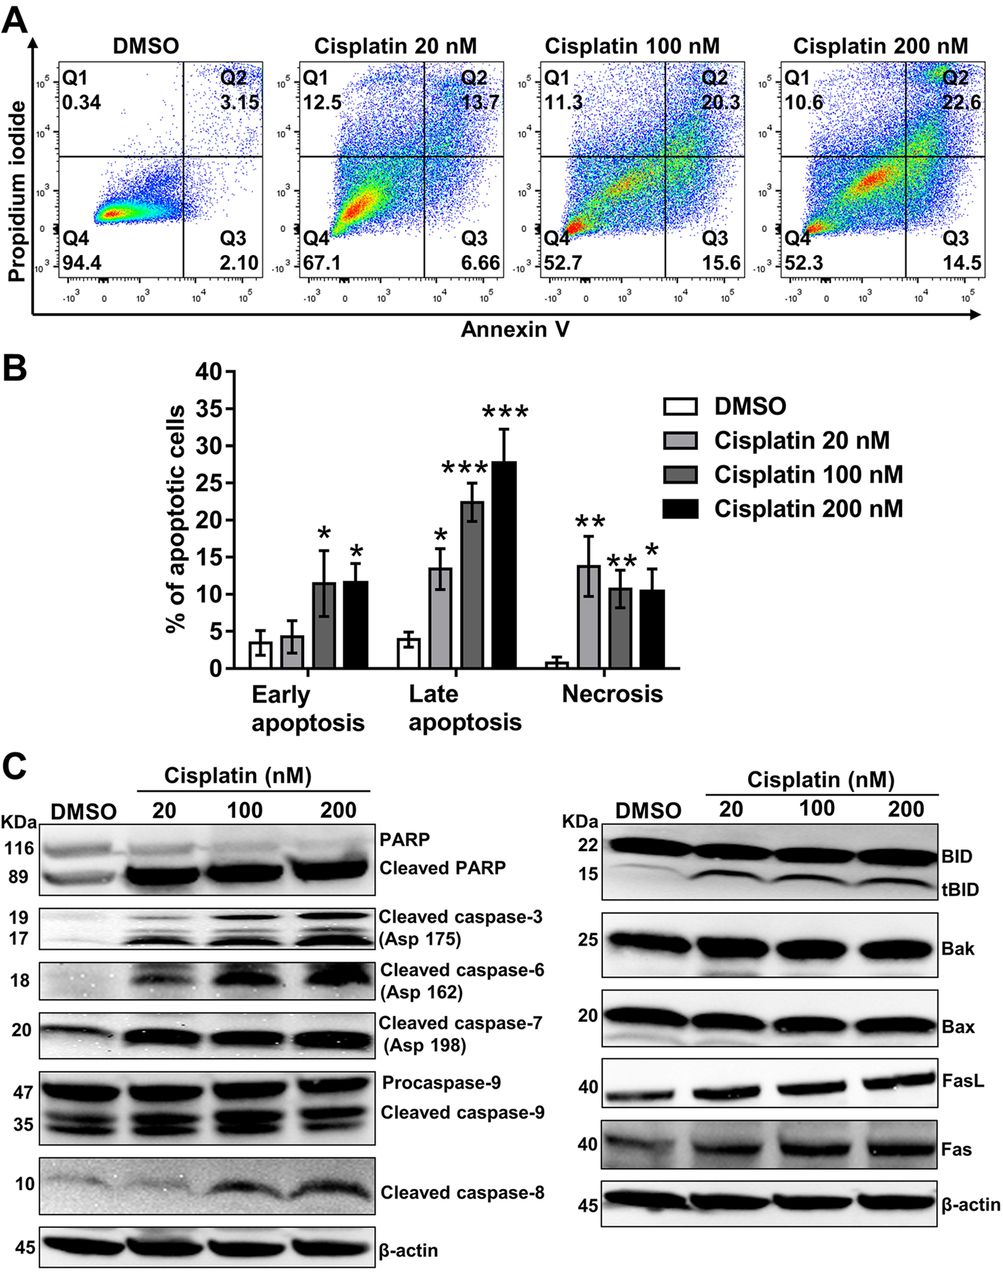
- Figure 5.
The impact of cisplatin on the induction of apoptosis in PC9 cells. (A) Apoptosis was assessed by Annexin V/PI dual staining. Flow cytometry was used to evaluate the number of Annexin V- and PI-positive cells. Quadrant 1 shows necrotic cells, quadrant 2 late-apoptotic cells, quadrant 3 early-apoptotic cells and quadrant 4 viable cells. (B) A bar diagram illustrates the percentage of apoptotic cells. The values were calculated as the mean±SD from three independent experiments. Significance was determined by one-way ANOVA with Bonferroni’s multiple comparison test: *p<0.05, **p<0.01 and ***p<0.001 compared with the DMSO-treated group. (C) To assess the expression of Fas, FasL, Bak, caspase-9, caspase-8, Bax, BID, cleaved caspase-7 (Asp 198), cleaved caspase-3 (Asp 175), cleaved caspase-6 (Asp 162), and PARP proteins, Western blotting was performed. β-actin served as a loading control. Representative immunoblots from three independent experiments are shown.
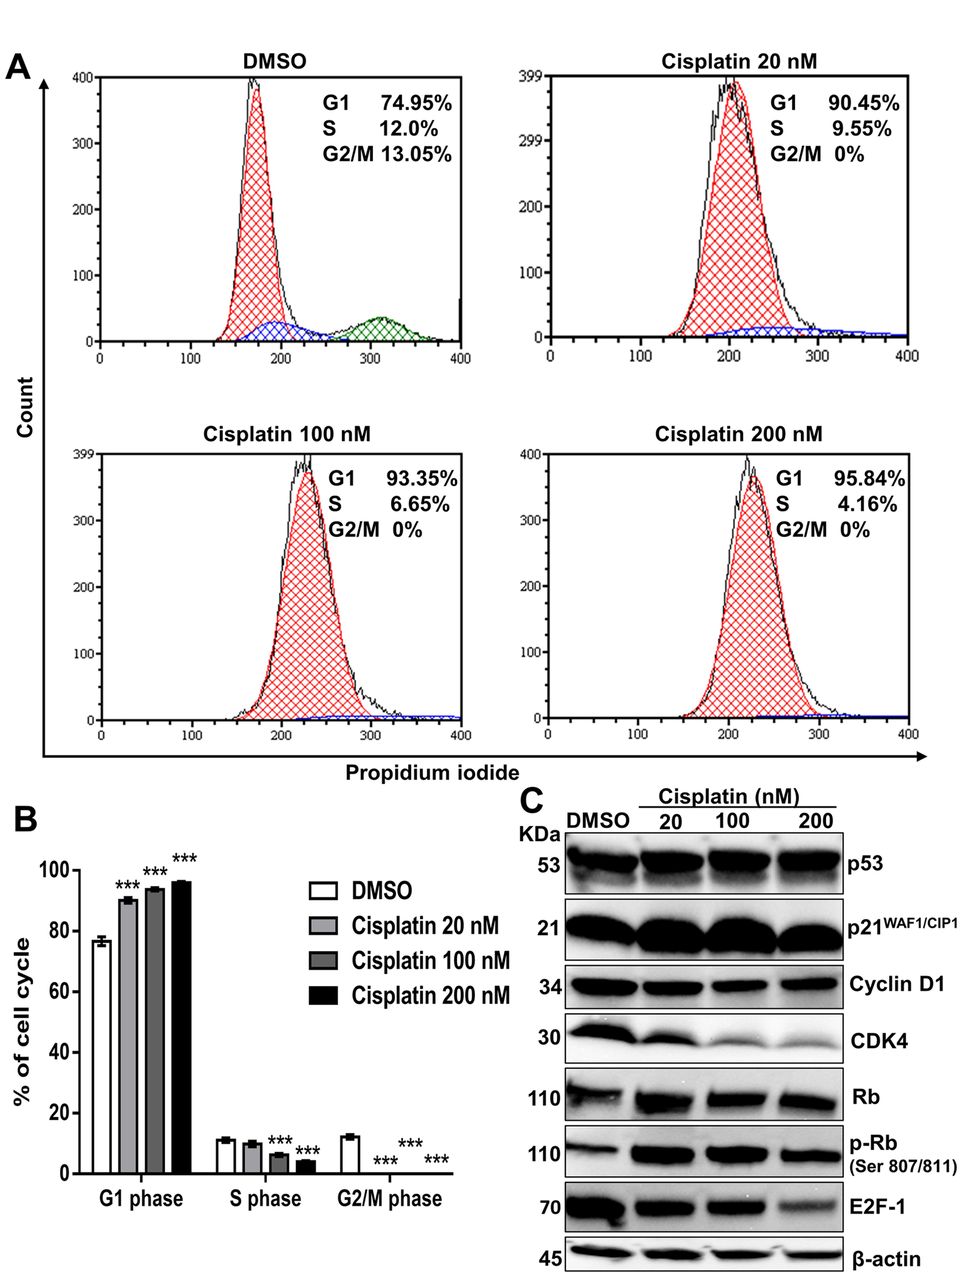
- Figure 6.
The impact of cisplatin on cell cycle regulation in PC9 cells. (A) PC9 cells were treated with DMSO or cisplatin (20 nM, 100 nM and 200 nM) for 72 h and stained with propidium iodide (PI) before a flow cytometric analysis. Representative results from three independent experiments are shown. (B) The results are presented as the mean±SD of three independent experiments. ***p<0.001 compared with the DMSO-treated group, using one-way ANOVA with Bonferroni’s multiple comparison test. (C) For the Western blot analysis, PC9 cells were treated with DMSO or cisplatin (20 nM, 100 nM, 200 nM) for 72 h. β-actin served as a loading control. Representative immunoblots from three independent trials are shown.
- Figure 7.
Impact of cisplatin on senescence induction in PC9 cells. (A) Before staining, PC9 cells were treated with different concentrations of cisplatin (DMSO-treated control) for 72 h. The cells showing SA-β-gal activity were stained green (black arrows). (B) The bar diagram represents the percentage of senescent cells. Values are the mean±SD of three independent experiments. Significance was determined by one-way ANOVA with Bonferroni’s multiple comparison test: **p<0.01 and ***p<0.001 compared with the DMSO-treated group.
- Figure 8.
A schematic illustration demonstrates the effects and mechanism of cisplatin on apoptosis and cell cycle distribution in PC9 cells. Cisplatin enhances ROS production, triggers DNA damage response signaling, and activates a caspase cascade to induce apoptosis. It also demonstrates that cisplatin up-regulates p21WAF1/CIP1 and inhibits the activities of cyclin D1, CDK4, and E2F-1 to induce G1 phase arrest in PC9 cells.


