


Article Figures & Data
Figures
- Figure 1.
A: The experimental scheme for quantitative tissue-based proteomic profiling of prostate cancer (PCa) tissues. B: Overview of the frequency of differentially expressed proteins from prostate tissues identified using a proteomics approach. C: Venn diagrams depicting the up-regulated (left) and down-regulated proteins (right) among the patient's with different T-stage (T2 as PCa, or T3 as advanced PCa) and serum prostate-specific antigen level (LP: low level; HP: high level). Ctrl: Control; DEPs: differentially expressed proteins.
- Figure 2.
A: Gene Ontology (GO) functional enrichment analysis of the differentially expressed proteins found in prostate cancer. B: Kyoto Encyclopedia of Genes and Genomes (KEGG) pathway enrichment analysis of the differentially expressed proteins found in prostate cancer. GOBP: Biological process; GOMF molecular function; GOCC: cellular component.
- Figure 3.
Unsupervised hierarchical clustering of proteins altered during the development of prostate cancer. T2/T3: T2/T3 stage; LP: low serum prostate-specific antigen level; HP: high serum prostate-specific antigen level. KEGG: Kyoto Encyclopedia of Genes and Genomes; GO: Gene Ontology.
- Figure 4.
Volcano plot depicting the T2-stage and T3-stage sets of differentially expressed proteins via the tandem mass tag analysis. ctrl: Control. ATP5I, ATP synthase subunit e, mitochondrial; AZGP1, zinc-alpha-2-glycoprotein; CA1, carbonic anhydrase 1; CAVIN1, caveolae-associated protein 1; CRISP3, cysteine-rich secretory protein 3; EWSR1, RNA-binding protein EWS; FABP5, fatty acid-binding protein, epidermal; FGB, fibrinogen beta chain; FHL2, four and a half LIM domains protein 2; HBA1, hemoglobin subunit alpha; HBB, hemoglobin subunit beta; KHDRBS1, KH domain-containing, RNA-binding, signal transduction-associated protein 1; LTF, lactotransferrin; MFGE8, lactadherin; NAG, alpha-N-acetylgalactosaminidase; NCBP1, nuclear cap-binding protein subunit 1; PPT1, palmitoyl-protein thioesterase 1; SEMG1, semenogelin-1; SEMG2, semenogelin-2; SRM, spermidine synthase; TPM, tropomyosin alpha-4 chain; TRIM33, E3 ubiquitin-protein ligase; TSNAX, translin-associated protein X; UAP1, UDP-N-acetylhexosamine pyrophosphorylase.
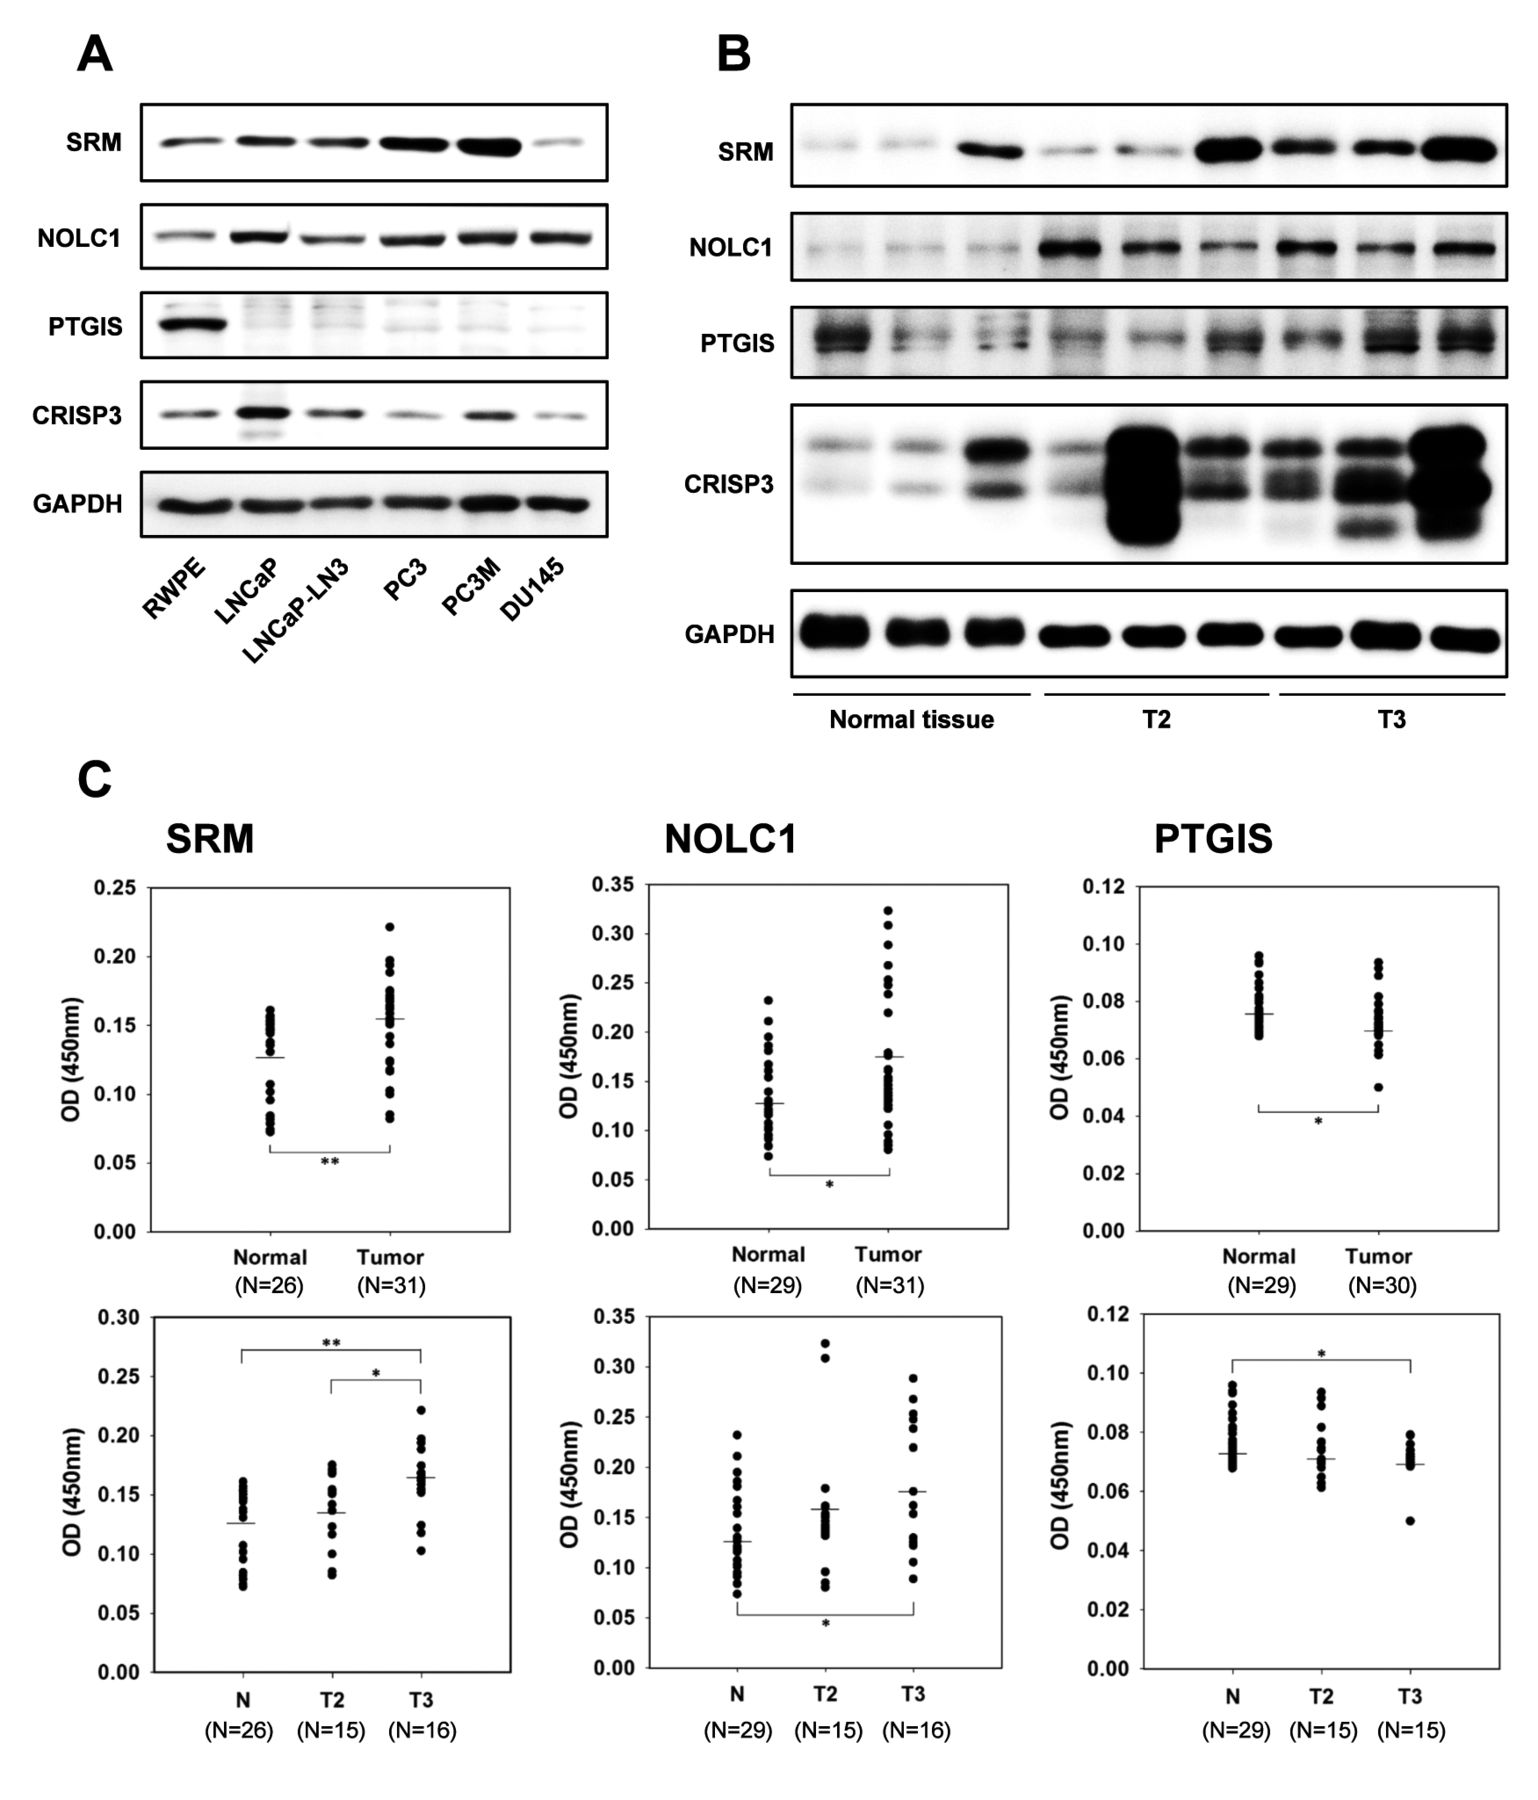
- Figure 5.
A: Immunoblot analysis verifying the expression of the protein candidate biomarkers for prostate cancer in prostate cancer cell lines. B: Randomly selected prostate tissues in T2 and T3 stages among 50 patient tissues. C: Confirmation of spermidine synthase (SRM), nucleolar and coiled-body phosphoprotein 1 (NOLC1) and prostacyclin synthase (PTGIS) as protein candidate biomarkers for prostate cancer using enzyme-linked immunosorbent assay. CRISP3: Cysteine-rich secretory protein 3 precursor; GAPDH: glyceraldehyde 3-phosphate dehydrogenase. Significantly different at *p<0.05 and **p<0.01.


