


Abstract
Background/Aim: Colorectal cancer (CRC) cells secrete inflammatory cytokines that affect CRC progression. The aim of the present study was to determine if micro-RNA-140(miR-140) regulates inflammatory cytokine secretion induced by lipopolysaccharide (LPS) in colorectal cancer cells by targeting tumor necrosis factor receptor (TNFR)-associated factor 6 (TRAF6). Materials and Methods: Fifty fresh colon-cancer specimens and normal colorectal tissues were collected from patients with CRC and tested for the expression miR-140. Human CRC cell lines SW480 and HCT116 were treated with various concentrations and times with LPS. miR-140 and mRNA expression of potentially related genes were analyzed by qPCR. Protein expression was analyzed using western blot or ELISA. Overexpression plasmids with pcDNA3.1-TRAF6, pGL4.10-wtTRAF6 and pGL4.10-mutTRAF6 were constructed. miRNA target gene prediction and a dual luciferase assay were used to analyze miR-140-targeted TRAF6. Results: miR-140 expression was up-regulated in CRC tissues. In CRC cells, LPS could increase miR-140 expression in a time- and concentration-dependent manner. LPS increased inflammatory cytokine mRNA expression levels in SW480 and HCT116 human colon-cancer cells. miRNA-140 suppressed TRAF6 expression via targeting the 3′UTR. TRAF6 affected miR-140-mediated inflammatory cytokine expression of SW480 and HCT116 cells under LPS treatment. Conclusion: miR-140 regulates inflammatory cytokine secretion of LPS-induced colorectal cancer cells by targeting TRAF6.
Colorectal cancer (CRC) is the third most commonly diagnosed cancer in the United States and the third most common cause of cancer death (1). It is estimated that globally more than 2.2 million new cases and 1.1 million deaths will occur by 2030 due to CRC (2).
The coexistence of inflammation and cancer has been known for a long time. Inflammation may promote cancer progression (3-5). CRC cells can secrete inflammatory cytokines which play an important role in CRC development (6, 7), however, the mechanisms by which inflammation can promote cancer progression are poorly understood.
MicroRNAs (miRNAs) are small, single stranded, non-coding RNAs consisting of 20-22 nucleotides, which play significant roles in many biological process by regulating gene expression at the post-transcriptional level (8). The mechanism by which miRNAs work is by binding to the complementary sites in the 3′ untranslated region (3′UTR) of the target genes, which induces degradation of the mRNA transcripts or translational repression (9). miRNAs are involved in many physiological processes, including cell proliferation, apoptosis, cell cycle and cell differentiation (10, 11). More and more evidence indicates that miRNAs are involved in the regulation of cancer-related genes (12-14), as well as of inflammatory cytokine secretion by CRC cells (15-17).
Lipopolysaccharides (LPS) reside in the outer membrane of Gram-negative bacteria. LPS promotes inflammation cytokine secretion in CRC cells. Cha et al. (18) have reported that LPS can affect the expression of inflammatory factors such as tumor necrosis factor-α (TNF-α), interleukin-6 (IL-6), cyclooxygenase-2 (COX-2) of the SW480 human colon cancer cell line. Our previous study showed that LPS concentration was much higher in CRC tissues than in the normal colorectal tissues and promoted vascular endothelial growth factor-C (VEGF-C) expression in SW480 and HCT116 CRC cells (19).
In the present report, we found that miR-140 is up-regulated in CRC tissues. We performed in vitro functional assays to determine the role of miR-140 in inflammatory cytokine secretion in the LPS-induced CRC cells as well as the underlying molecular mechanisms.
Materials and Methods
Patients with CRC tissue specimens. A total of 50 fresh specimens and normal colorectal tissues were collected from patients with CRC by surgical excision. Specimens were immediately stored in liquid nitrogen. The patients had not received chemotherapy, radiotherapy or other treatment, and did not have other inflammatory disease. The present study was approved by the Ethics Committee of The First Hospital Affiliated to Fujian Medical University (approval number: 2017036), and the study complied with the World Medical Association (WMA) declaration of Helsinki (http://www.wma.net/policiespost/wma-declaration-of-helsinki-ethical-principles-for-medical-research-involving-human-subjects/).
Hematoxylin and eosin (H&E) staining. Partly fresh tumor samples were fixed in 10% formalin and embedded in paraffin before sectioning and staining. Tissue sections (4-μm) were deparaffinized in xylene and rehydrated in an ethanol series. Hematoxylin and eosin (H&E) staining was carried out according to standard protocols. Histological evaluation was performed with an optical microscope (DM4000B, Leica).
Cell culture. The SW480 and HCT116 CRC cell lines and 293T cell line were purchased from Shanghai Institutes for Biological Science (Shanghai, PR China). All three cell lines were cultured in RPMI-1640 medium (GIBCO-BRL, Grand Island, NY, USA) with 10% fetal bovine serum (FBS) (Hyclone, Logan, UT, USA). The SW480, HCT116 and 293T cell lines were incubated at 37°C under 95% air and 5% CO2.
RNA extraction and quantitative real-time PCR. Total RNA was extracted from cells and tissues using TRIzol reagent (Invitrogen, Carlsbad, CA, USA), according to the manufacturer's protocol and were quantified by UV 260/280 nm (Bio-Tek Epoch, Burlington, VT, USA) to an absorption ratio of >1.8, as described previously (20, 21). Each RNA (2 μg) was reverse transcribed to cDNA in a final volume of 20 μl using the AVM First Strand cDNA synthesis kit (Invitrogen), following the manufacturer's instructions. The primer sequences were as follows: miR-140 forward, 5’-ACACTCCAGCTGGGTACCACAGGG-3′ and reverse, 5’-CTCAACTGGTGTCGTGGAG TCGGCAATTCAGTTGAGCCGTGGTT-3′. U6 forward, 5’-CTCGCTTCGGCAGCACA-3′, and reverse, 5’-AAACGCTTCACGAATTTGCGT-3′. The qPCR primers used for amplification are listed in Table I. All qPCR reactions were performed using the Thermo Scientific SYBR Green qPCR kit (Bio-Rad Laboratories, Inc., San Diego, CA, USA) on an Applied Biosystems StepOne Real-time PCR System (Thermo Fisher Scientific, Inc., Waltham, MA, USA). PCR conditions were: 95°C for 2 min, 95°C for 15 sec, and 60°C for 30 sec for 40 cycles. For PCR reactions, expression levels were corrected by the ΔΔCT method using a GAPDH primer (Forward: 5’-CCAGGGCTGCTTTTAAC-3′, Reverse: 5’-CGGTGCCATGG AATTTG-3′) as an endogenous control. Statistical analysis was performed in triplicate (n=3).
Primers for qPCR.
miR-140 oligonucleotides and vectors construction. miRNA oligonucleotides including the mimic and inhibitor for miR-140 as well as their corresponding negative controls (NC) were obtained from Genechem Co. Ltd. (Shanghai, PR China). To construct the overexpression plasmids, pcDNA3.1-TRAF6, PCR was carried out with a superscript library (Life Technologies-Thermo Fisher Scientific) using a human full-length cDNA sequence of TRAF6 as a template. The PCR-generated TRAF6 was inserted into BamHI-Xhol sites of pcDNA3.1 (Promega Corporation, Madison, WI, USA). The primers for PCR amplification were as follows: Forward, 5’-CGGATCCATGAGTCTGCTAAACTGTG AAAACAGC-3′, and reverse, 5’-ACTCGAGCTATACCCCTGCATCAGTACTTCG-3′ (BamHI and Xhol restriction sites are shown in italics). The complementary sequence between TRAF6 3′UTR and miR-140 was predicted using a TargetScan tool (http://www.targetscan.org). The wild-type fragment of TRAF6 3′UTR (Wild type TRAF6 3′UTR) with miR-140 binding sequence and the mutant-type fragment of TRAF6 3′UTR (Mutant TRAF6 3′UTR) without a miR-140 binding sequence were synthesized by Bosune Biological Company (Bosune Biological Company, Fuzhou, Fujian, PR China) including the Xhol-HindIII sites. The wild-type TRAF6 3′UTR and mutant TRAF6 3′UTR sequences were inserted into the pGL4.10-vector (Promega Corporation), termed as pGL4.1-wtTRAF6 or pGL4.1-mutTRAF6, respectively. All of above constructs were confirmed by DNA sequencing, which was performed by the Bosune Biological Company. LPS treatment, miRNA-140 and plasmids transfection. Plates (6 cm) were seeded with SW480 and HCT116 cells for LPS treatment (0, 250, 500 and 1000 ng) for 48 h before RNA extraction. SW480 and HCT116 cells were also treated with 1μg LPS (0, 12, 24 and 48 h) before RNA extraction. The rest of the experiments were performed with 1μg LPS for 48 h followed by testing. SW480 and HCT116 cells were seeded in 6 cm plates. When cells reached 80% confluence, the SW480 and HCT116 cells were transfected with miRNAs (mimic NC, miRNA-140 mimic, inhibitor NC and miRNA-140 inhibitor) at a final concentration of 50 nM, each using Lipofectamine 2000 (Life Technologies). At 48 h following transfection, SW480 and HCT116 cells were used for in vitro experimental assays.
Enzyme-linked immunosorbent assay (ELISA). SW480 and HCT116 cells were seeded in 6 cm plates and incubated in RPMI 1640 with 10% FBS. The colorectal cancer cells were treated with LPS or miRNAs. Using ELISA, we quantified TNF-α, IL-6, COX-2, MMP7, and VEGF-C in the colorectal cancer cell culture supernatants. ELISA was performed using human TNF-α, IL-6, COX-2, MMP-7, and VEGF-C ELISA kits (Wuhan Boster Biological Technology, Ltd., Wuhan, PR China). ELISA was performed according to the manufacturer's instructions. Each plate test was repeated three times.
Dual-luciferase reporter assay. SW480 and HCT116 cells were seeded at a density of 2×10⁵ cells per well in 12-well plates. miRNAs transfection was performed using Lipofectamine 2000 (Life Technologies), according to the manufacturer's protocol. SW480 and HCT116 cells were co-transfected with the miRNAs pRL-TK (Promega Corporation) and pGL4.1-wtTRAF6 or pGL4.1-mutTRAF6. Cells were lysed 48 h following transfection. A total of 20 μg of cell lysate was used for the intracellular luciferase activity, following the manufacturer's protocol for the Dual-Luciferase reporter Assay system (Promega Corporation). The Renilla luciferase expression vector pRL-TK was used for normalization. The promoter-less vector pGL4.10-vector served as the negative control. Luminescence measurements were performed on a luminometer (Orion II Microplate Luminometer; Berthold Detection Systems GmbH) (Titertek Berthold, Inc., Pforzheim, Germany). Each transfection was performed in duplicate and data are expressed as the mean±standard deviation of three independent experiments.
Western blot analysis. The experiments and analysis of the results were carried out as described previously (22-24). Briefly, 48 h following transfection with miRNAs or pcDNA3.1-TRAF6, cells were lysed with Western IP cell lysis buffer (Beyotime Institute of Biotechnology, Shanghai, PR China) containing PMSF (Amresco, LLC, Solon, OH, USA) on ice for 30 minutes. Cell proteins (25 μg/lane) were separated by SDS-PAGE on a 10% gel and were transferred onto a 0.45 μM PVDF membrane (GE Healthcare, Life Science, Pittsburgh, PA, USA). The transferred membrane was then incubated with 0.5% bovine serum album (Amresco, LLC, Cleveland, OH, USA) at room temperature for 2 h. The following primary antibodies were used in the western blot analysis: TRAF6 (1:1000, Affinity, Biosciences, OH, USA), GAPDH (1:2000, Abcam, Cambridge, UK) overnight at 4°C. The membranes were washed three times with TBST (0.1% Tween-20) for 10 minutes each at room temperature. The membrane was then incubated with relevant secondary antibody (dilution 1:3000, Santa Cruz Biotechnology, Inc., Santa Cruz, CA, USA) conjugated with horseradish peroxidase at room temperature for 1 h. Visualization of the immunoreactive proteins was performed using a chemiluminescence kit (BeyoECL Plus; Beyotime Institute of Biotechnology, Shanghai, PR China). GAPDH was used as a control.
Statistical analysis. All data were analyzed using the GraphPad Prism 5 software (GraphPad Prism Software, La Jolla, CA, USA). Using ANOVA with Tukey's post-hoc test when more than two groups were compared or the Student's t-test when two groups were compared. The data are expressed as the mean±standard deviation. A p-value of <0.05 was considered to indicate a statistically significant difference.
Results
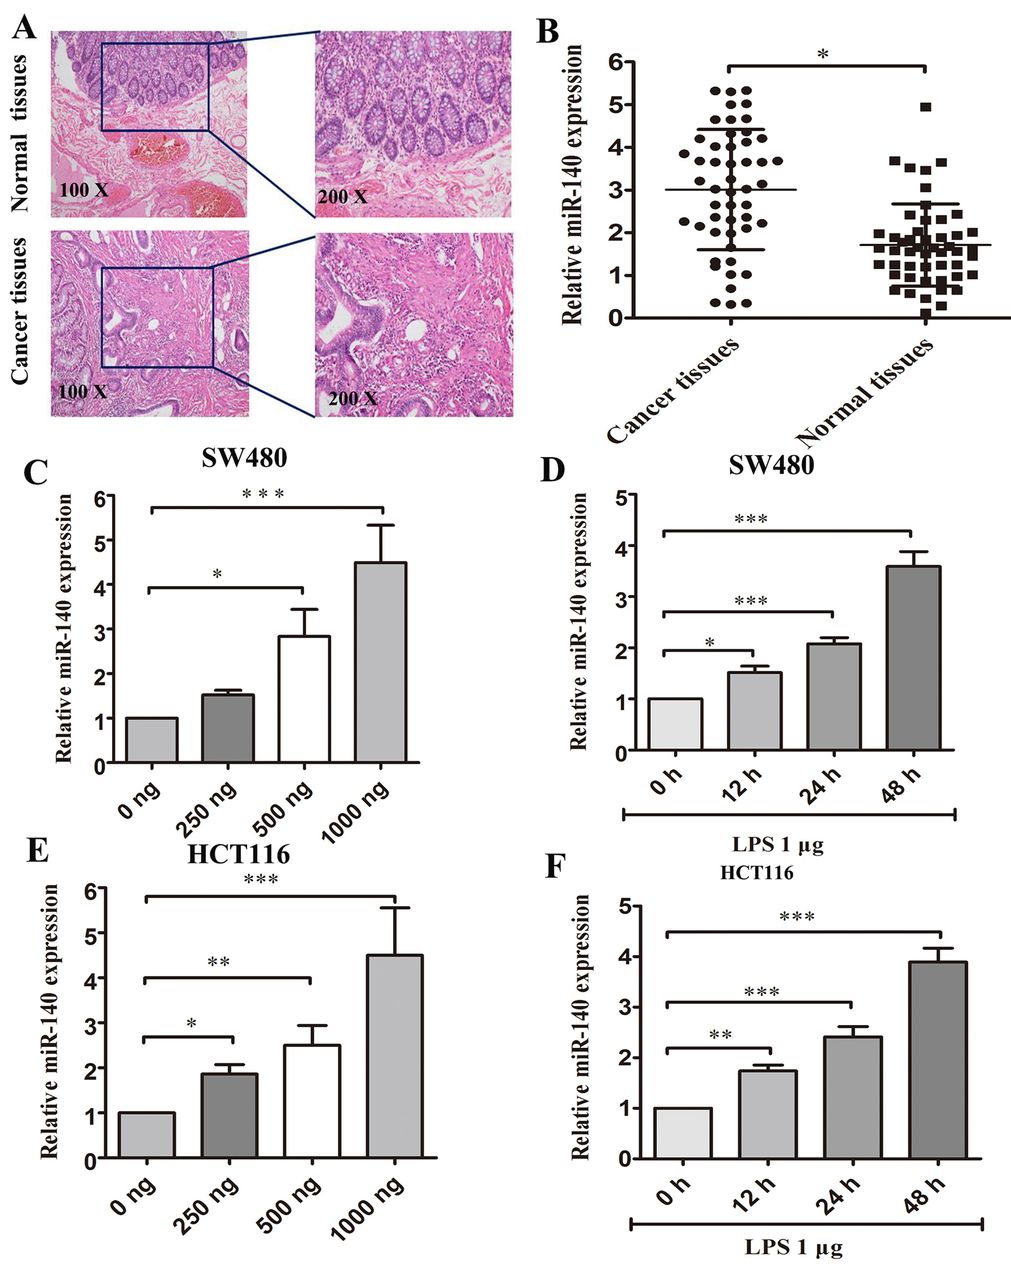
miR-140 expression is up-regulated in CRC tissues. We determined the miR-140 expression in CRC tissues and normal colorectal tissues (Figure 1A). miR-140 was up-regulated in the CRC tissues as compared to surrounding normal colorectal tissues (Figure 1B).
LPS can increase miR-140 expression in a time- and concentration-dependent manner in CRC cells. Previously, we reported that LPS concentration was significantly higher in the colorectal cancer tissues than the normal colorectal tissues (19). In the present report, we investigated the relationship between LPS and miR-140 expression in SW480 and HCT116 cells. We measured miR-140 expression levels in SW480 and HCT116 cell lines after cells were treated with LPS at different concentrations and different time points. LPS at 1 μg and 48 h treatment significantly increased miR-140 expression compared with lower LPS concentrations (0, 250, 500 ng) and other time points (0, 12, 24 h) in both SW480 and HCT116 cells (Figures 1C-1F). Based on these results, in the next in vitro study, we treated CRC cells with 1 μg LPS for 48 h.
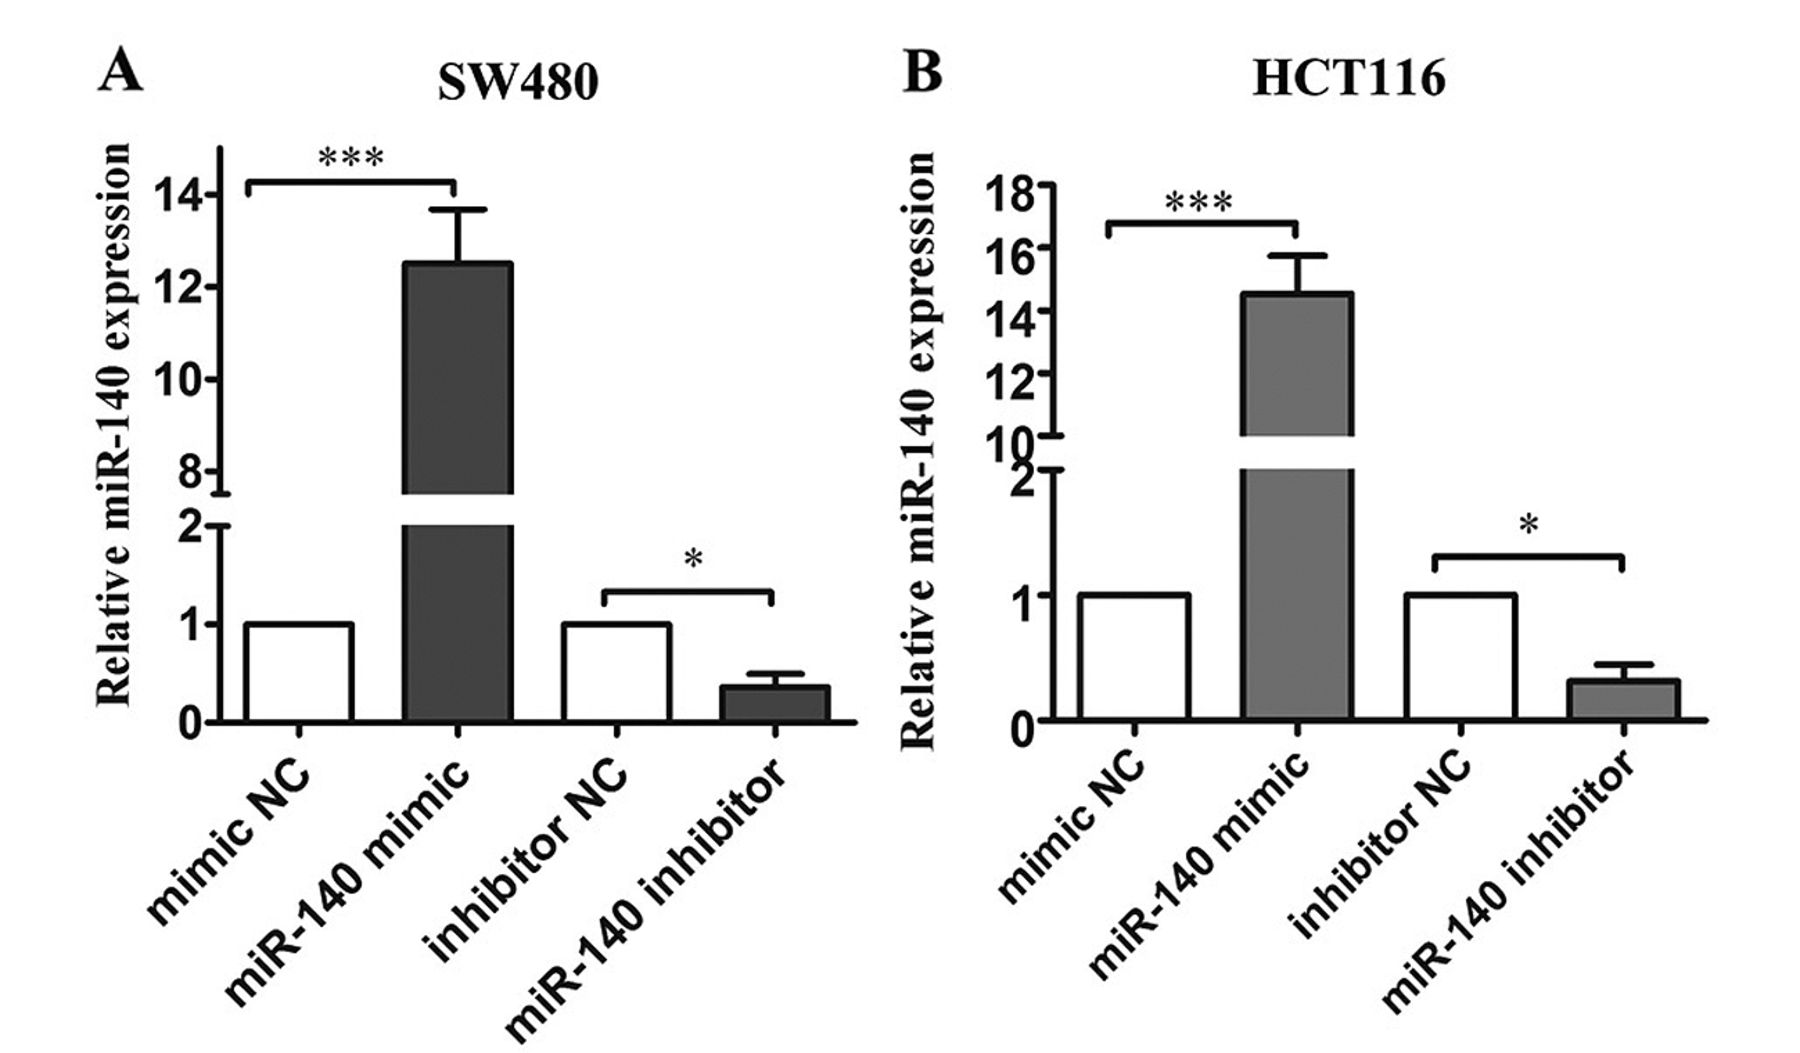
miR-140 expression in SW480 and HCT116 cells. As shown in Figure 2A, miRNA-mimic transfection enhanced miR-140 expression in SW480 cells. In addition, miR-140-inhibitor transfection inhibited miR-140 expression in the SW480 NC group. Similar results were obtained in HCT116 cells (Figure 2B).
Effects of LPS on inflammatory cytokine expression in SW480 and HCT116 cells. We carried out qPCR to detect the expression of TNF-α, IL-6, COX-2, MMP-7 and VEGF-C mRNA in SW480 and HCT116 cells treated with 1 μg LPS. Following LPS treatment for 48 h, SW480 cells significantly increased mRNA expression of TNF-α, IL-6, COX-2, MMP-7 and VEGF-C (p<0.001) (Figure 3A), as well as enhanced the mRNA expression of inflammatory cytokines (Figure 3B). LPS stimulated the increase in protein levels of these inflammatory cytokines in both SW480 and HCT116 cells (p<0.05)) as shown by ELISA (Table II).

miR-140 was up-regulated in CRC tissues and LPS-induced SW480 and HCT116 cells. (A) H&E staining of CRC tissues and normal colorectal tissues at a magnification of ×100, ×200 respectively. (B) qPCR analysis of miR-140 expression levels in CRC tissues and normal colorectal tissue. (C) qPCR analysis of miR-140 expression levels in SW480 cells treated with LPS using concentrations of 0, 250, 500 and 1000 ng. (D) qPCR analysis of miR-140 expression levels in SW480 cells treated with LPS 1μg at 0, 12, 24 and 48 h. (E) qPCR analysis of miR-140 expression levels in HCT116 cells treated with LPS at concentrations of 0, 250, 500 and 1000 ng. (F) qPCR analysis of miR-140 expression levels in HCT116 cells treated with LPS 1 μg at 0, 12, 24 and 48 h respectively. *p<0.05, **p<0.01 and ***p<0.001.

miR-140 expression inSW480 and HCT116 cells. (A) qPCR analysis of miR-140 expression levels in SW480 cells after transfection with miR-140 mimic, miR-140 inhibitor and their corresponding negative controls (mimic NC and inhibitor NC). (B) qPCR analysis of miR-140 expression levels in HCT116 cells after transfection with miR-140 mimic, miR-140 inhibitor and their corresponding negative controls (mimic NC and inhibitor NC). *p<0.05 and ***p<0.001.

Effect of LPS treatment on inflammatory cytokine mRNA expression in SW480 and HCT116 cells. (A) qPCR analysis TNF-α, IL-6, COX-2, MMP-7 and VEGF-C mRNA expression levels in SW480 cells treated with LPS 1 μg for 48 h. (B) qPCR analysis TNF-α, IL-6, COX-2, MMP-7 and VEGF-C mRNA expression levels in HCT116 cells treated with LPS 1 μg for 48 h. ***p<0.001.
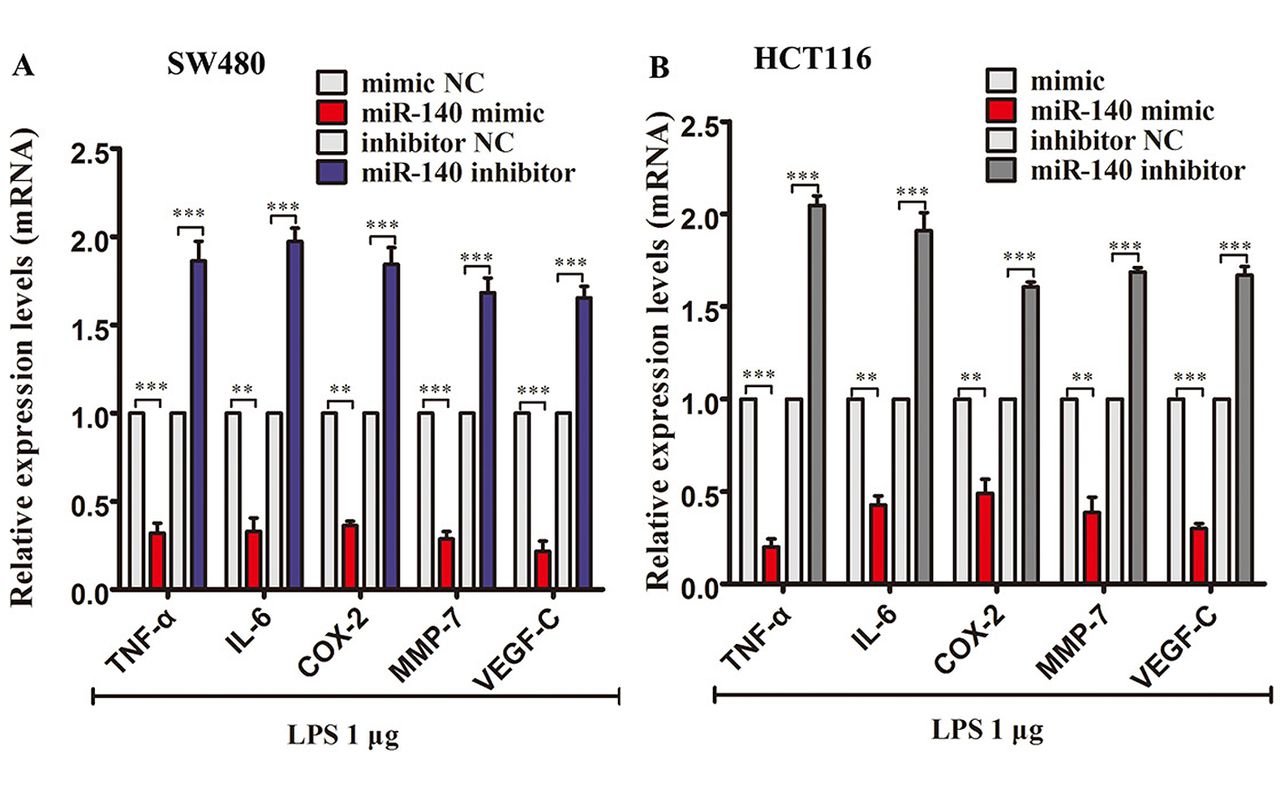
Effects of miR-140 on inflammatory cytokine expression levels in LPS-treated SW480 and HCT116 cells. miR-140 mimic transfection significantly down-regulated the mRNA expression of TNF-α, IL-6, COX-2, MMP-7 and VEGF-C in SW480 cells treated with 1μg LPS. miR-140 inhibitor transfection enhanced the expression of these inflammatory cytokines in LPS-treated SW480 cells (Figure 4A). Similarly, miR-140 mimic transfection also down-regulated these mRNA in HCT116 cells, and miR-140 inhibitor transfection enhanced the mRNA expression of these cytokines (Figure 4B). ELISA showed that miR-140 transfection reduced the protein levels of TNF-α, IL-6, COX-2, MMP-7 and VEGF-C in 1 μg LPS-treated SW480 and HCT116 cells. The opposite result was observed with the knockdown of miR-140, which enhanced TNF-α, IL-6, COX-2, MMP-7 and VEGF-C protein expression in 1μg LPS-treated SW480 and HCT116 cells (Table III).
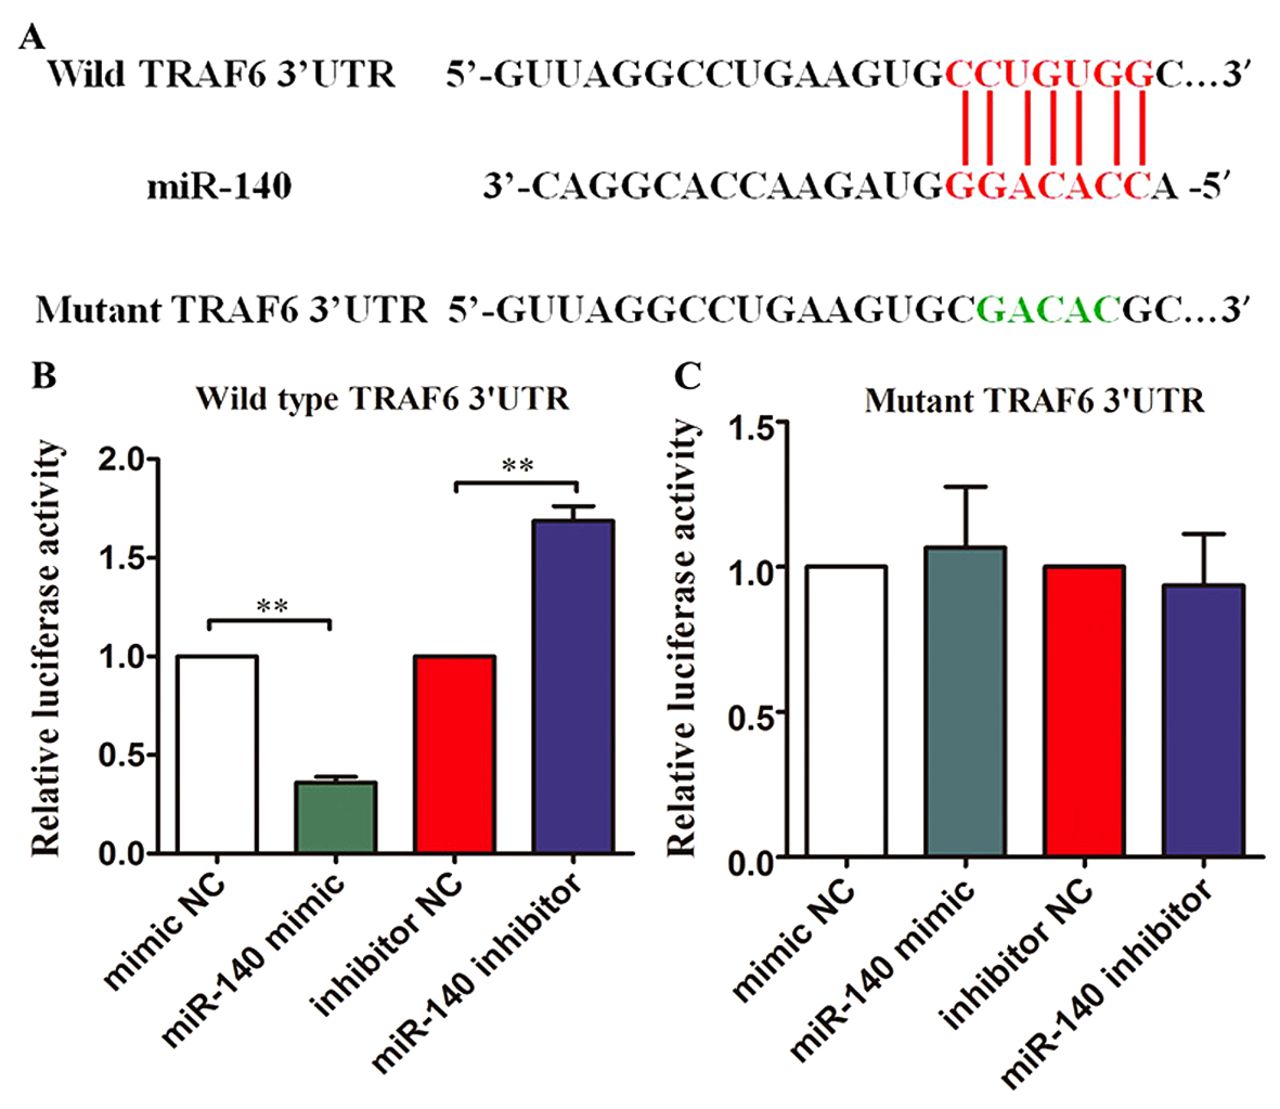
miRNA-140 suppressed TRAF6 expression. To further investigate the role of miR-140 in regulating the inflammatory responses, we carried out bioinformatics analysis using TargetScan (http://www.targetscan.org) (25, 26). Bioinformatics analysis showed that miR-140 targeted the TRAF6 gene 3′UTR area. The complementary sequences between miR-140 and TRAF6 3′UTR are shown in Figure 5A. The wild-type and mutant TRAF6 3′UTRs with miR-140 putative binding sites were synthesized and inserted into the pGL4.10-vector, and were termed as pGL4.1-wtTRAF6 or pGL4.1-mutTRAF6. miR-140 overexpression inhibited the wild-type TRAF6 3′UTR-luciferase pGL4.1-wtTRAF6 reporter vector in 293T cells (p<0.01) (Figure 5B). In contrast, the miR-140 inhibitor increased the luciferase activity of pGL4.1-wtTRAF6 reporter in 293T cells (p<0.01) (Figure 5B). Neither miR-140 overexpression nor miR-140 knockdown affected the luciferase activity of pGL4.1-mutTRAF6 reporter vector in 293T cells (Figure 5C).

Effect of miR-140 on inflammatory-cytokine mRNA expression levels in LPS (1 μg)-treated SW480 and HCT116 cells. (A) qPCR analysis of TNF-α, IL-6, COX-2, MMP-7 and VEGF-C mRNA expression levels in miRNA oligonucleotide-transfected SW480 cells treated with LPS (1μg) for 48 h. (B) qPCR analysis of TNF-α, IL-6, COX-2, MMP-7 and VEGF-C mRNA expression levels in miRNA-transfected HCT116 cells treated with LPS (1 μg) for 48 h. **p<0.01 and ***p<0.001.
Effect of TRAF6 overexpression on miR-140-mediated inflammatory cytokines expression in LPS-treated SW480 and HCT116 cells. miR-140 overexpression significantly reduced TRAF6 mRNA and protein levels (Figures 6A, B, G and H) in SW480 and HCT116 cells, suggesting that miR-140 negatively controls the expression of TRAF6 in CRC cells. In addition, overexpression of TRAF6 was achieved with pcDNA3.1-TRAF6 in SW480 and HCT116 cells (Figures 6C, D, I and J). ELISA showed that overexpression of TRAF6 increased the protein levels of TNF-α, IL-6, COX-2, MMP-7 and VEGF-C and also attenuated the suppressive effects of miR-140 overexpression on these inflammatory cytokine protein levels in LPS-treated SW480 and HCT116 cells (Figures 6E and F).
Effect of LPS treatment on the inflammatory cytokine levels in colorectal cancer cells.
Discussion
Our previous study showed that LPS concentration in CRC tissues is much higher compared to normal colorectal tissues (19). LPS is involved in the progression of CRC (27); however, the specific mechanism of how LPS affects CRC is incompletely understood.
TRAF6 has a functional role as an oncogene involved in tumor aggressiveness (28, 29). TRAF6 belongs to the TRAF family which includes seven members, TRAF1-7. The TRAF family plays important roles in regulating cell survival and cell death (30, 31), tumor invasion and metastasis (32). The present study shows that TRAF6 promotes CRC progression. TRAF6 is involved in inflammation signaling pathways (IL-1, IL-8, IL-6 and LPS), which provide crucial adapter proteins to activate the nuclear factor kappa-light-chain-enhancer of activated B (NF-ĸB) cells and activator protein 1 (AP-1) pathways (33-35). Sun et al., (36) have shown that TRAF6 promotes colon cancer-cell proliferation and could be a potential target for colon cancer therapy.

miRNA-140 suppressed TRAF6 expression via targeting the 3′UTR. (A) The wild-type 3′UTR of TRAF6 mRNA contains a putative miR-140 binding site. The mutant sequence is indicated with green letters. (B) Relative luciferase activity in 293T cells co-transfected with miRNA oligonucleotides including mimic NC, miR-140, inhibitor NC and miR-140 inhibitor and pGL4.1-wtTRAF6 reporter vectors. (C) Relative luciferase activity in 293T cells co-transfected with miRNA oligonucleotides including mimic NC, miR-140, inhibitor NC and miR-140 inhibitor and pGL4.1-mutTRAF6 reporter vectors. **p<0.01.
Effect of miR-140 on inflammatory cytokine levels in LPS-induced colorectal cancer cells.
Other studies have shown that miR-140 is involved in the progression of CRC. Wang et al., (37) have shown that cancer susceptibility 19 (CASC19) positively regulates cell migration inducing hyaluronidase 1 (CEMIP) expression via targeting miR-140. Li et al., (38) have reported that miR-140 could be a key suppressor of CRC through inhibiting the epithelial to mesenchymal transition (EMT) process by targeting Smad3. Many studies have demonstrated that miR-140 can impact CRC progression by regulating other target genes (39-42).

Effect of TRAF6 overexpression on miR-140-mediated inflammatory cytokine expression in LPS treated (1 μg) SW480 and HCT116 cells. (A) qPCR analysis of TRAF6 mRNA levels in SW480 cells after transfection with mimic NC, miR-140 mimic, inhibitor NC or miR-140 inhibitor. (B) Western-blot analysis of TRAF6 protein levels in SW480 cells after transfection with mimic NC, miR-140 mimic, inhibitor NC or miR-140 inhibitor. (C) qPCR analysis of TRAF6 mRNA levels in SW480 cells after transfection with pcDNA3.1 or pcDNA3.1-TRAF6. (D) Western blot analysis of TRAF6 protein levels in SW480 cells after transfection with pcDNA3.1 or pcDNA3.1-TRAF6. (E) ELISA analysis of TNF-α, IL-6, COX-2, MMP-7 and VEGF-C protein levels in LPS-treated (1 μg) SW480 cells with transfection of mimic NC+pcDNA3.1, miR-140 mimic+pcDNA3.1, mimic NC+pcDNA3.1-TRAF6 or miR-140 mimic+pcDNA3.1-TRAF6. (F) ELISA analysis of TNF-α, IL-6, COX-2, MMP-7 and VEGF-C protein levels in LPS treated (1 μg) HCT116 cells after transfection of mimic NC+pcDNA3.1, miR-140 mimic+pcDNA3.1, mimic NC+pcDNA3.1-TRAF6 or miR-140 mimic+pcDNA3.1-TRAF6. (G) qPCR analysis of TRAF6 mRNA levels in HCT116 cells after being transfected with mimic NC, miR-140 mimic, inhibitor NC or miR-140 inhibitor. (H) Western-blot analysis of TRAF6 protein levels in HCT116 cells after being transfected with mimic NC, miR-140 mimic, inhibitor NC or miR-140 inhibitor. (I) qPCR analysis of TRAF6 mRNA levels in HCT480 cells after being transfected with pcDNA3.1 or pcDNA3.1-TRAF6. (J) Western blot analysis of TRAF6 protein levels in HCT116 cells after being transfected with pcDNA3.1 or pcDNA3.1-TRAF6. *p<0.05, **p<0.01 and ***p<0.001.
In the present study, we showed that miR-140 is over-expressed in CRC tissues and it regulates inflammatory cytokine secretion of LPS-induced colorectal cancer cells by targeting TRAF6. We also showed that LPS can increase the expression of miR-140 in SW480 and HCT116 cells in a time- and concentration-dependent manner. Chiu et al., (43) have reported that miR-140 is increased in LPS-induced mouse macrophages. In the present study, we confirmed that LPS can up-regulate miR-140 expression in CRC. Vestergaard et al., (44) have reported that miR-140 can target TRAF6 in β-cells. Recently, Li et al. (46) have demonstrated that miR-140 promoted Mycobacterium tuberculosis (M. tuberculosis) survival and reduced pro-inflammatory cytokine levels in macrophages with M. tuberculosis infection, partially by controlling TRAF6 expression. Other microRNAs have also been involved in regulating TRAF6 expression (47, 48), such as miR-146a, which plays a crucial role in immune responses by targeting TRAF6 (47), or miR-124, which regulates the expression of TRAF6 and may be a therapeutic target in patients with CRC (48). It has been reported that miR-146b-5p-mediated temozolomide resistance in glioblastoma cells is negatively regulated by TRAF6 expression (49).
Although it was known that LPS can promote the expression of inflammatory cytokines in cancer cells (18, 19, 44), in the present study, we suggested that LPS can promote the secretion of TNF-α, IL-6, COX-2, MMP-7 and VEGF-C in CRC cells.
In conclusion, the present study showed that miR-140 expression is increased in CRC tissues. LPS can up-regulate the expression of miR-140 in a time- and concentrate-dependent manner and promote the secretion of TNF-α, IL-6, COX-2, MMP-7 and VEGF-C in CRC cells. Finally, this effect can be regulated by miR-140 through targeting of TRAF6.
Acknowledgements
This study was supported by the National Natural Science Foundation of China (No. 81702424 and 81872364), the Joint Funds for the Innovation of Science and Technology, Fujian Province (No. 2017Y9092), the Fujian Provincial Health Department Young and Middle-aged Talents Training Project (No. 2018-ZQN-46), the Project of Science and Technology Research Program in Fujian Province (No. 2016B044), the Fujian Provincial Natural Science Foundation (No.2018J05127) and the National Clinical Key Specialty Construction Project (General Surgery) of China.
Footnotes
↵* These Authors contributed equally to this study.
Authors' Contributions
GWZ and JXY designed the study, modified the figures and wrote draft manuscript. GWZ, CLL and ZBC performed the experiments; YJH, WZ and SGY analyzed the data, prepared the draft figures; SRS and RMH revised the manuscript. All authors approved the final manuscript.
This article is freely accessible online.
Conflicts of Interest
The Authors declare that they have no conflicts of interest regarding this study.
- Received September 23, 2019.
- Revision received October 3, 2019.
- Accepted October 15, 2019.
- Copyright© 2020, International Institute of Anticancer Research (Dr. George J. Delinasios), All rights reserved
References
In this issue


Jump to section
Related Articles
Cited By...
- No citing articles found.