


Abstract
Background/Aim: Hepatocellular carcinoma (HCC) is the second leading cause of cancer-related death worldwide. The ability of HCC to avoid immune detection is considered one of the main factors making it difficult to cure. Abnormal histone deacetylation is thought to be one of the mechanisms for HCC immune escape, making histone deacetylases (HDACs) attractive targets for HCC treatment. Here, we investigated the effect of trichostatin A (TSA), a highly potent HDAC inhibitor, on HCC (HepG2) gene expression and function. Materials and Methods: A genome wide-transcriptional microarray was used to identify genes regulated by TSA in HepG2 cells. Gene Ontology was used to identify pathways regulated by TSA, and these changes were confirmed by qPCR. The effect of TSA on natural killer (NK) cell-mediated killing of HCC cell lines were analyzed by both flow cytometry and LDH cytotoxicity assay. A study was also conducted in a Balb/c nude mice xenograft model to assess the anti-tumor activity of TSA. Results: TSA regulated the transcription of numerous innate immunity & tumor antigen recognition-associated genes, such as ULBP1 and RAET1G, in HCC cells. In vivo, TSA reduced tumor cell growth in an NK cell-dependent manner. In vitro, TSA treatment of HepG2 cells rendered them more susceptible to NK cell-mediated killing while increasing the expression of NKGD2 ligands, including ULBP1/2/3 and MICA/B. TSA also induced direct killing of HCC cells by stimulating apoptosis. Conclusion: TSA likely increases killing of HCC cells indirectly by increasing NK cell-directed killing and directly by increasing apoptosis.
Hepatocellular carcinoma (HCC) is the fifth most common malignancy and the second leading cause of death of cancer patients in the world (1). Although a lot of progress has been made in the clinical management of HCC, its prognosis still remains poor owing to high chances of metastasis and recurrence, leading to low overall survival (2). Treatment options for advanced HCC are extremely limited owing to the shortage of effective therapeutic agents. Currently, sorafanib is the only approved therapeutic agent for advanced HCC (3), so there is an urgent need for novel therapeutic drugs for this disease.
Recently, epigenetic modulation of gene transcription through acetylation and deacetylation has been reported to play a role in the pathogenesis of advanced HCC (4-6). Specifically, histone deacetylases (HDAC)1-3 are up-regulated in primary human HCC and the enhanced HDACs levels play a critical role in malignant growth and immune escape (7). Importantly, the deacetylation process is reversible and can be targeted by new drugs such as HDAC inhibitors (8, 9). Thus, the biology of HDACs in HCC makes the use of HDAC inhibitors to treat HCC an attractive option (9-11). HDAC inhibitors have been shown to have efficacy as anti-cancer agents in numerous phase I/II studies (http://www.clinicaltrials.gov), conducted in many different types of cancer (12, 13).
Trichostatin A (TSA) was originally discovered as an anti-fungal drug, but was later found to be a potent non-selective inhibitor of HDACs (14). Although the anti-HCC effect of TSA has been reported in previous studies (15, 16), the mechanism by which TSA regulates HCC function is not fully understood. In this study, we attempted to reveal how TSA induced its anti-cancer effects in HCC, focusing on immune modulation, because the participation of immune cells in HCC progression is known to be important (17, 18). For this purpose, we analyzed TSA-mediated transcriptional changes in HepG2 cells, a well-known HCC cell line, using a microarray. As a result of this genome-wide transcriptional analysis, we found that innate immunity, MHC class I/II-like antigen-recognition protein, and chemotaxis-associated genes were altered by TSA treatment in HepG2 cells. Furthermore, we analyzed the immune modulatory ability of TSA, focusing on its effect on natural killer (NK) cells, the major innate immunity cells responsible for tumor killing.
Compared to previous studies, which have focused on the cytotoxic and inhibitory effect of TSA on HCCs, this study demonstrated that TSA has immune-modulatory effects by regulating the expression of a broad range of genes in HCC cells both in vitro and in vivo.
Materials and Methods
Mice. Athymic BALB/c nude mice were purchased from Dooyeol Biotech (Daejeon, Republic of Korea) and housed in a pathogen-free animal facility. Female mice (6-8 week-old) were used in all experiments. All animal experiments were approved by the Institutional Animal Use and Care Committee of the Korea Research Institute of Bioscience and Biotechnology and were performed in accordance with the Guide for the Care and Use of Laboratory Animals published by the US National Institutes of Health.
Cell culture and reagents. HepG2 cells were purchased from the American Type Culture Collection (ATCC, Manassas, VA, USA), and Huh7 cells and SNU449 cells were purchased from Korean Cell Line Bank (Seoul, Korea). HepG2 cells were cultured in Eagle's Minimum Essential Medium (EMEM) (ATCC) containing 10% FBS (Life Technologies, Carlsbad, CA, USA), 2 mM L-glutamine, and penicillin-streptomycin (Life Technologies) at 37°C in 5% CO2. Huh7 and SNU449 were cultured in RPMI1640 (Life Technologies) containing 10% FBS (Life Technologies), 2 mM L-glutamine, and penicillin-streptomycin (Life Technologies) at 37°C in 5% CO2. The HDAC inhibitor, TSA (chemical structure shown in Figure 1a) was purchased from Sigma-Aldrich (St. Louis, MO, USA) and dissolved at a concentration of 10 mM in DMSO as a stock solution, stored at −20°C, and diluted in medium before each experiment. The final DMSO concentration did not exceed 0.1% throughout this study (all control groups were administered 0.1% DMSO). Antibodies against caspase 3, PARP, and β actin were purchased from Cell Signaling Technology (Danvers, MA, USA).
Microarray and data analysis. HepG2 cells (5×10⁶) in 10 ml complete RPMI culture medium were incubated for 48 h at 37°C with DMSO alone (control) or with 1 μg/ml of TSA. Total RNA was isolated from the HepG2 cells, using Trizol (Invitrogen). Analyses were conducted using an Affymetrix whole-genome expression microarray performed according to the manufacturer's instruction. Data were exported and normalized with the robust multi-average method implemented in Affymetrix Expression Console software. Statistical significance was determined using the local pooled error test and gene expression fold change, in which the null hypothesis was that no difference existed among groups. The false discovery rate was controlled by adjusting the p-values, using the Benjamini-Hochberg algorithm. For a differentially expressed gene set, a hierarchical cluster analysis was performed using complete linkage and Euclidean distance as a measure of similarity.
Gene-enrichment and functional annotation analyses for the significant probe list was performed using DAVID (http://david.abcc.ncifcrf.gov/home). Before analyzing by DAVID, genes that were duplicated or were not identified in the database were excluded. The analyses and visualization of differentially expressed genes using a heatmap were conducted using R software (www.r-project.org).
Tumor-bearing mouse model. Athymic BALB/c nude mice were purchased from Dooyeol Biotech; BALB/c nude mice harbor functional NK cells, but do not develop functional T cells. One million viable Hepa1-6 cells were subcutaneously implanted on the right flank of mice. Mice were examined regularly for tumor growth, using a metric caliper. Mice were randomly divided into three groups: a control group, TSA with control IgG (BioLegend, San Diego, CA, USA)-treated group, and TSA with an anti-asialo-GM1 antibody (BioLegend) group (n=6 per group). TSA (30 mg/kg) was administered every day for 18 days via an intraperitoneal (i.p.) route. For NK cell depletion, mice were injected intraperitoneally (i.p.) with 100 μl of an antibody to asialo-GM1, or with the control IgG, 2 days prior to tumor cell implantation and twice afterwards (at days 2 and 5). NK cell depletion was evaluated by flow cytometry using a PE-coupled anti-mouse CD49b antibody and an APC-coupled anti-mouse NK1.1 antibody (BioLegend).
NK cell infiltration. Eighteen days after the initiation of TSA treatment in tumor-bearing mice, all mice were sacrificed and tumor tissues were removed, measured, and digested for 1 h in PBS containing 1 mg/ml collagenase D and 0.5 mg/mL DNase I. Total cells from the tumor were resuspended in FACS buffer (PBS containing 2% bovine serum albumin) by forcing the tissue through a 40-μm nylon cell strainer (BD Biosciences, San Jose, CA, USA). Cells from the mouse tumors were stained with a brilliant violet 421 conjugated anti-mouse CD3 (BioLegend), a PE-cy7 conjugated anti-mouse Ly6G (BioLegend), a phycoerythrin-conjugated anti-mouse NK1.1 antibody (BioLegend,) and an allophycocyanin (APC)-conjugated anti-mouse CD49b antibody (BioLegend) with an Fc-blocking anti-mouse CD16/32 antibody (BioLegend). The cells were washed, resuspended in FACS buffe and The number of CD3-NK1.1+CD49b+ NK cells was determined using MACSQuant®VYB (Miltenyi Biotec, Cologne, Germany) with flow cytometry counting beads (ThermoFisher Scientific, Waltham, MA, USA).
Total RNA isolation and real-time RT-PCR. Cells were prepared as described above. Total RNA was isolated using TRIzol reagent (Invitrogen, Carlsbad, CA, USA). Real-time RT-PCR was performed with 20 ng of RNA as a template, using qScript™ cDNA SuperMix for reverse transcription and PerfeCTa® qPCR FastMix®, UNG, and ROX™ for PCR (Quanta Biosciences, Gaithersburg, MD, USA). Primer and probe sets (FAM/VIC-labeled) were purchased from Applied Biosystems (Waltham, MA, USA). Results were normalized based on the values obtained for GAPDH. Real-time qPCR was performed on duplicate samples, using the ABI 7700 Sequence Detection System (Applied Biosystems). For cells from each donor, the relative levels of expression based on 2−ΔCT values are shown as percentages of the subset with the highest value.
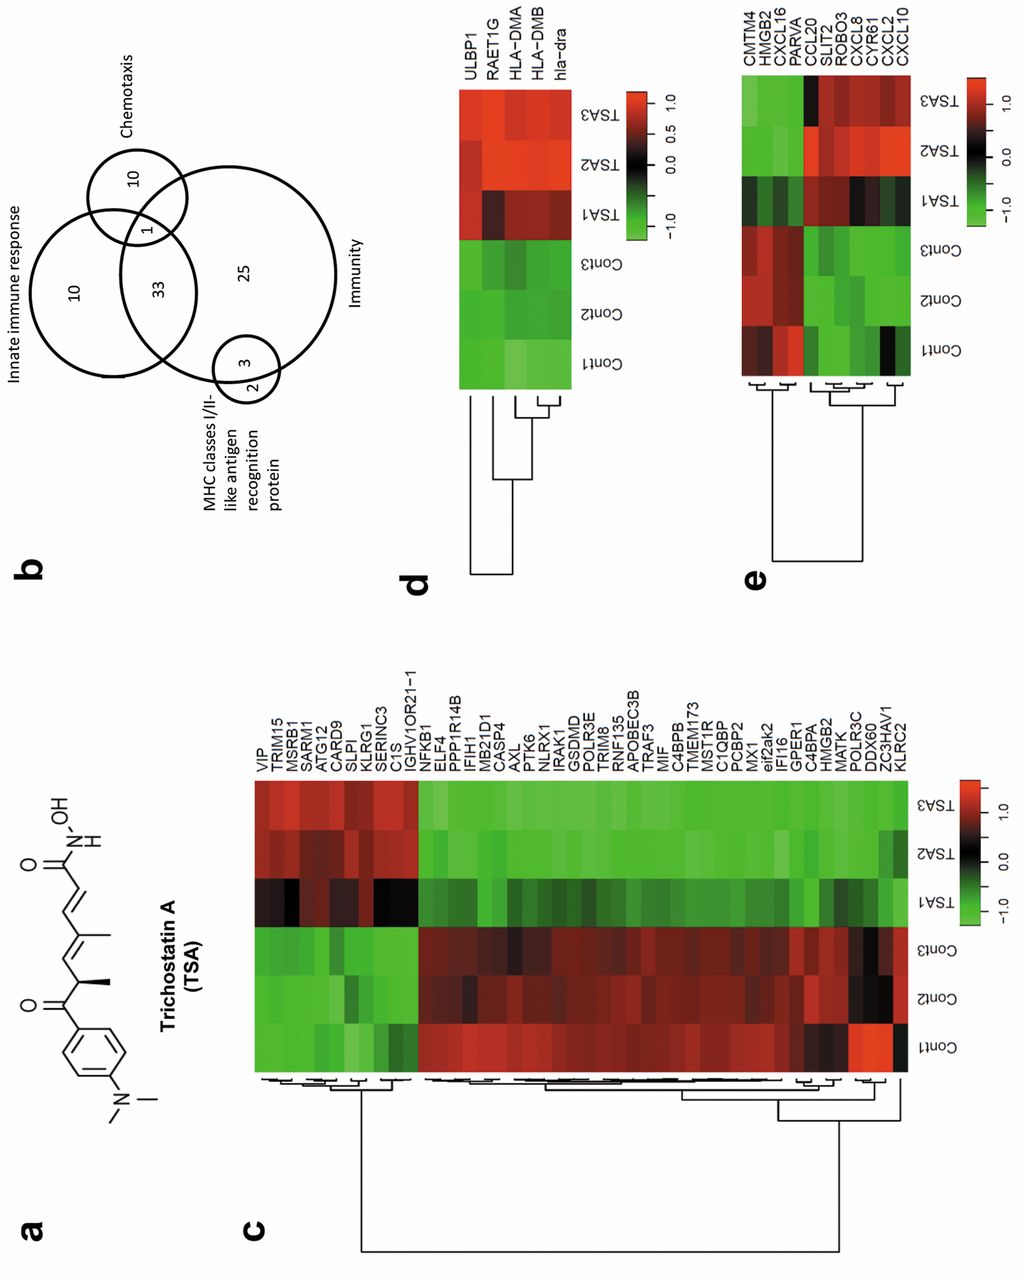
TSA triggered selective regulation of genes associated with innate immunity and antigen-presentation in HCC cells. (a) TSA chemical structure. (b) Venn diagrams displaying the number of differentially expressed genes associated with immunity, innate immune response, chemotaxis, and MHC classes I/II-like antigen recognition proteins regulated in HepG2 cells after TSA treatment. (c) Heat map representation of the expression levels of innate immunity-associated genes that were changed by more than two-fold after TSA treatment of HEpG2 cells in three independent experiments. The gene list for this heat map is shown in Table I. (d) Heat map representation of the expression levels of MHC-classes I/II-like antigen recognition protein associated genes that were changed more than two-fold after TSA treatment of HepG2 cells in three independent experiments. The gene list for this heat map is shown in Table I. (e) Heat map representation of the expression levels of chemotaxis-associated genes that were changed more than two-fold after TSA treatment of Hep G2 cells in three independent experiments. The gene list for this heat map is shown in Table I.
List of genes associated with innate immune response, MHC classes I/II-like antigen recognition protein, and chemotaxis and differentially regulated by TSA treatment in HepG2 cells.
Peripheral blood and NK cell sorting. Peripheral whole blood from healthy donors was obtained from the Red Cross Blood Center (Daejeon, Republic of Korea) and the study protocol was approved by the Institutional Review Board of the Red Cross. NK cells were isolated from whole blood to >95% purity by negative selection using RosetteSep Human Monocyte Cell Enrichment Cocktail & Human NK Cell Enrichment Cocktail (StemCell Technologies) according to the manufacturer's protocol. The isolated NK cells were washed in HBSS plus 4% FBS (Life Technologies), and re-suspended in MEM-α (Life Technologies) containing 20% FBS (Life Technologies), and penicillin-streptomycin (Life Technologies) at 37°C in 5% CO2.
NK cell cytotoxic assay. Evaluation of NK-cell activity was performed using an LHD Cytotoxicity Assay Kit (ThermoFisher). Cell suspensions (100 μl) from the TSA-treated or untreated tumor cell lines HepG2, SNU449, or Huh7 (1.0×10⁶ /ml) were added to 100 μl of NK cells, at either 8.0×10⁶/ml, 4.0×10⁶/ml, and 2.0×10⁶/ml, in RPMI 1640 medium (Life Technologies) to provide effector to target cell ratios (E:T) of 0.5:1 and 1:1, and the cells were incubated in 96-microwell plates (Life Technologies) for 4 h at 37°C in a humid atmosphere containing 5% CO2. Following this, the plates were centrifuged for 5 min at 200 × g and 100 μl of supernatant from each well were transferred to a 96-well flat-bottomed plates and 100 μl of lactic acid dehydrogenase substrate mixture was added. Color development (5 min in the dark), was measured at 492-630 nm using a microtiter plate reader (TECAN, Melbourne, Australia). The mean cytotoxicity percentage was calculated as follows: (LDH experimental - LDH spontaneous - LDH from NK cells)/(LDH maximal - LDH spontaneous) ×100 (%). LDH experimental release represents the LDH release activity arising from the NK cells and tumor cells co-culture. Spontaneous LDH release activities from tumor and NK cells were obtained from individual cultures respectively. The maximal release of LDH activity was obtained following lysis of the tumor cells, using ultrasound (Soniprep 1500, Behring, Germany).
DAPI staining assay. The effect of TSA on nuclear morphology was evaluated by DAPI staining. HepG2 cells were incubated with TSA (0, 1, 2 and 5 μM) for 48 h. The cells were then exposed to fixative for 20 min and stained with DAPI (Life Technologies) for 10 min in the dark. The labeled cells were visualized under a fluorescence microscope and then photographed.
Cell viability and proliferation assay. Cell proliferation was assessed using the EZ-Cytox Enhanced cell viability assay kit from ITSBIO (Seoul, Republic of Korea). Briefly, the appropriate number of cells were plated in each well of a 96-well plate and exposed to different concentrations of TSA for 24 and 48 h. Following this, the tetrazolium salt reagent was added and the cells were incubated for 2 h. At the end of this time, the absorbance in each well was measured at 450 nm using a microplate reader. The relative cell viability (%) was calculated using the equation ODT/ODC ×100% (where ODT represents the absorbance of the treatment group, and ODc represents the absorbance of the control group). The median inhibitory concentration (IC50) was defined as the drug concentration required to inhibit 50% of the cells relative to the controls. IC50 values were estimated from the dose-response curve.
Apoptosis assay. Apoptotic cells were detected by annexin V-FITC and propidium iodide (PI) staining using the FITC-Annexin V apoptosis detection kit with PI (BioLegend) according to the manufacturer's instructions. The stained cells were analyzed using MACSQuant®VYB (Miltenyi Biotec).
Statistical analysis. Analysis of variance was performed for multiple comparisons. Unpaired t-tests were performed to analyze the differences between two groups. Statistical analyses were performed using the Prism software package (GraphPad Software, San Diego, CA, USA). Differences were considered significant at p≤0.05.
Results
TSA triggers selective expression of genes associated with immune modulation in HCC cells. Although the anti-HCC effect of TSA (chemical structure is shown in Figure 1a) has been previously reported (15, 16), the mechanism by which TSA affects HCC has not been clearly defined. In this study, we performed a microarray analysis to investigate the transcriptional changes in HepG2 cells, which are HCC cells, following treatment with 0.5 μM TSA compared to those in cells treated with vehicle (DMSO). The analysis identified 1,216 genes that were up-regulated by ≥2-fold and 1,591 genes that were down-regulated by ≥2-fold in TSA-treated versus vehicle-treated HepG2 cells. To understand the global biological significance of these data, we further analyzed these differentially expressed genes by functional enrichment analysis using the DAVID database (19). Among the 2,807 differentially-expressed genes, 2,143 genes were selected for further analysis, after removing duplicated gene names and genes that could not be identified in the database. Since gene ontology (GO) annotations are important for the investigation of functional significance from large datasets, we used the GO annotations based on the Gene ontology consortium (20) and found that ‘innate immune response’ was one of the major GO annotations associated with TSA treatment. TSA differentially affected the expression of 44 genes associated with innate immunity as shown in Figure 1b. Among the 44 genes associated with innate immunity that were significantly differentially regulated in HepG2 cells by TSA, 11 were up-regulated and 33 were down-regulated (Figure 1c). Because of the significant alternation of genes associated with innate immunity, we then explored which HCC immune escape mechanisms were regulated by TSA.
To escape the immune response, many types of tumor cells down-regulate antigen-recognition associated proteins (21). Interestingly, five important genes associated with MHC class I/II-like antigen recognition proteins were significantly up-regulated by ≥2-fold in our microarray data (Figure 1d). Among these five genes, UL16-binding protein (ULBP)1 and RAE1G are known to be ligands for NK cells that allow for recognition and killing of target cells (22, 23). Both ULPB1 and RAE1G were significantly up-regulated by TSA (Figure 2d). These data suggested that recognition of HCC cells by NK cells might be regulated by TSA treatment of HCC cells. Specifically, ULBP1, one of the ligands for natural killer group-2 member-D (NKG2D) activator receptors on NK cells, might be one of the critical components in the mechanism triggered by TSA that enhances susceptibility to NK cell killing.
In addition, 11 genes associated with chemotaxis were significantly up-regulated or down-regulated by ≥2-fold in our microarray data (Figure 1e). These data suggest that TSA also regulates immune cell migration into tumor tissue in HCC. In summary, we found a major alternation in immune-associated genes in TSA-treated HepG2 cells, particularly with respect to innate immunity-related genes and antigen-recognition-related genes. These data also strongly suggested that TSA induced NK cell-mediated anti-tumor effects in HCC. We then attempted to confirm the effect of TSA on the expression of ligands associated with the recognition of HCC cells by NK cells.
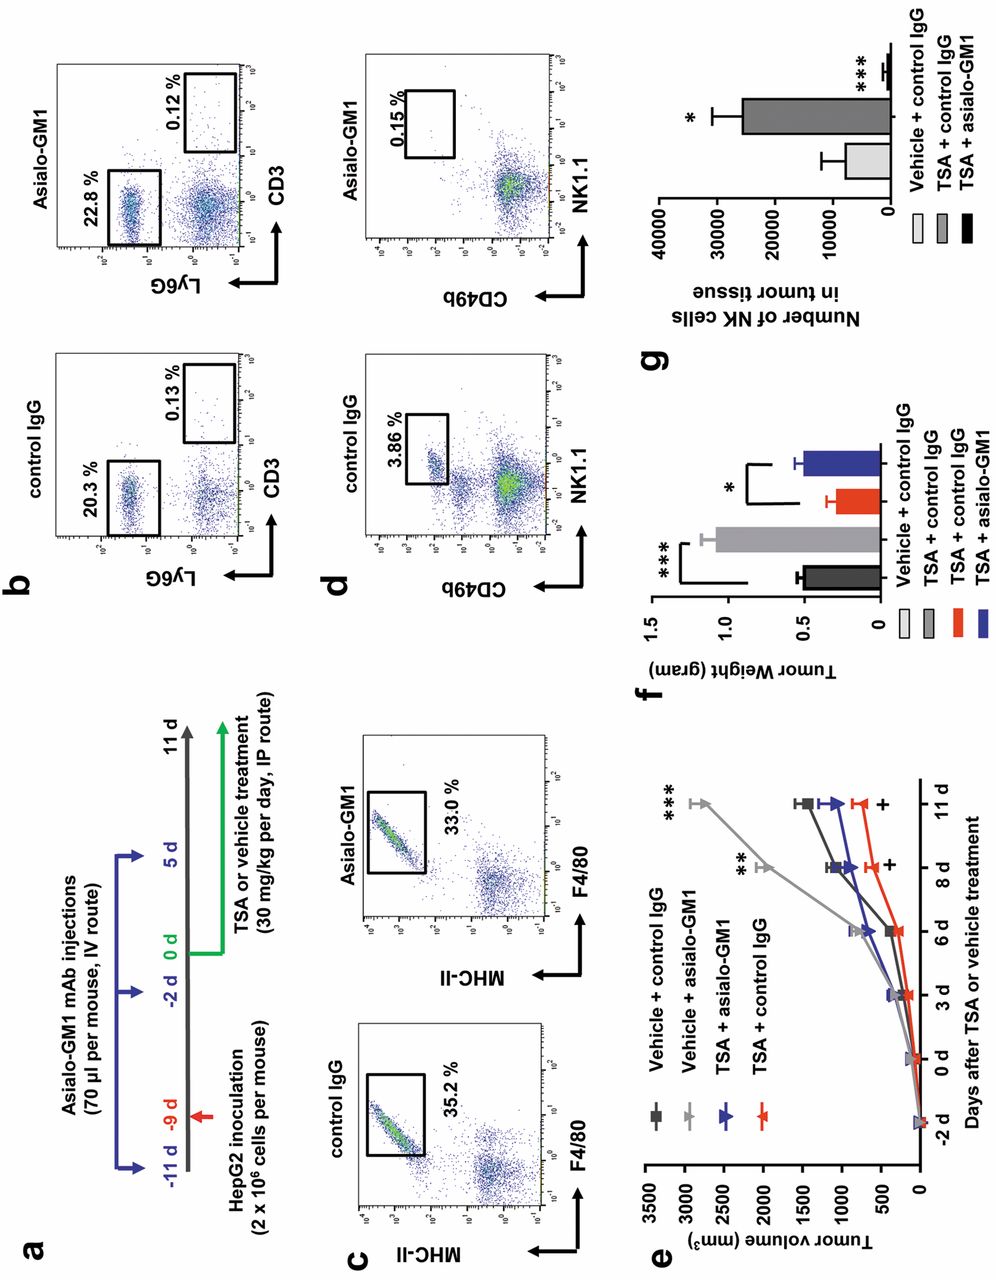
TSA enhanced NK cell cytotoxicity in HCC cells in the Hepa1-6 carcinoma-bearing mouse model. As described above, TSA induced differential expression of immune-modulatory genes, in particular those related to innate immunity and MHC-classes I/II like antigen recognition protein and chemotaxis, which might suggest an NK cell-mediated anti-HCC effect of TSA. As previously reported (24), NK cells are the most potent anti-tumor innate immune cells, and are one of the major target cells for used by various cancers for immune escape. We hypothesized that TSA might regulate the susceptibility of HCC cells to NK cell-mediated killing and designed an in vivo study to address this (see the scheme in Figure 2a). To investigate NK cell-mediated changes in HCCs triggered by TSA, we wished to eliminate the potential effect of other potent anti-tumor immune cells, specifically T cells, which form part of the adaptive immune system. For this purpose, we selected to use BALB/c nude mice that lack T cells, and as a result do not develop an adaptive immune system. We established an HCC tumor xenograft model in BALB/c nude mice, using Hepa1-6 carcinoma cells. As shown in Figure 2b, peripheral blood from BALB/c nude mice lacked CD3+ T cells, regardless of anti-asialo-GM1 antibody treatment. However, these mice were equipped with functional Ly6G+ myeloid cells (representing granuolocytes, macrophages, neutrophils, and monocytes) and F4/80+ and MHC-II+ macrophages (Figure 2b and c). Importantly, BALB/c nude mice have functional NK cells (CD49b+ and NK1.1+), as shown in Figure 2d. Administration of an anti-asialo-GM1 antibody to BALB/c nude mice eliminated almost all NK cells, as shown in Figure 2d. Importantly, we found that TSA significantly reduced the Hepa1-6 tumor size in BALB/c nude mice, as shown in Figure 2e. We investigated whether the effects of TSA on tumor suppression in the Hepa1-6 carcinoma mouse model was mediated by NK cells by comparing the growth of the Hepa1-6 carcinoma in mice, with and without deletion of NK cells, (achieved by i.v. injection of an anti-asialo-GM1 antibody). The anti-asialo-GM1 antibody injection specifically eliminated NK cells in mice (Figure 2d) and did not change the percentage of myeloid cells and macrophages (Figure 2b and c). Importantly, NK cell-deletion did reduce the magnitude of the TSA-induced reduction in Hepa1-6 carcinoma size in these tumor-bearing mice (Figure 2e). However, there was not a complete reversal of the TSA effect. These results strongly suggest that NK cells play a critical role in the anti-tumor effect of TSA in HCC cells in vivo, and that another non-NK cell mechanism also contributes to the anti-tumor effect. We also analyzed the weight of tumors from mice when they were sacrificed at the end of experiment. Tumor weights of each treated group of mice showed similar pattern from the sizes measured during the experiment (Figure 2f). We also analyzed the number of infiltrated NK cells in the tumor, because we found that, based on our microarray data, various chemokines, including CXCL10, a ligand for the chemokine receptor CXCR3, were up-regulated by TSA in HCC cells. Importantly, we found that number of NK cells was significantly increased in tumors from TSA-treated mice compared to that in control IgG-treated mice. We also found that injection of the anti-asialo-GM1 antibody almost completely eliminated the infiltrated NK cells in the tumor (Figure 2g).

NK cell-dependent effects of TSA in a HCC xenograft mouse model. (a) Schematic plot of the study design and route of injection for therapeutic efficacy. (b) Representative dot plot images showing abrogation of LY6G+ cells and (c) MHC-II+ F4/80+ macrophages in Balb/c nude mice following anti-asialo-GM1 antibody injection. (d) Representative dot plot images showing abrogation of CD49b+ NK1.1+ NK cells in Balb/c nude mice following anti-asialo-GM1 antibody injection. (e) The mice were depleted of NK cells, using the anti-asialo-GM1-antibody, or were injected with IgG isotype antibody prior to, and after, tumor cell implantation, as described in Materials and Methods (n=6 mice). Tumor size was measured at the indicated days. (f) Tumor weight of each group of mice (n=6) at day 11 of the experiment. (g) Number of NK cells in the tumor tissues of mice (n=6).

NKG2D ligand-dependent effect of TSA on HCC cells toward NK cell cytotoxicity. (a) HepG2 cells were pre-treated with DMSO (control) and 0.5 μM TSA for 48 h, followed by coculture with NK cells for 4 h and apoptosis analyzed by flow cytometry. HepG2 cells (CD56-negative) were gated with CD56 staining. Representative dot plots show the percentage (%) of Annexin V and PI double-positive cells (apoptotic cells) from three different independent experiments. (b) Cell cytotoxicity in co-cultures of HepG2, SNU449, or Huh7 cells with NK cells. The HepG2, SNU449, or Huh7 cultures were pre-treated with TSA or DMSO. Pooled results are shown from three independent flow cytometry experiments. *, **, significant differences from control (untreated) cells based on two-tailed unpaired Student's t-tests at p<0.05 and p<0.01, respectively. The error bar denotes SEM. The ratios of NK to HepG2, SNU449, or Huh7 cells are indicated. (c) Total RNA was extracted from the HepG2 cells treated with DMSO (control) or with 0.5 μM and 1 μM TSA, and analyzed for the relative expression levels of ULPB1, ULBP2, and ULBP3. Data from three independent experiments were pooled. *significant difference from the control (untreated) by two-tailed unpaired Student's t-tests at p<0.05. Error bars denote SEM. (d) HepG2 cells were treated with DMSO (control) or with 0.5 μM and 1 μM TSA for 48 h. Total RNA was extracted from the cells and analyzed for the relative expression level of MICA and MICB. Data from three independent experiments were pooled. (e) HepG2 cells were treated with DMSO (control), or with 0.5 μM and 1 μM TSA, and analyzed by flow cytometry with an antibody against MICA/B. The results shown are representative of three independent experiments. (f) HepG2 cells were pre-treated with DMSO (control) or 0.5 μM TSA for 48 h, followed by a co-culture with NK cells for 4 h. NK cell cytotoxicity was measured using an LDH cytotoxicity assay kit with or without NKG2D blocking antibody. The ratios of NK cells to HepG2 cells are shown. *, **, ns, significant differences from the control (untreated) based by two-tailed unpaired Student's t-tests at p<0.05, p<0.01, not significant, respectively. Error bars denote SEM.
TSA enhanced NK cell cytotoxicity in HCC cells in vitro. On the basis of the above findings, we attempted to understand, using an in vitro experiment, how TSA enhanced the NK cell killing capacity toward HCC cells. First, we investigated the direct effect of TSA on NK cells. For this purpose, we treated NK cells isolated from human peripheral blood, with and without TSA, overnight and then co-cultured the treated NK cells with HepG2, SNU449, or Huh7 HCC cells for 4 h to assess the killing capacity of the NK cells. Based on a previous study (25), histone deacetylase inhibitors including TSA did not enhance NK cell activation and viability. Moreover, some histone deacetylase inhibitors could impair NK cell viability and activation in the dose-dependent manner. In our study, we found that NK cell activity might not be impaired in the doses of our in vivo and in vitro experimental designs. However, we found that TSA did not enhance the killing capacity of NK cells (data not shown).
Thus, we hypothesized that the NK cell-mediated enhanced anti-tumor effect of TSA on HCC cells might instead be caused by an increase in susceptibility of HCC cells to NK cell killing, caused by TSA-mediated changes in the expression of various HCC genes. To assess this, we pre-treated HepG2 cells with TSA for 2 days, and then analyzed the cytotoxicity of human primary NK cells isolated from peripheral blood on the HepG2 cells after removal of the TSA.
Interestingly, TSA-treated HepG2 cells showed a potent increase in susceptibility to NK cell killing compared to untreated HepG2 cells when cultured at a 1:1 ratio of NK cells to HepG2 cells (Figure 3a). While NK cells converted only 8.38% of HepG2 cells into the apoptotic state without TSA treatment, NK cells converted 42.3% of the HepG2 cells that had been treated with 0.5 μM TSA. Furthermore, the TSA-mediated increase in susceptibility to NK cells was also seen in the other HCC cells, SNU449 and Huh7 (Figure 3b). Increasing the ratio of NK cells to TSA-treated HCC cells significantly increased the extent of HCC cell killing (Figure 3b) compared to the NK cell-mediated killing of untreated HepG2, SNU449, and Huh7 cells respectively. These data strongly suggest that a common mechanism exists to enhance the susceptibility of HCC cells to NK cell killing that can be triggered by TSA. Thus, we attempted to understand the TSA-mediated mechanism in HCC cells, by analyzing the genome-wide transcriptional changes in TSA-treated HepG2 cells.
TSA regulated expression of NKG2D ligands on HCC cells toward NK cell cytotoxicity. To extend our findings, we measured the mRNA levels of ULPB1, ULPB2, ULPB3, and major histocompatibility complex class I-related chain (MIC)-A and B, which are known to be NKG2D ligands. For this purpose, HepG2 cells were cultured in the absence or presence of 0.5 and 1.0 μM TSA. Total RNA was extracted from the cells and the mRNA expression of ULPB1, ULBP2, and ULBP3 were analyzed by qPCR (Figure 3c); the mRNA levels of MICA/B were also analyzed using this method (Figure 3d). In addition, the protein expression levels of MICA/B were assessed by flow cytometry using an antibody against MICA/B (Figure 3e). We found that TSA treatment of HepG2 cells significantly increased the expression of ULPB1, ULPB2, ULPB3, and MICA/B (Figure 3c, d and e). To functionally assess the role of an NKG2D ligand in NK-mediated killing of HCC cells, we measured NK-induced cell cytotoxicity in co-cultures with HepG2 cells that had had been treated or not with TSA, along with blockade of NKG2D with an anti-NKG2D antibody after TSA treatment. Cell cytoxicity was assessed using a lactate dehydrogenase activity assay (LDH) cytotoxicity assay kit. Notably, blockade of NKG2D significantly reduced TSA mediated-enhanced NK cytotoxicity (Figure 3f).
TSA is also a potent cytotoxic agent in HCC cells. The data obtained so far showed that TSA enhanced NK cytotoxicity against HCC cells both in vivo and in vitro. However, we were also interested in assessing the direct cytotoxic effect of TSA against HCC cells. To assess this, we measured the direct effect of TSA on cell viability and proliferation of HepG2, Huh7, and SNU449 cells, using the EZ-Cytox Enhanced cell viability assay (Figure 4a). The IC50 values for TSA-mediated cell cytotoxicity were calculated from the respective dose-response curves. Importantly, the HepG2, Huh7, and SNU449 were all sensitive to TSA (IC50s for HepG2, Huh7 and SNU449 cells were 1.085 μM, 0.954 μM, and 0.859 μM respectively). To confirm this cytotoxic effect of TSA, we observed cell morphology after two days of culture of HepG2, Huh7, and SNU449 cells in the presence of 2 μM TSA. We observed a TSA-mediated reduction in HepG2, Huh7, and SNU449 cell densities under the light microscope (Figure 4b). In addition, there was a significant reduction in the number of live HepG2, Huh7, and SNU449 cells in the presence of 2 μM of TSA, compared to that in its absence (Figure 4c).

Inhibitory effects of TSA on HCC cells. (a) Percent cell proliferation inhibition caused by TSA treatment in HepG2, Huh7, and SNU449 cells was determined and data were pooled from three independent experiments. The indicated IC50 values were estimated from the dose-response curve. (b) HepG2, Huh7, and SNU449 cells were treated with DMSO (control) and 2 μM TSA for 48 h and photographs were taken under a light microscope. Representative images from more than three independent experiments are shown. (c) HepG2, Huh7, and SNU449 cells were treated with DMSO (control) and 2 μM TSA for 48 h and live cell counting was performed using tryptophan blue staining. Relative values were calculated and the pooled data from three independent experiments are shown.

Induction of apoptosis in HCC cells by TSA. (a) HepG2 cells were treated with DMSO (control), or with 1 μM and 2 μM TSA for 48 h and apoptosis assessed. Representative dot plots showing the percentage (%) of Annexin V and PI double-positive cells (apoptotic cells) from three different independent experiments are shown. (b) Percentage (%) of dead cells in Huh7, SNU449, and HepG2 cell cultures treated with the indicated concentrations of TSA. Data were pooled from three independent flow cytometry experiments. **, ***, significant differences from the control (untreated) based on two-tailed unpaired Student's t-tests at p<0.01 and p<0.005, respectively. Error bars denote SEM. (c) HepG2 and Huh7 cells were treated with DMSO, or with 1 μM and 2 μM TSA for 48 h. Cell lysates were analyzed by immunoblot analysis with antibodies against cleaved caspase-3 and PARP. β-actin expression was analyzed as a loading control. The data shown are representative of three independent experiments. (d) Ratio of cleaved caspase-3 to β-actin and (e) ratio of cleaved PARP to β-actin calculated based on Western blot band intensities. Data from three independent experiments were pooled. **, ***, significant differences from the control (untreated) based on two-tailed unpaired Student's t-tests at p<0.01 and p<0.005, respectively. Error bars denote SEM. (f) HepG2 cells were treated with DMSO (control), or with 1 μM and 2 μM TSA for 48 h. DAPI staining was performed and photographs were taken under a fluorescence microscope. Representative images from more than three independent experiments are shown. White arrows indicate nuclei with morphology characteristic of apoptosis.
TSA induced apoptosis in HCC cells. To understand whether the inhibitory effect of TSA HCC cell proliferation was mediated by the apoptotic process, we stained untreated and TSA-treated HepG2 cells with Annexin V and PI and performed flow cytometry. We found that the proportion of apoptotic HepG2 cells (Annexin V-positive and PI-positive) increased in a TSA-dose dependent manner (Figure 5a). Similar effects on apoptosis were also noted for Huh7 and SNU449 cells after treatment with 0, 0.5, 1, and 2 μM TSA. In all cases, the percent of apoptotic cells increased in a TSA-dose dependent manner (Figure 5b). We also analyzed the levels of caspase 3, a critical player in the apoptotic process, by the western blot method. We found that TSA treatment increased the levels of cleaved (active) caspase 3 in HepG2 and Huh7 cells (Figure 5c and d). Furthermore, PARP, a critical DNA repair protein, was also cleaved by TSA treatment in HepG2 and Huh7 cells (Figure 5c and e). In these experiments, β-actin expression was used as a loading control. Finally, we found that TSA treatment increased nuclear fragmentation and apoptotic bodies in a dose-dependent manner (Figure 5f).
Discussion
HDACs are critical enzymes for the deacetylation of histone and are thus important in the regulation of transcription of a broad range of genes. They are also known for their critical role in tumor development and malignancy (4, 26, 27). Although the anti-tumor effect of TSA has been demonstrated in some malignant tumors, these studies have focused on regulation of the cell cycle and apoptosis by TSA (26-28). However, the effect of the immune system on tumor development is also important (31, 32, 33, 34). There are several recent reports that show an unexpected effect of TSA in regulating the immune system in various tumors (35, 36). For example, HDACs are known to play critical roles in the immune escape mechanism of several tumor cells, such as melanoma cells and lymphoma cells (35, 36). In melanoma cells (B16F10 cells), HDACs were shown to have a role in the reduction of MHC class I-associated antigen processing and presentation. Also, HDACs inhibit the expression of CD1d, a non-classical MHC class I-like molecule in lymphoma cells (LCD1dwt cells). Inhibition of the expression of the MHC class I-associated genes, TAP1, TAP2, LMP2, LMP7, and Tapasin, makes it difficult for CD8+ T cells to recognize tumor cells (36). Similarly, down-regulation of CD1d on tumor cells makes it difficult for NKT cells to respond to tumor cells (35). This immune depression in the respective tumor cells limits recognition by CD8+ T cells and NKT cells and is thought to be a critical strategy for tumor growth and survival. Thus, blocking this immune escape mechanism, by HDAC inhibition with TSA, could block this immune escape mechanism.
Compared to data from previous studies, our data suggested that TSA had a broad effect on immune response pathways. On the basis of our microarray data, we found that the largest GO annotation was immunity, with 62 differentially-expressed genes (DEGs), and within this set, 34 DEGs were involved in the innate immune response (Figure 1b). In fact, approximately 53% of immunity-related DEGs were involved in the innate immune response. In addition, we found 10 more innate immune response-related DEGs that were not captured in the immunity GO annotation (Figure 1b). Moreover, 10 chemotaxis and two MHC-classes I/II-like antigen recognition protein-related DEGs, which were also not captured in the immunity GO annotation, were discovered to be induced by TSA in HCCs (Figure 1b). Thus, we hypothesized that the innate immune response associated gene alternations induced by TSA in HCCs could be a major mechanism for TSA-mediated immune modulation. Among the innate immune response genes found in our microarray data, we noted that there was upregulation of ULBP1 and RAET1G, which are NKG2D ligands. By qPCR, we found that the NKG2D ligands ULBP1, 2, 3, as well as MIC-A and B, that are important in NK cell recognition of HCCs, were up-regulated by TSA treatment, thereby rendering the HCCs susceptible to NK cell-mediated lysis (Figure 3c, d and e). In addition, the anti-tumor effect of TSA was significantly reduced by blocking the NKG2D receptor with a blocking antibody (Figure 3f). From these data, the regulation of genes associated with innate immunity in HCC cells might be associated with susceptibility of the HCC cells to NK cell-mediated killing. Even though we did not investigate the effect of TSA on other innate immune cells, such as macrophages, monocytes, and myeloid-derived suppressor cells (MDSCs), we still need to study further the interaction between macrophages, monocytes, and myeloid-derived suppressor cells (MDSCs) and TSA-stimulated HCC cells in order to completely understand the whole innate immune response.
Nevertheless, NK cells are one of the main players in the first-line defense against tumor growth among innate immune cells (37). Thus, the effect of TSA on NK cell-mediated tumor killing could be critical for the anti-tumor effect of TSA. Our study investigated the effect of TSA on NK cell-mediated tumor killing, using an HCC cell xenograft model in BALB/c nude mice that lack T cells (CD4+ T cells, CD8+ T cells and NKT cells) and an adaptive immune system. In this experimental model, we could eliminate the effect of the potent anti-tumor effective immune cells, namely T cells and NKT cells. Thus, this experimental mouse model allowed us to focus on the NK-mediated effects. Importantly, using an anti-asialo-GM1 antibody to deplete NK cells in vivo reduced the anti-tumor growth effect of TSA as shown in Figure 2e. Taken together, these data suggest that TSA-mediated immune modulation of HCCs affects NK cell recognition, which could be one of the major mechanisms in TSA's anti-HCC effect.
We also found that multiple chemotaxis-related genes were altered by TSA treatment of HepG2 cells and TSA-treated mice had increased infiltration of NK cells into the tumor tissue. Taken together, these results strongly suggest that the TSA-mediated effect on chemotaxis molecules might also be an important component for the anti-tumor effect of TSA against HCCs in vivo. Among the 11 chemotaxis related genes we found altered, the chemokines CCL20, CXCL8, CXCL2, and CXCL10 were significantly upregulated by TSA treatment. CXCL10 is a ligand for CXCR3, which is abundantly expressed on NK cells (38). Thus, upregulation of CXCL10 might be a reason for the enhanced infiltration of NK cells into tumor tissues. CCL20 is also known to be a ligand for chemokine receptor, CCR6, which is expressed on T cells, specifically on Th17 cells and MAIT cells (39). CXCL8 is known for its role in macrophage, monocytes, and neutrophil migration. Although we did not further study the effect of TSA on immune cells, such as T-cells, macrophage, monocytes, and neutrophils, these data suggest that these cell types could also be affected by TSA treatment. Further studies will be required to broaden our knowledge about how TSA induces its anti-HCC effect.
Regardless, this study revealed that TSA stimulated HCC cells to induce changes in the transcription of many genes associated with innate immunity and tumor antigen-recognition; i.e., TSA changed the HCC cells to become responsive to NK cell killing, and also facilitated NK cell migration into tumor tissues. Because it has been an important goal to enhance the immune function of NK cells in patients for successful tumor therapy, our study demonstrating a broad range of transcriptional changes induced by TSA, that are associated with NK cell susceptibility and migration, could be important. In addition, TSA also has a direct effect on HCC cells by directly stimulating apoptosis (Figure 5c). To summarize, our study suggests that the TSA-mediated anti-tumor effect against HCC is related to the TSA-mediated induction of anti-tumor innate immune responses (specifically, NK cell-mediated) and this contributed, at least partially, to the TSA-mediated anti-HCC effect. These data strongly suggest that the immuno-modulatory effect of anticancer drugs should be considered for next-generation drug development.
Footnotes
This article is freely accessible online.
Conflicts of Interest
The Authors declare that they have no conflict of interest.
Research Involving Human Participants and/or Animals
All applicable international, national, and/or institutional guidelines for the care and use of animals were followed. This article does not contain any studies with human participants performed by any of the Authors.
Funding
This work was supported by a grant from the National Research Council of Science & Technology (NST) of the Korean government (MSIP; grant no. CRC-15-02-KRIBB).
- Received June 30, 2017.
- Revision received July 18, 2017.
- Accepted July 20, 2017.
- Copyright© 2017, International Institute of Anticancer Research (Dr. George J. Delinasios), All rights reserved


