


Abstract
Background: It has been proposed that 17-β-estradiol (E2) activates estrogen receptor and inhibits renal cell carcinoma (RCC) growth. In the present study we explored the role of E2 and ER in the regulation of RCC growth. Materials and Methods: The RCC cell line ACHN was treated by E2 combining with E2 antagonist Fulvestrant or ER knockdown, and cell growth was monitored. Quantitative phosphoproteomics was applied to study the E2 regulated non-genomic phosphorylation changes. Western blotting, immunofluorescence microscopy, and apoptosis assays were used for validation. Results: E2 induced ER-dependent growth inhibition in RCC cell lines. Quantitative phosphoproteomics revealed that E2 induced both apoptosis and autophagy. Cellular apoptosis was confirmed by altered mitochondrial membrane potential, and ER-dependent autophagosome formation was also found. Conclusion: Our data revealed the potential dual roles of E2 in regulating RCC growth via autophagy and apoptosis pathways.
Abbreviations: E2: 17-β-estradiol; DMSO: dimethyl sulfoxide; FITC: fluorescein isothiocyanate; GFP: green fluorescent protein; IC50: half maximal inhibitory concentrations; RCC: renal cell carcinoma; shRNA: short-hairpin RNA; TEAB: triethylammonium bicarbonate; VHL: von Hippel–Lindau.
Renal cell carcinoma (RCC) is the major cause of death in patients with kidney cancers (~85% in adults) (1). After nephrectomy for localized RCC, about one-third of patients with initially localized cancer develop distant metastases at a median of 1.3 years (2). In addition to surgery, several therapeutic approaches are currently available, including immunotherapy, vascular endothelial growth factor (anti-angiogenic therapy), and mTOR (targeted therapy) (3). Although the application of these treatment options has improved the overall survival of patients with metastatic RCC, the expected 5-year survival rate still only approximately reaches 10% (4). Therefore, there is an urgent need to develop other therapeutic regimens and to study the mechanisms underlying RCC tumorigenesis.
It has been hypothesized that 17-β-estradiol, or E2, can inhibit RCC pathogenesis because women who have received hysterectomy have a higher risk of RCC (5). Two classical estrogen receptors (ERs), ER1 and ER2, have been shown to induce E2-dependent transactivation of target genes in RCC samples (6). Alternatively, E2 induces nongenomic, ER2-dependent signaling pathways to inhibit RCC growth, such as the perturbation of EGFR-related signaling pathways (e.g., AKT, ERK, and JAK pathways) and the activation of the caspase 3 cascade (7). However, it remains unclear whether there exist other mechanisms to regulate RCC growth in response to E2-induced signaling events.
In the present study, we aimed to investigate the roles of ER1 and ER2 in the RCC growth in response to E2 treatment using in vitro RCC cell line. We also further explored other potential E2-responsive signaling targets by quantitative phosphoproteomics using dimethyl labeling approach. Selected protein targets from phosphoproteomics were further validated.
Materials and Methods
Chemicals and antibodies. All chemicals, unless specified otherwise, were purchased from Sigma-Aldrich (St. Louis, MO, USA). The primary antibodies used in western blotting were anti-LC3B (GTX127375; GeneTex, Irvine, CA, USA), anti-SQSTM1/p62 (No. 5114; Cell Signaling, Beverly, MA, USA), anti-phospho-SQSTM1/p62 (Thr269/Ser272) (No. 13121; Cell Signaling), and anti-β-actin (GTX30632; GeneTex). The primary antibodies used in immunofluorescence microscopy anti-p62 (ab56416; Abcam, Cambridge, UK) and anti-LC3B (ab48394; Abcam), and anti-LC3C (ab168813; Abcam). The secondary antibodies used to detect p62 and LC3 (LC3B or LC3C) were FITC-conjugated goat anti-mouse IgG antibody (AP124F; Millipore, Temecula, CA, USA) and DyLight 550-conjugated goat anti-rabbit IgG antibody (#84541, Thermo Scientific, Grand Island, NY, USA).
Cell culture and treatment. All chemicals, unless otherwise specified, were purchased from Sigma-Aldrich. The RCC cell lines ACHN (ATCC CRL-1611) and A-498 (ATCC CRL-7908) were purchased from the Bioresource Collection and Research Center (BCRC, Hsinchu, Taiwan). The RCC cells were maintained in Eagle's minimum essential medium (without phenol red) supplemented with 10% fetal bovine serum (Life Technologies, Grand Island, NY, USA).
For the E2 treatment, the RCC cells were cultured in 96-well plates (2.5×10³ cells/well in 100 μL culture medium) or 10-cm culture dish (2.0×10⁵ cells/dish in 10 mL culture medium) for 24 h. On the day of E2 treatment, culture medium containing freshly prepared E2 stock solution (1,000× concentrated) in dimethyl sulfoxide (DMSO) was added, and the cells were incubated for 48 h. For Fulvestrant pre-treatment, 1 μM of Fulvestrant in DMSO (final concentration) was added to the cell culture for 15 min prior to E2 treatment. In all experiments, the total DMSO concentration was kept at 0.1%.
Cell growth assay. To determine cell growth by CCK-8, 10 μL of the CCK-8 reagent was added to each well after 48-h E2 treatment. The cells were further incubated in the dark at 37°C for 2 h. The absorbance was measured on a microplate reader with excitation at 450 nm and emission at 630 nm. The relative growth rate was normalized using DMSO-treated cells. For each condition, triplicate measurements and at least duplicate biological replicates were performed.
Detection of mRNA expression levels by quantitative real-time PCR. All cDNAs obtained from cells were isolated using previously described procedures (8). Briefly, 1 μg of total cellular RNA was reverse transcribed into single-stranded cDNAs using an oligo(dT)12–18 primer and the PowerScript Reverse Transcriptase kit (Clontech Laboratories, Mountain View, CA, USA). The relative mRNA levels of specific targets were quantified using qRT–PCR in the presence of a TaqMan probe from the Universal Probe Library for Humans and the TaqMan Master Mix (Roche Diagnostics, Basel, Switzerland). The amplification primers used in the qRT–PCR were designed in accordance with the instructions shown on the Web site of Roche Diagnostics (www.roche-applied-science.com). The results of these analyses were normalized to the expression levels of GAPDH, to avoid sample-to-sample variation. The primer sequences and the number of specific universal probes are ER1 (5’-ATCCACCTGAT GGCCAAG-3’, 5’-GCTCCATGCCTTTGTTACTCA-3’, and UPL Human #17), ER2 (5’-ATGATGGGGCTGATGTGG-3’, 5’-TTCTACGCATTTCCCCTCA-3’, and UPL human #50), and GAPDH (5’-CTCTGCTCCTCCTGTTCGAC-3’, 5’-ACGACCAAATCCGTTG ACTC-3’, and UPL human #60). To estimate the relative expression of ER1 and ER2 in cells, the results of qRT–PCR were compared with the signals of a positive control, the qPCR Human Reference cDNA (Clontech Laboratories). All qRT–PCR data were analyzed using the Light Cycler Software (version 4.05; Roche Diagnostics, Basel, Switzerland). For each condition, triplicate measurements and at least duplicate biological replicates were performed.
Lentivirus-based RNA interference (RNAi) for ERs. For gene silencing, a specific lentivirus-mediated short-hairpin RNA (shRNA) expression system was used. All plasmids and associated lentiviral particles were obtained from the National Core Facility for Manipulation of Gene Function by RNAi, Genomic Research Center, Academia Sinica, Taipei, Taiwan. Two pairs of lentiviruses were used to silence target expression: pLKO.1-ER1 (TRCN0000003300) for ER1 expression, with pLKO.1-Luc (TRCN0000072249) as its control; and pLKO_TRC005-ER2 (TRCN0000364069) for ER2 expression, with pLKO_TRC005 (TRCN0000231719) as its control. Infection of each lentivirus into target RCC cells was performed according to the protocol from the abovementioned core facility. Briefly, 1.25×10⁵ cells were grown in a 6-well plate for 24 h, and a multiplicity of infection (MOI) of 3 was used in subsequent lentiviral infections. Changes in the expression of endogenous target genes were determined by quantitative real-time PCR.
Protein digestion and dimethyl labeling of peptides. Proteins from the total cell lysate were acetone precipitated and resuspended in a digestion buffer containing 50 mM triethylammonium bicarbonate (TEAB) and 8 M urea. The proteins were reduced with 10 mM DTT at room temperature for 30 min, and alkylated with 50 mM iodoacetamide at room temperature in the dark for 30 min. The alkylated products were digested with endopeptidase Lys-C (1:100 w/w) (WAKO, Tokyo, Japan) at room temperature for 2 h. After diluting the digestion mixture with 8-fold volume of 50 mM TEAB, sequencing-grade-modified trypsin (1:100 w/w) (Promega, Mannheim, Germany) was added. The digestion mixture was incubated at room temperature overnight.
Dimethyl labeling of peptides was performed as described previously (9). Peptides from E2-treated and control cells were labeled with isotopic formaldehyde (13CD2O, heavy labeled) and formaldehyde (CH2O, light labeled), respectively. After dimethyl labeling, equal amounts of the heavy and light labeled peptides were mixed and desalted using StageTips with Empore™ SDB-XC disc membrane (3M, St. Paul, MN, USA) (10). The desalted peptides were eluted and stored in 80% ACN and 0.1% TFA.
Phosphopeptide enrichment. The phosphopeptides were enriched by hydroxy acid-modified metal oxide chromatography (HAMMOC) as previously described (11, 12). The HAMMOC tips were prepared by packing 0.5 mg of TiO2 bead (GL Sciences, Tokyo, Japan) into 10-μL C8 StageTips. Two-hundred microgram of the desalted dimethyl-labeled peptides was mixed with an equal volume of solution A (300 mg/mL lactic acid in 80% ACN and 0.1% TFA) and loaded onto a HAMMOC tip, which was pre-equilibrated with solution A. After washing with solution A followed by 80% ACN and 0.1% TFA, the resulting phosphopeptides were eluted sequentially with 0.5 M Na2HPO4, 5% NH4OH, and 5% pyrrolidine. The eluted phosphopeptides were immediately acidified and desalted.
NanoLC-MS/MS analyses. The phosphopeptides were analyzed using nanoLC-MS/MS on a Dionex Ultimate 3000 RSLC nano system (Dionex, Germering, Germany; now Thermo Fisher Scientific, Bremen, Germany) that was online coupled to an LTQ Orbitrap XL mass spectrometer (Thermo Fisher Scientific). Phosphopeptides were resuspended in 0.5% TFA and loaded onto an in-house-prepared 100 μm × 15 cm tip column, packed with 3 μm ReproSil-Pur 120 C18-AQ reverse-phase beads (Dr. Maisch HPLC GmbH, Ammerbuch-Entringen, Germany), and eluted at a flow rate of 500 nL/min. The mobile phases used for nanoLC were 0.5% acetic acid in water (Buffer A) and a mixture of 0.5% acetic acid and 80% ACN (Buffer B). The LC gradient conditions were 5% to 10% Buffer B in 5 min, 10% to 40% Buffer B in 60 min, 40% to 100% Buffer B in 5 min, and 100% Buffer B in 10 min.
The LTQ Orbitrap XL system was operated in the positive ion mode, and a data-dependent mode that switched automatically between full-scan MS and MS/MS acquisition was performed. Full-scan MS spectra (m/z 300–1600) were acquired on the Orbitrap analyzer with a resolution of 60,000 at m/z 400. The 10 most intense precursor ions with charge states ≥+2 were fragmented using collision-induced dissociation in the linear ion trap with a normalized collision energy of 35%. The automated gain control values for full MS and MS/MS were 5.0×10⁵ and 1.0×10⁴, respectively. A lock mass of m/z 445.120024 was applied in all LC-MS/MS analyses (13). In this study, three independent biological batches were analyzed. For each phosphopeptide fraction, at least duplicate LC-MS/MS analyses were performed.
Data analyses. Raw files from LC-MS/MS were analyzed using the MaxQuant software (version 1.3.0.5) (14). Briefly, the peak lists were generated and searched by Andromeda (15), which was included in MaxQuant, against the SWISS-PROT sequence database (version 2012_11 with 20,226 human sequence entries). The enzyme specificity was trypsin with up to two missed cleavages. Cysteine carbamidomethylation was set as a fixed modification. Variable modifications were N-acetylation of proteins, oxidation of methionine, and phosphorylation of serine/threonine/tyrosine. The minimum peptide length was set to seven amino acids. Parent masses and fragment ions were searched with a mass tolerance of 6 ppm and 0.5 Da, respectively. FDRs at the peptide and protein levels were fixed at 1%.
The confidence of phosphorylation site was determined by a posttranslational modification scoring algorithm (16) implemented in MaxQuant, and further categorized into Class I (localization probability >0.75) or Class II (0.5 < localization probability <0.75) sites, accordingly (16). To identify significantly regulated phosphorylation sites, the quantitative information (E2/DMSO or H/L) of each phosphorylation site was filtered using the Benjamini–Hochberg FDR calculation (threshold value <0.05) in the Perseus software (version 1.3.0.4) (14). The significant cutoff thresholds were 1.70 and −1.45 (both were log2 transformed ratios) for up- and down-regulated phosphorylated sites, respectively. All raw files and MaxQuant-generated result data were deposited onto the Proteome Xchange Consortium (17) via the PRIDE partner repository with the dataset identifier PXD001962.
Apoptosis assay. The cellular apoptosis in response to E2 treatment was determined by the loss of mitochondrial potential. Briefly, ACHN cells were cultured (2.0×10⁴ cells/well in 10 μL culture medium) in 96-well plate with black wall and clear bottom (Thermo Scientific), and treated with 28 μM E2 for 24 h. The cellular apoptosis was monitored by JC-10 mitochondrial membrane potential assay (Abcam, Cambridge, MA, USA) following the manufacturer's instruction. The fluorescence intensity at excitation/emission=490/525 nm (for apoptotic cells) or 540/590 nm (for normal cells) were measured by Infinite M200 PRO microplate reader (Tecan, Mannedorf, Switzerland). In addition, the fluorescent images were captured using an Olympus IX70 fluorescent microscope (Olympus, Tokyo, Japan). For each condition, triplicate measurements were performed.
Western blotting. Total cellular lysates were prepared using the PRO-PREP Protein Extraction Solution (iNtRON Biotechnology, Seongnam, Korea), and the protein concentration was determined using the BCA Protein Assay (Thermo Scientific). Twenty micrograms of total cell lysates were separated by SDS–PAGE and transferred onto a polyvinylidene fluoride membrane. The membrane was blocked with a blocking buffer containing 5% non-fat milk in TBS-T buffer (137 mM NaCl, 20 mM Tris at pH 7.4, and 0.1% Tween-20) for 1 h at room temperature. The membrane was incubated with the primary antibody of interest at a dilution of 1:1,000 (v/v) in the blocking buffer for 1 h at room temperature. After washing with TBS-T buffer, the membrane was incubated with a secondary antibody conjugated to horseradish peroxidase, and immune-specific signals were detected using the Western Lightning Plus-ECL Enhanced Luminol Reagent (PK-NEL105, PerkinElmer, Waltham, MA, USA) and captured on a FluorChem FC2 system (Alpha Innotech, Santa Clara, CA, USA). For each condition, at least two biological replicates were performed.
Immunofluorescence microscopy. For the detection of autophagosomes, a lentivirus-mediated green fluorescent protein (GFP)-p62/SQSTM1 LentiBrite Lentiviral Biosensors (Merck Millipore, Merck KGaA, Darmstadt, Germany) was used. The viral particles carrying pLKO_AS7w.eGFP.puro were obtained from the National RNAi Core Facility, Academia Sinica, Taiwan. Briefly, 1.25×10⁵ cells/well were grown in a 6-well plate for 24 h, and the indicated MOIs (30 for the GFP-p62 group and 3 for the GFP control group) were used in lentiviral infections. The E2-treated ACHN cells were further cultured in medium containing E2 (28 μM) for 48 h.
The protein of interests were determined by sequential double staining with anti-p62 and anti-LC3 antibodies. The secondary antibodies used to detect p62 and LC3 (LC3B or LC3C) were fluorescein isothiocyanate (FITC)-conjugated goat anti-mouse IgG antibody and DyLight 550-conjugated goat anti-rabbit IgG antibody, respectively. Green fluorescence of p62 aggregations were quantitated using Adobe Photoshop CC (Ver. 14.0; Adobe Systems, San Jose, CA, USA) in randomly chosen fields. Statistical analyses were performed using the Mann–Whitney U-test in SPSS software (Ver. 13.0; SPSS, Somers, NY, USA). p<0.05 was considered statistically significant. For each condition, at least two biological replicates were performed.
Results
ER-dependent growth inhibition of RCC cell lines by E2. We first asked whether E2 could affect RCC cell growth in vitro. Because VHL (von Hippel–Lindau) mutations have been shown to associate with RCC pathogenesis (18), we chose two commonly used RCC cell lines, i.e. ACHN (VHL+/+) and A-498 (VHL mutated), for the study. We found that E2 induced a dose-dependent growth inhibition in two RCC cell lines (Figure 1A and B). In both cell lines, the estimated IC50 value at 48 h was ~28 μM. To rule-out possible artifacts in the high micro-molar range of E2 treatment, we also treated ACHN and A-498 cells with another sex hormone, androgen, at the same concentration range. We found that androgen showed no cytotoxicity, even at 50 μM (Figure 1C and data not shown). Collectively, our data suggested that E2 inhibits cellular growth in RCC cell lines.
It has been recognized that ER activation by E2 can induce downstream cellular effects. In order to determine the potential role of ER in the E2-induced growth inhibition, a non-steroidal E2 antagonist, Fulvestrant, was used to interfere E2 binding (19). The pre-treatment of RCC cells with Fulvestrant led to the partial rescue of the E2-induced growth inhibition in ACHN cells (Figure 1A), but not in A-498 cells (Figure 1B). The rescue effect of Fulvestrant was more profound at a relatively high concentration of E2 (i.e., 25 μM) in ACHN cells (Figure 1A). Taken together, our data suggest that, at least in ACHN cells, E2 inhibits the RCC cellular growth partly by binding to ER.
Both ER1 and ER2 are important for E2-induced growth inhibition. We next asked which ER sub-type was important for E2-induced growth inhibition. Both ERs were expressed in ACHN and A-498 cells, and ER2 had a higher expression level than did ER1 (Figure 1D). In addition, ACHN cells exhibited a higher ER expression than did A-498 cells (Figure 1D). The differential expression levels of ER subtypes in ACHN and A-498 cells suggested that ACHN cells were more sensitive to Fulvestrant-based reversal of E2-induced growth inhibition (Figure 1A). Therefore, we selected ACHN cells for downstream studies.
After knockdown of either ER1 or ER2 by shRNA, we checked the effect of E2 on ACHN cell growth (Figure 1E). In either ER1-silent or ER2-silent ACHN cells, the E2-induced growth inhibition was partly reduced. The relative cell growth rate increased from 56.7% to 86.8% for ER1-silent and from 56.1% to 76.6% for ER2-silent cells at 28 μM E2 (Figure 1F). This result indicates that both ER1 and ER2 are important for E2-induced growth inhibition in ACHN cells.
Quantitative phosphoproteomics revealed the roles of apoptosis and autophagy. One major response of ERs to E2 binding is a series of protein phosphorylation events that coordinate gene expression (20). To better understand the mechanism underlying E2-mediated growth inhibition in ACHN cells, we treated ACHN cells with 28 μM E2 and the total cell lysates were subjected to quantitative phosphoproteomics study. By using dimethyl labeling strategy (9), the E2-treated and DMSO-control cellular peptides were heavy- and light-labeled, respectively. After phosphopeptide enrichment (11, 12) and LC-MS/MS, we totally quantified 1,364 phosphorylation sites that corresponded to 467 proteins. We further filtered potentially up- and down-regulated phosphorylated sites using the Benjamini–Hochberg FDR calculation (threshold value <0.05) (14). Among these proteins, 7 (18 sites) and 20 (27 sites) proteins were upregulated and downregulated, respectively (Table I). The significant cutoff thresholds were 1.70 and −1.45 (heavy vs. light; log2 transformed ratio) for up- and downregulated phosphorylated sites, respectively.
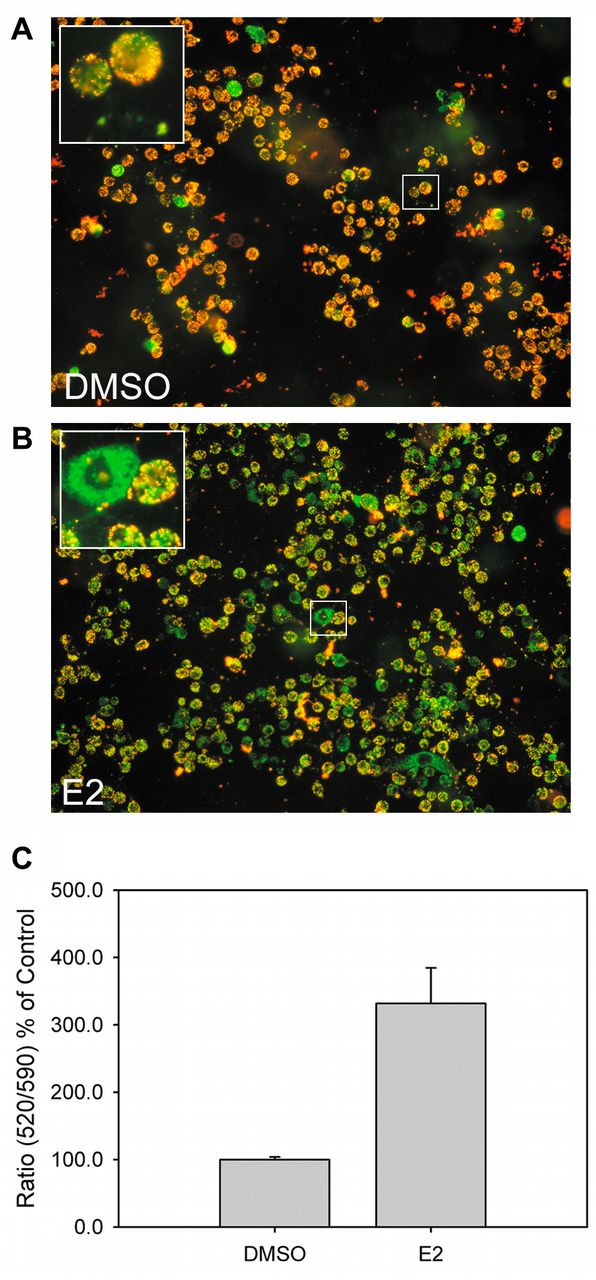
In response to E2, some proteins related to apoptosis were regulated (Table I). HSPB1, which behaves as an apoptosis blocker (21), was down-regulated. Several apoptotic inducers, such as DAB2IP (22) and PLEC (23), were up-regulated. We also checked the change of mitochondrial potential, which is a distinct feature of early apoptosis, in E2-treated ACHN cells (Figure 2). E2 induced the disruption of mitochondrial potential (Figure 2A and 2B), and induced apoptosis (~300%) compared to untreated cells (Figure 2C). In agreement with previous observations (7), our data suggested that E2 regulates RCC cell growth by inducing apoptosis.
Alternatively, several proteins that regulate cellular autophagy also changed in response to E2 treatment (Table I). For example, proteins related to autophagy activation, such as SQSTM1 (24) and ATG101 (25), were up-regulated, whereas the autophagy inhibitor MAP1B (26) was down-regulated. It has been shown that autophagy is important for RCC development and drug sensitivity (27), and SQSTM1 binds directly to Atg8/LC3 in autophagosome formation (24). Therefore, our data also suggested that E2 might regulate RCC growth through autophagy. Therefore, we further investigated the role of SQSTM1 in response to E2 in RCC cells.
E2 regulated cellular autophagy through SQSTM1. We first checked the phosphorylation and protein expression changes of SQSTM1 in response to E2. In consistent with the phosphoproteomics results (Table I), the phosphorylation of SQSTM1 at T269/S272 increased in response to E2 treatment, with maximal changes observed at 28 μM E2 (Figure 3).
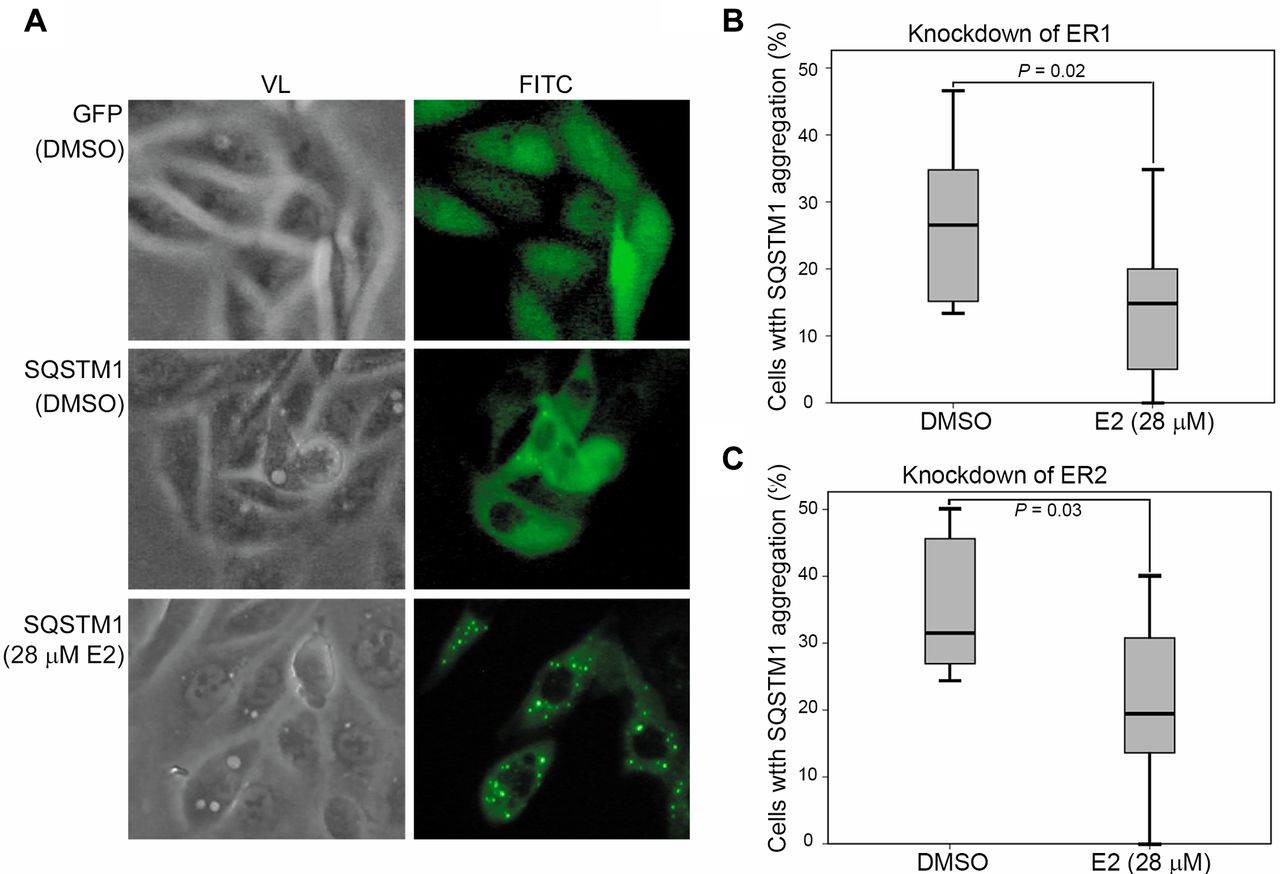
Next, we asked whether E2 treatment induced SQSTM1 aggregation, which is an indicator of autophagy. As shown in Figure 4A, SQSTM1 aggregation was observed in E2-treated ACHN cells. Knockdown of either ER1 (Figure 4B) or ER2 (Figure 4C) reduced the E2-induced SQSTM1 aggregation. Our data suggested that E2 may regulate autophagy in ACHN cells through SQSTM1 in an ER-dependent manner.
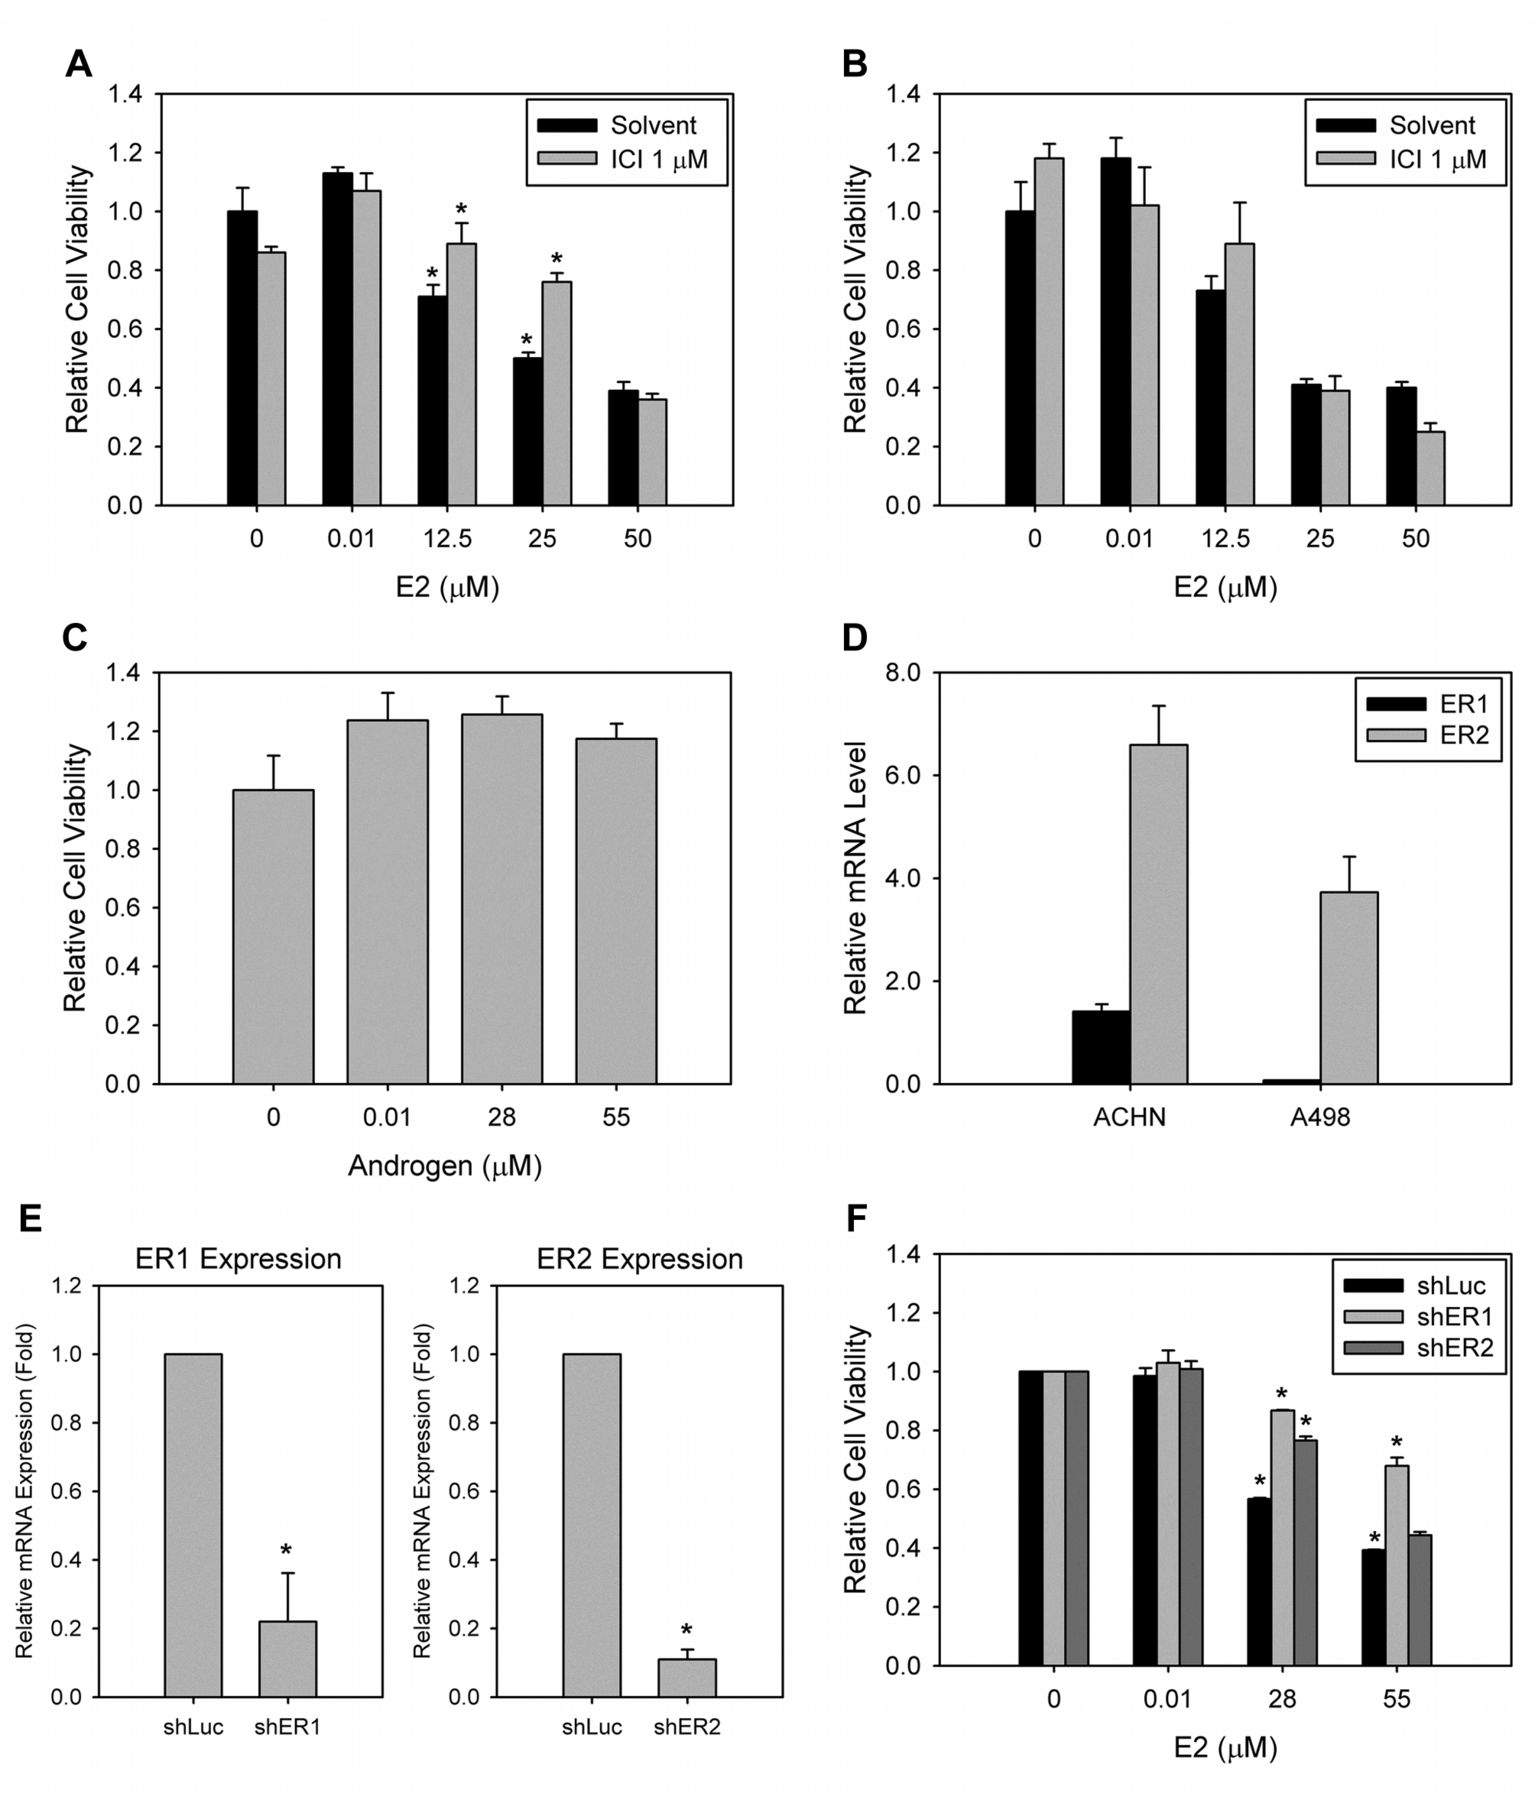
ER-dependent growth inhibition by E2 in RCC cells. (A) ACHN cells were cultured in complete media for 24 h. Prior to E2 treatment, 1 μM Fulvestrant was added to the cell culture for 15 min. Fresh media containing different E2 concentrations were then added and further cultured for 48 h. The relative cell viability was determined by CCK-8 kit. (B) A498 cells were treated with the same condition as ACHN in (A), and the relative cell viability was measured. (C) ACHN cells were treated with different androgen concentrations for 48 h. The relative cell viability was determined. (D) Total RNA were extracted from ACHN and A-498 cells. After converted to cDNA, the expression of ER1 and ER2 were detected by quantitative real-time PCR. The relative mRNA expressions were normalized with GAPDH expression. (E) The efficiency of ER1 or ER2 knockdown, that was generated by lentiviral infection, was determined by quantitative real-time PCR. The relative mRNA expressions were normalized with GAPDH expression. (F) Either ER1 or ER2 knockdown ACHN cells were treated with different E2 concentrations for 48 h, and the cell numbers were determined. *p<0.05. ICI: Fulvestrant; shER: ER knockdown by short-hairpin RNA.
The differentially regulated phosphoproteins in E2-treated ACHN cells.

Detection of cellular apoptosis in E2-treated ACHN cells. ACHN cells were treated with 28 μM E2 for 24 h and subjected to JC-10 mitochondrial membrane potential assay. Cell images were acquired and quantified. (A) Representative image for DMSO-treated ACHN cells; (B) representative image for E2-treated ACHN cells after JC-10 staining; (C) quantitation results of (A) and (B). The higher 520/590 fluorescence ratio indicated higher cellular apoptosis.
Colocalization of LC3B, but not LC3C, with SQSTM1. During cellular autophagosome formation, the aggregation of SQSTM1 can induce the conversion of the soluble LC3B-I to the lipid-bound LC3B-II. As shown in Figure 3, we found that LC3B-II conversion also increased in response to E2. In addition, LC3B also colocalized with E2-induced SQSTM1 aggregation in ACHN cells (Figure 5A). These data suggested that E2 induces the aggregation of SQSTM1 and LC3B colocalization during autophagosome formation.
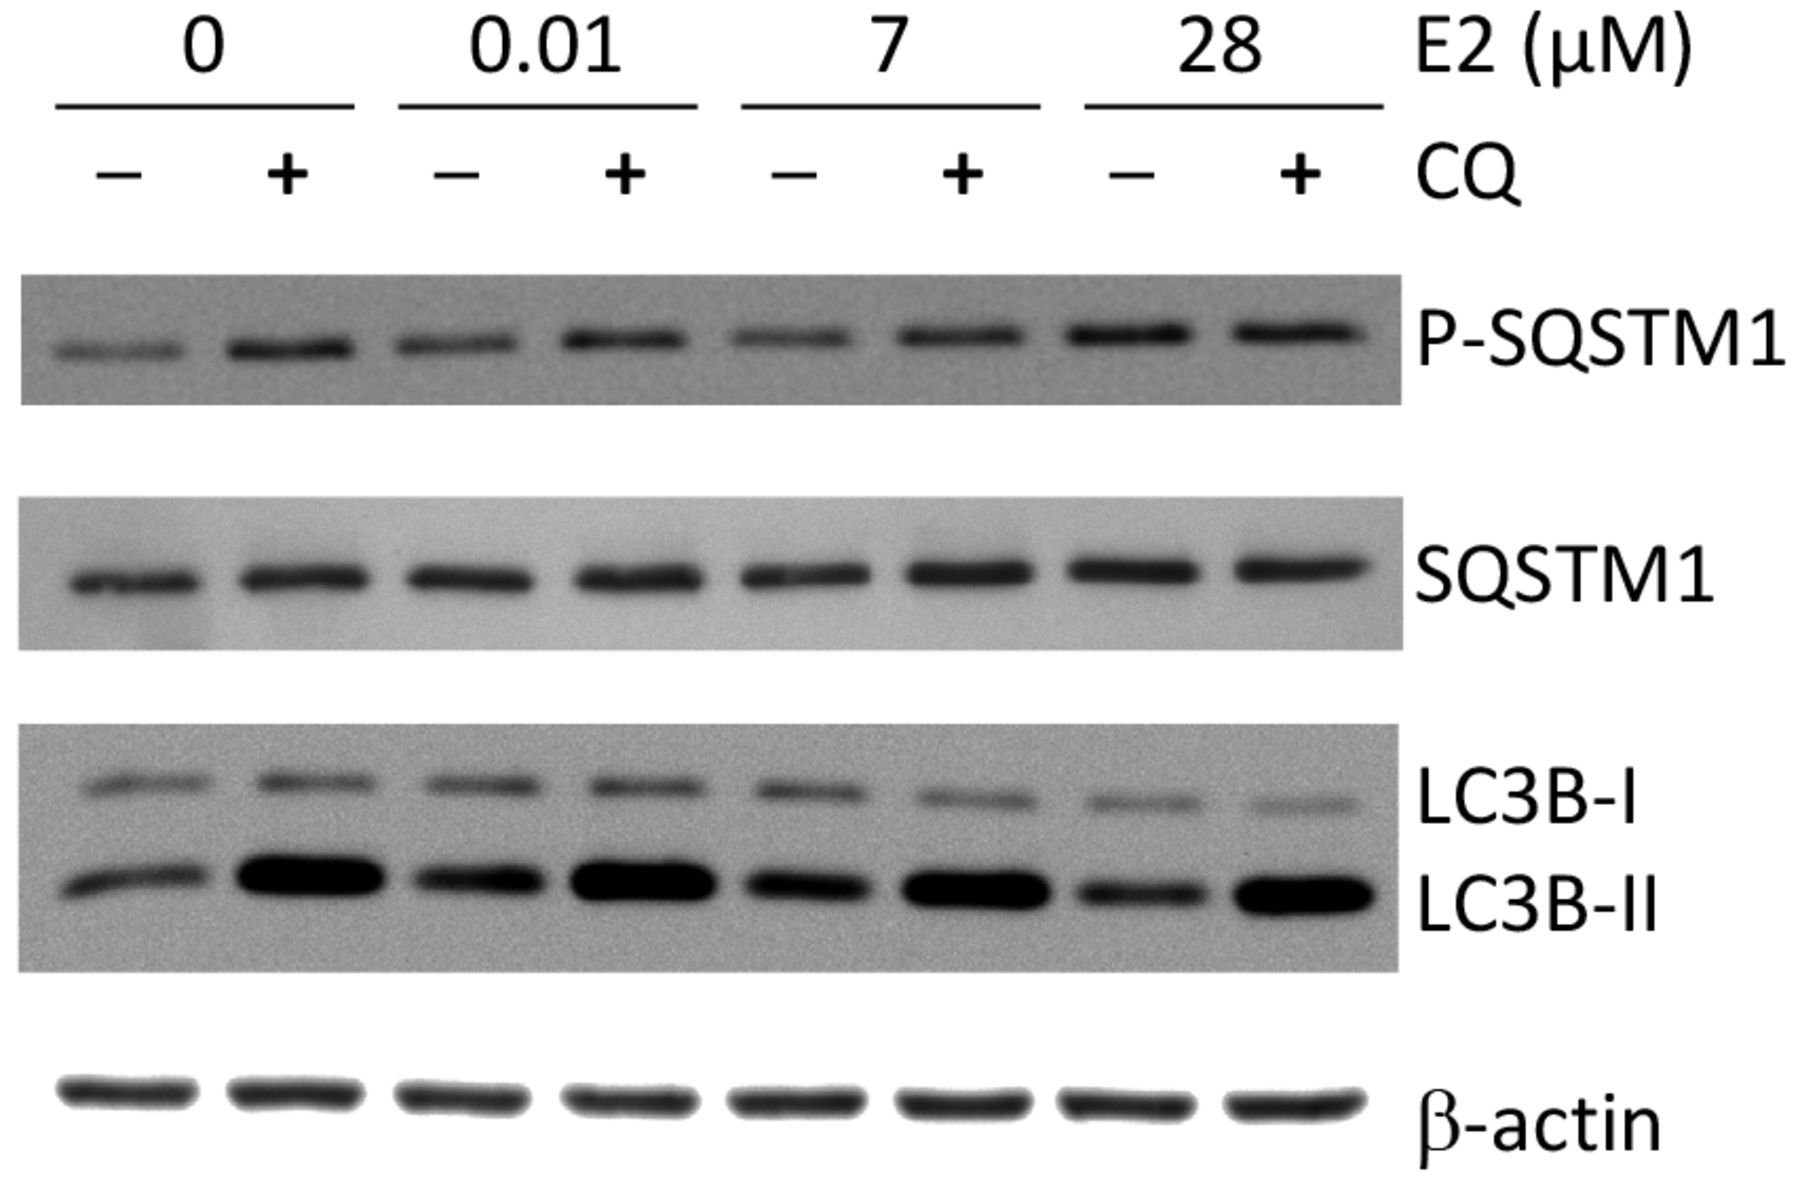
Detection of autophagy-related proteins in E2-treated ACHN cells. ACHN cells were treated with indicated E2 concentration for 48 h. For chloroquine (CQ) co-treatment, 100 μM CQ (final concentration) was added into the cell culture for 4 h prior to cell lysis. Total cell lysates were prepared and subjected to western blotting.
It has been shown that VHL induces autophagy via aggregation of LC3C, but not LC3B, to suppress tumor growth (28). To investigate the possible VHL-LC3C-dependent autophagy, we checked whether E2 induces LC3C aggregation in ACHN cells, which is VHL+/+. In contrast to LC3B-SQSTM1 colocalization (Figure 5A), no LC3C aggregation was found in E2-treated ACHN cells (Figure 5B). These data suggest that the VHL–HIF–LC3C pathway is not involved in E2-induced autophagy in ACHN cells with normal VHL expression.
Discussion
In the present study, we showed that E2 induced RCC growth inhibition, which is consistent our previous findings (29). In addition, we also showed E2-regulated growth inhibition via an ER-dependent pathway. Recently, Yu et al. showed that ER2 alone is responsible for E2-induced apoptosis in RCC cells (7). In contrast, our data demonstrated that both ERs participating in E2-induced growth inhibition. When examining the expression of both ERs, we found that the expression level of ER2 was higher than that of ER1 in ACHN cells (Figure 1D). It has been shown that the differential expression of the two ERs may contribute to variable E2 effects in different biological systems (30). Although the exact role of ER1 in RCC remains to be further addressed, we believe that ER2, together with ER1, plays a role in E2-induced growth inhibition.

ER-dependent SQSTM1 aggregation in E2-treated ACHN cells. ACHN cells were infected with lentivirus carrying GFP-only or GFP-SQSTM1 fusion protein for 24 h followed by E2 treatment for 48 h. The SQSTM1 aggregation was detected as green spots by immunofluorescence. The number of SQSTM1-GFP aggregates were counted as described in the Materials and Methods section. (A) Representative results of SQSTM1 aggregation in E2-treated ACHN cells. (B) and (C): Quantitative analyses for SQSTM1 aggregation in ER-knockdown ACHN cells. VL: Visible light; FITC: fluorescein isothiocyanate.
Among the E2-regulated protein candidates from quantitative phosphoproteomics, we demonstrated that the phosphorylation level of SQSTM1 at T269/S272 was up-regulated by E2 treatment. The two sites have been associated with non-autophagic responses, such as the nucleocytoplasmic shuttling of SQSTM1 (31) and the regulation of cellular mitosis (32). Interestingly, we did not observe any significant changes in phosphorylation levels at S403, which is highly phosphorylated during autophagy (33) (data not shown). Although we demonstrated SQSTM1 aggregation, the exact role of T269/S272 phosphorylation in SQSTM1 in response to E2 warrants further clarification.
The functional relationship between the “self-killing” apoptosis and “self-eating” autophagy is complex in different biological systems (34). In some cases, cellular apoptosis is a consequence of autophagy, whereas several evidence demonstrate that autophagy is cytoprotective against apoptosis (34). In our study, quantitative phosphoproteomics revealed that E2 both regulates apoptosis and autophagy in ACHN cells. Our observation raised an issue whether E2-induced autophagy is tumorigenic or anti-tumorigenic. It has been shown that human RCC cell lines have high basal autophagy (35), indicating that the autophagy in RCC may be tumorigenic. Interestingly, both tumorigenic and anti-tumorigenic autophagy occur in RCC cell lines, and VHL plays an important role in the switch between tumorigenic or anti-tumorigenic autophagic pathways (28). VHL suppresses the LC3B-based tumorigenic autophagy and increases LC3C-based anti-tumorigenic autophagy (28). In the present study we found that E2 triggers LC3B-based, but not LC3C-based, autophagy in VHL+/+ ACHN cells. Taken together, our data strongly suggest that E2 induces tumorigenic and “cytoprotective” autophagy to compromise the E2-induces apoptosis. This could explain why E2 represses RCC growth at IC50 of 28 μM, which is a very high concentration compared to normal physiological conditions.

Co-localization of LC-3B and SQSTM1 in autophagosome aggregation. ACHN cells were treated with either DMSO or 28 μM E2 for 48 h, and target proteins were detected by immunofluorescence using specific antibodies. Target proteins include (A) SQSTM1 as well as LC3-B, and (B) SQSTM1 as well as LC3-C. Arrows indicate the autophagosome aggregation. In both (A) and (B), the cell nuclei were stained by DAPI (4’,6-diamidino-2-phenylindole).
E2 has been considered have paradoxical effects in promoting and preventing cancer growth. To date, limited preclinical and in vitro data regarding to the inhibitory effect of E2 on RCC growth are available (7, 29), including the present study. It will be important to use in vivo animal model for studying the optimal dosage and effect of E2 through its classical receptors (ER1 and ER2) on RCC growth inhibition. On the other hand, it was recently shown that the migration of RCC can be enhanced by the activation of G protein coupled estrogen receptor (GPER) (36), which can be also activated by E2. Therefore, it will be also worthy of using specific agonist or antagonist for different ERs to study the exact ER-related effects, such as the interplay between autophagy and apoptosis in RCC growth inhibition. Based on our study, finally, a combination of E2 with other autophagy inhibitors may be useful to minimize the cytoprotective autophagy and to maximize the E2-depedent RCC inhibition.
Conclusion
In conclusion, our data demonstrated that E2 induced RCC growth inhibition via an ER-dependent pathway. Both ER1 and ER2 were required for the inhibition of cellular growth. In addition, this ER-dependent growth inhibition coincided with the activation of several autophagic effectors, such as elevated phosphorylation level of SQSTM1, and the formation of autophagosomes. We suggest that E2 affects the balance between autophagy and apoptosis to regulate RCC growth. This will facilitate the future development of E2-based or E2-adjuvant treatment strategies.
Acknowledgements
This study was supported by grants from Ministry of Science and Technology (NSC100-2314-B-281-008, NSC101-2314-B-281-002 and NSC102-2314-B-281-005) and Cathay General Hospital (CGH-MR-9908, 101-CGH-FJU-16, and 102-CGH-FJU-18), Taipei, Taiwan. The authors also thanked the Mass Spectrometry Laboratory of Tzong Jwo Jang, School of Medicine, Fu Jen Catholic University, New Taipei, Taiwan, for the assistance on MS analyses. The authors have declared no conflict of interest.
Footnotes
↵* These Authors contributed equally to this study.
- Received November 10, 2015.
- Revision received January 21, 2016.
- Accepted February 1, 2016.
- Copyright© 2016, International Institute of Anticancer Research (Dr. John G. Delinasios), All rights reserved


