


Abstract
Background/Aim: Lung adenocarcinoma (AC) and squamous cell lung carcinoma (SCC) are two main subtypes of non-small cell lung cancer. In order to understand their biological differences, we conducted an in silico comparative genomic analysis of their expression profiles. Materials and Methods: We utilized the published microarray data of 18 SCC samples and 40 AC samples to discriminate genes differentially expressed in SCC and AC. Genes were employed to construct a functional module network and build a support vector machine classifier. Another set of published non-small cell lung cancer microarray data was used to test the predictive accuracy of support vector machine classifier. Results: Our analysis showed that SCC shows an elevated expression of genes related to cell division and DNA replication while AC presents an elevated expression of the genes related to protein transport and cell junction. ROC analysis demonstrates that the support vector machine classifier has a high classification accuracy for AC and SCC. Conclusion: AC and SCC are distinctively different in certain biological network modules. This proposes different pathological mechanisms involved in these two non-small cell lung cancer subtypes.
- Lung adenocarcinoma
- squamous cell lung carcinoma
- microarray data
- functional module network analysis
- support vector machine classifier
Lung cancer is one of major contributions of cancer-related death worldwide, bringing unbearable agony to patients and a hefty burden to health system. Since 2008, it has replaced liver cancer as the most common malignant tumor in China (1). About 80% of lung cancers are non-small-cell lung cancers (NSCLC) (2), which are divided in three major subtypes: lung adenocarcinoma (AC), squamous cell lung carcinoma (SCC), and large cell lung carcinoma.
AC (nearly 40% of NSCLCs) and SCC (about 30% of NSCLCs) are more common than large cell lung carcinomas (2, 3). They compose over half of total lung cancer cases. AC is more associated to lung cancer patients without a history of smoking, although smoking is an important risk factor for lung cancer, especially in developed countries (4). SCC is more common in males than in females. It is closely associated with lung cancer patients having a smoking habit (5). These facts suggest that AC and SCC have different pathological mechanisms.
Microarray-based gene expression profiling has been used to describe the expression profiles of AC and SCC (6, 7). The genes differentially expressed between AC and SCC were identified and some of them are reported to be biomarkers for non-small cell lung cancer (8, 9). However, it remains unclear what the potential genes affecting the pathological process of AC or SCC are. So far, many studies only focused on a small portion of signature genes of AC or SCC and their possible roles in NSCLCs (10-13). Most information from AC and SCC microarray data is overlooked. The biological processes and molecular pathways hidden in these data are worth being uncovered.
The long-term survival rate of non-small cell lung cancer patients is abysmal (about 15% of 5-year overall survival and 8-10% of 10-year overall survival) (14, 15). The improvement of the patient’s long-term survival rate requires for correct diagnosis of NSCLC subtype in early stage and proper treatment plan, both of which demand the understanding of the molecular basis underlying different NSCLC subtypes. Using the published AC and SCC microarray data (16), we conducted a comparative genomic analysis of AC and SCC expression profiles. We focused on the differences between AC and SCC in their biological process, cellular component and molecular function networks. The major differences in their biological networks were identified in this study. In addition, we built a support vector machine (SVM) classifier based on genes involved in these networks. It has a possible value in AC and SCC diagnosis. We also used another set of NSCLC microarray data to test for the accuracy of our classifier (8), which proved the high predictive accuracy of our SVM classifier.

The highly interconnected modules extracted from the biological process network. The circles stand for module and the arrows stands for sub-network flow. The number beside SCC means the number of SCC up-regulated genes in the module and the number beside AC means the number of AC up-regulated genes in the module.

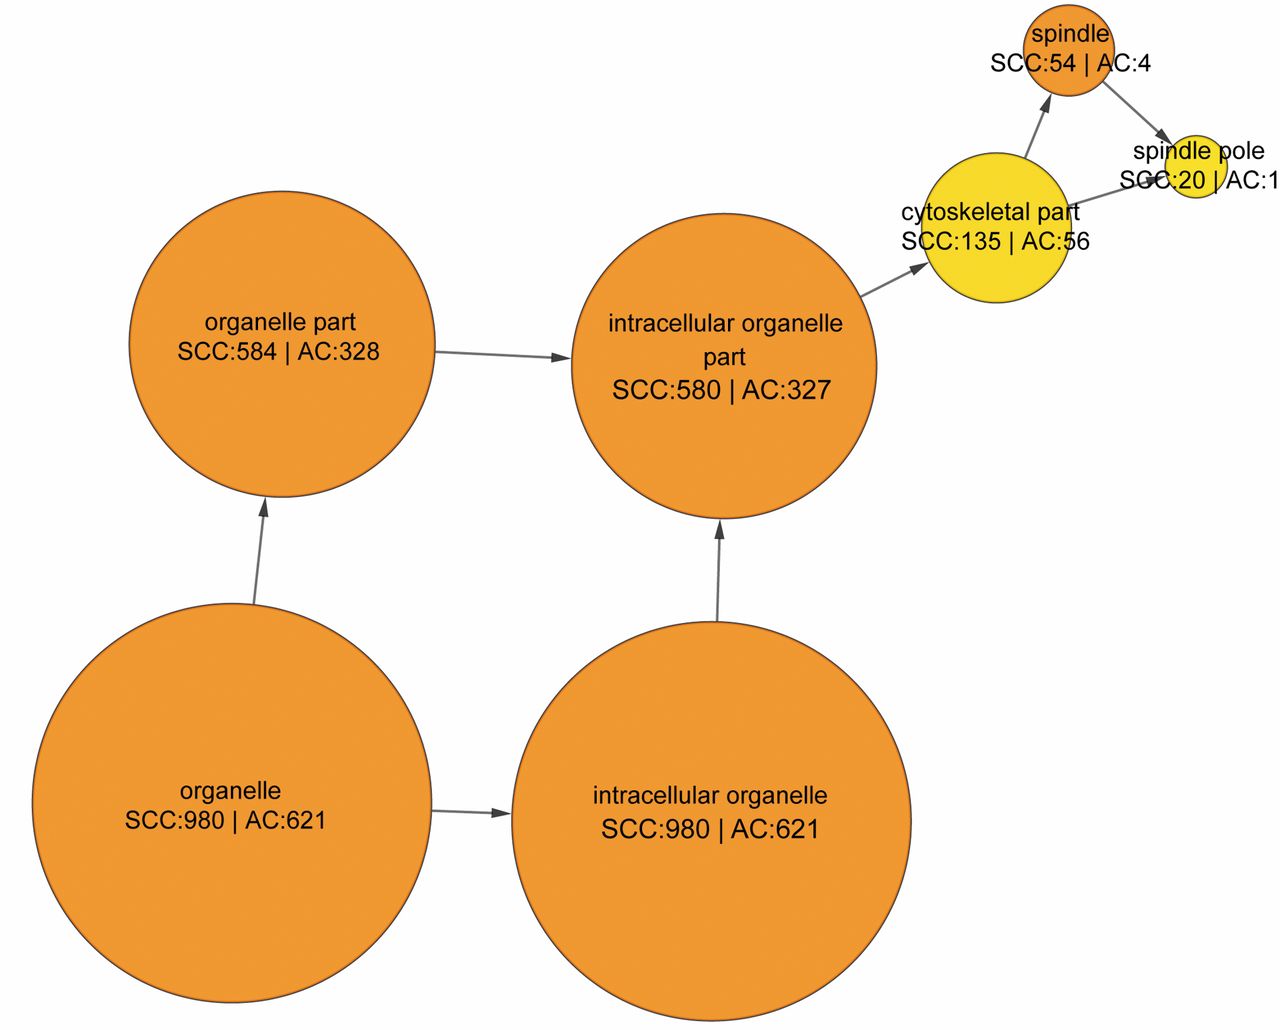
The highly interconnected modules extracted from the cellular component network. The circles stand for module and the arrows stand for sub-network flow. The number beside SCC indicates the number of SCC up-regulated genes in the module and the number beside AC means the number of AC up-regulated genes in the module.
Materials and Methods
Microarray data. Microarray data including 18 SCC samples and 40 AC samples were downloaded from the GEO database (GSE10245). This data set was used for gene expression profile analysis and building of a support vector machine classifier. The test microarray data for support vector machine classifier were also downloaded from GEO database (GSE19804). It has 60 NSCLC samples (56 adenocarcinoma samples, 3 bronchioloaveolar carcinoma samples, and 1 squamous cell carcinoma sample). Both microarray data sets are normalized counts and were collected using Affymetrix Human Genome U133 Plus 2.0 Array (GPL570) (8, 16).
Statistical methods for identifying differentially expressed genes. One-way ANOVA test was employed to compare the mean normalized counts between AC and SCC samples in the first data set. The R package was used to perform statistical analysis and a p-value smaller than 0.01 was considered statistically significant.
Functional enrichment analysis for differentially expressed genes. We used the DAVID online resource to perform the gene-GO term enrichment analysis for the differentially expressed genes between AC and SCC (17, 18). The differentially expressed genes were classified as AC up-regulated genes and SCC up-regulated genes.
Functional module network construction. The differentially expressed genes mapped by DAVID were used for building a functional module network. BiNGO was used to cluster genes into functional modules and create the biological network based on these modules (19). MCODE was used to find the highly interconnected nodes in the networks (20).
Building a support vector machine classifier. The support vector machine classifier for AC and SCC was built with LIBSVM (21). The LIBSVM parameters were optimized with grid-search and 5-fold cross-validation. Only differentially expressed genes mapped by DAVID database were used as SVM features. We selected linear kernel for our SVM classifier, because the number of samples is greatly lesser than the number of features (22). Both the training and test data sets were normalized to the range [0, 1].

The highly interconnected modules extracted from the molecular function network. The circles stand for module and the arrows stands for sub-network flow. The number beside SCC means the number of SCC up-regulated genes in the module and the number beside AC means the number of AC up-regulated genes in the module.
Results
Differentially expressed genes between AC and SCC. Using the normalized gene expression data from the first microarray data set, we identified 3,544 differentially expressed genes between AC and SCC through ANOVA comparison (p-value <0.01). According to their expression levels in AC and SCC, we classified them into two categories: AC up-regulated genes and SCC up-regulated genes. Among 3,544 differentially expressed genes, 1,485 genes are up-regulated in AC while 2,059 genes are up-regulated in SCC.
DAVID analysis of differentially expressed genes. In order to understand the possible functions of these differentially expressed genes, we performed the GO term enrichment analysis for them using DAVID functional annotation software (17, 18). 2,857 out of 3,544 differentially expressed genes can be mapped in the DAVID database. 1,216 of them are AC up-regulated genes and 1,641 of them are SCC up-regulated genes. The functional enrichment result is shown in Table I. According to the result, the possible functions of differentially expressed genes between AC and SCC are mainly involved in cell cycle, condensed chromosome, purine nucleotide binding and DNA replication.

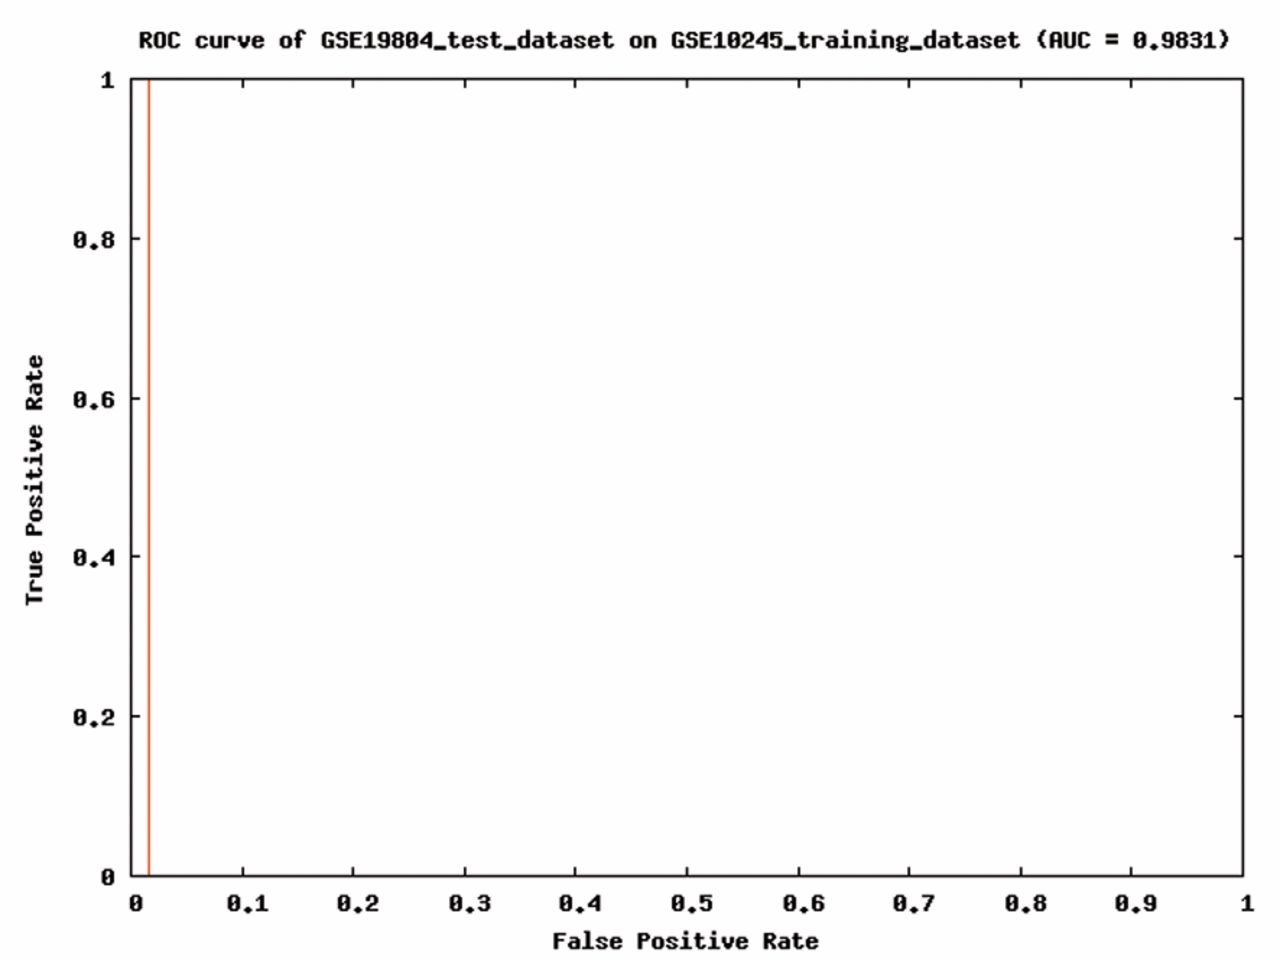
ROC analysis of the support vector machine classifier built on 2,857 mapped differentially expressed genes between AC and SCC.
Functional module network analysis of differentially expressed genes. Although the DAVID analysis of these differentially expressed genes yielded the information about their possible functions, it is still unclear how these functions contribute to the unique biological profile of AC or SCC. In order to investigate the relationship between these functions and the molecular basis of AC or SCC, we constructed biological interaction networks represented by these functions using a Cytoscape plugin, BiNGO (19). The networks of biological process, cellular component and molecular function were constructed. Nevertheless, these networks are too huge and too complex for us to analyze (data not shown). Thus, we used another Cytoscape plugin, MCODE, to refine these networks (20). The highly interconnected nodes were extracted from these networks with MCODE. These nodes are actually the important functional sub-networks in the whole network. We identified two functional sub-networks in biological process network, one sub-network in cellular component network and one sub-network in molecular function network (Figures 1, 2 and 3). The sub-networks in biological process network are responsible for DNA replication and mitosis (Figure 1A and B). They are mainly composed of SCC up-regulated genes. The highly interconnected modules in cellular component network are made of intracellular organelles which ultimately contribute to spindle apparatus, and the highly interconnected modules in molecular function network carry out the function of purine and adenyl nucleotide binding (Figure 2 and 3). About two-third of the genes involved in these modules are up-regulated in SCC. In all important sub-networks, there are more genes up-regulated in SCC than in AC. We also searched the modules with more AC up-regulated genes than SCC up-regulated ones and the result is shown in Table II. Although they are not highly interconnected with other modules, these modules show that AC is more active in expression of the genes related to protein transport, endoplasmic reticulum, Golgi apparatus, and cell junction.
DAVID functional annotation analysis of differentially expressed genes between AC and SCC.
The performance of support vector machine classifier. The functional module network analysis shows that SCC up-regulated genes play a main part in DNA replication and cell cycle while AC up-regulated genes are mainly involved in protein transport and cell junction. They are useful features for separating these two major subtypes of NSCLC. We used 2,857 DAVID-mapped genes to build the support vector machine classifier for SCC and AC. 18 SCC samples and 40 AC samples from GSE10245 were used as training data set. We selected linear kernel function for building support vector machine classifier, because the number of genes is much larger than the number samples. First, we used the training data set to test the predictive actuary of our classifier. The result of training data set showed a classification accuracy of 100%. Secondly, we used another set of microarray data to test the predictive actuary of the classifier. This microarray data set includes 56 adenocarcinoma samples, 3 bronchioloaveolar carcinoma samples, and 1 squamous cell carcinoma sample. When tested with these samples, the classifier showed an AUC score of 0.9831 in the ROC analysis (Figure 4). The classifier successfully identified AC and SCC samples, and predicted 2 bronchioloaveolar carcinoma samples as AC and 1 bronchioloaveolar carcinoma sample as SCC. Bronchioloaveolar carcinoma is usually considered as a subtype of lung adenocarcinoma (23, 24), so the predictive accuracy of this classifier on AC is 98.3% (58/59). This result proves its possible value in AC and SCC diagnosis.
Discussion
The identification of differentially expressed genes between AC and SCC could help elucidate their different oncogenic mechanisms. Our study shows that there are more SCC up-regulated genes than AC up-regulated ones in the differentially expressed genes. It suggests that the pathological process underlying SCC is more complex than that of AC. The pathogenesis of SCC might need more steps of somatic mutation which, in turn, recruited more abnormally-expressed genes. The clinical statistics show that SCC is less common than AC among NSCLCs (2, 3), which circumstantially support the statement above. The males with a history of tobacco use are more susceptible to SCC while AC is the most common type of lung cancer in non-smokers (4, 5). Carcinogens like benzopyrene in tobacco smoke could cause and facilitate the mutation of normal cells into SCC cancer cells. AC is more common among lung cancer patients without smoking habit. Although the significance of genetic factors in AC development is unknown, they definitely play a part in the carciongenesis of AC (25, 26).
The functional modules in biological networks with more AC up-regulated genes than SCC up-regulated ones.
In the present study, the majority of the identified differentially expressed genes are annotated by DAVID database. The DAVID analysis shows that their biological process, cellular component, molecular function, and KEGG pathway are mainly involved in cell cycle, condensed chromosome, purine nucleotide binding, and DNA replication, respectively. Since one major feature of cancer is uncontrolled proliferation, it is expected that their functions are somewhat related to cell division. The functional module network analysis of these genes revealed more detailed information about the difference between SCC and AC. In all highly interconnected modules in biological process, cellular component, and molecular function network, there are more SCC up-regulated genes than AC up-regulated ones. Their elevated expression in SCC indicates that SCC has a faster rate of DNA replication and cell division than AC, which is consistent with the former study (27). In cellular component sub-network, the organelle genes form a sub-network which finally contributes to spindle apparatus. As an indispensable cellular structure for cell division, the high expression level of spindle genes in SCC confirmed its hyperactivity in cell division. The modules in molecular function sub-network are responsible for nucleotide and ribonucleotide binding. The fact that SCC has more up-regulated genes in these modules suggests its fast rate of DNA synthesis. On the other hand, AC up-regulated genes are more concentrated in the modules related to protein transport, endoplasmic reticulum, Golgi apparatus, and cell junction. While these modules do not form an interconnected sub-network, they still suggest that AC might be a result of abnormal expression of cell-cell interaction genes and cell junction genes. The functional module network analysis indicates the different molecular basis for AC or SCC carcinogenesis. Although the crucial genes influencing the process of AC or SCC carcinogenesis remain unknown, our study proposes that different drugs and different treatment strategies should be considered for different NSCLC subtypes in lung cancer therapy.
The SVM classifier built on the DAVID-mapped genes shows a high accuracy for identifying AC samples. Due to the limited number of SCC samples in test data set, its predictive accuracy for SCC still needs to be evaluated. We have confidence in the predictive power of our classifier. At least, when tested with the training data set, its predictive accuracy for both AC and SCC is 100%. Its performance on bronchioloaveolar carcinoma is intriguing. It classified 2 bronchioloaveolar carcinoma samples as AC and 1 bronchioloaveolar carcinoma sample as SCC. Bronchioloaveolar carcinoma is commonly regarded as a subtype of AC (23, 24). However, our result suggests that it might be not the case. If our result were correct, bronchioloaveolar carcinoma should be viewed as a mix of several lung cancer variants rather than a single variant of lung cancer. Further studies are required to elucidate the pathological classification of this less common type of lung cancer.
In conclusion, our analysis showed that 3,544 genes are differentially expressed between AC and SCC. SCC has greater number of up-regulated, differentially expressed, genes than AC. The functional enrichment analysis shows that these genes are mainly involved in cell cycle and DNA replication, and the functional module network analysis indicates that SCC and AC have different molecular bases and biological profiles. SCC has an elevated expression of the genes related to cell division and DNA replication while AC has an elevated expression of the genes related to protein transport and cell junction. These results indicate the different pathological mechanisms of SCC and AC. Further investigations are required to identify the genes and the molecular pathways controlling these mechanisms, if we want to exploit them as bases for NSCLC treatment. We also used the differentially expressed genes to build a support vector machine classifier for SCC and AC. It demonstrates the high predictive accuracy for AC and has a potential value in NSCLC diagnosis.
- Received August 15, 2014.
- Revision received September 29, 2014.
- Accepted October 1, 2014.
- Copyright© 2014, International Institute of Anticancer Research (Dr. John G. Delinasios), All rights reserved


