


Abstract
By routinely and systematically being able to perform quantitative stem-loop reverse transcriptase followed by TaqMan® PCR expression analysis on stool and tissue samples using fifteen human (Homo sapiens, hsa) micro(mi)RNA genes selected by careful analysis of the peer-reviewed literature, we were able to monitor changes at various stages of CRC, allowing for reliable diagnostic screening of colon cancer particularly at the early, pre-malignant stages, and for difficult-to-treat active ulcerative colitis (UC). Although the expression of some of the miRNA genes tested in tissue showed less variability in CRC or UC patients than in stool, the stool by itself appears well-suited to screening. A miRNA approach using stool samples promises to offer more sensitivity and specificity than currently used screening genomic, methylomic or proteomic methods for colon cancer. Larger prospective clinical studies utilizing stool derived from many control, colon cancer or UC patients, to allow for a statistically valid analysis, are now urgently required to standardize test performance and determine the true sensitivity and specificity of the miRNA screening approach, and to provide a numerical underpinning for these diseases as a function of total RNA. Moreover, when a miRNA screening test is combined with analysis of a messenger(m)RNA expression test, which has also been considered in earlier studies to be a highly sensitive and a very specific and reliable transcriptomic approach, as outlined in this article, bioinformatics can be used to correlate microRNA seed data with mRNA target data in order to gain a mechanistic understanding of how miRNAs regulate gene expression, enabling understanding of why these miRNA genes should be informative in a screening test.
cDNA, Copy deoxyribonucleic acid; CD, Crohn's disease; CP, comparative cross point; CRC, colorectal cancer; E-method, also referred to as second derivative maximum or CP method; FOBT, fecal occult blood test; GI, gastrointestinal; IBD, inflammatory bowel disease; LCM, laser capture microdissection; MGB, minor groove binding; mRNA, messenger ribonucleic acid; QC, quality control; RT-qPCR, reverse transcriptase-quantitative polymerase chain reaction; rRNA, ribosomal ribonucleic acid; UC, ulcerative colitis; 3'UTR, untranslated 3' region of target mRNA.
Colorectal cancer (CRC) is the second and third most common malignancy in men and women, respectively, in developed and developing countries, including the United States of America (USA) and Europe (1-3). CRCs represent 10% of incident cancers and cancer deaths in the USA. About 6% of the population will develop CRC in their lifetime. In 2007, 153,760 new cases and 52,180 deaths were estimated (3). Globally, there are about 1 million new cases and about 500,000 deaths per year (4), and these numbers are destined to increase because of the worldwide adoption of a Western-type diet (5). CRC is the third leading cause of cancer death among white, African-American, Asian/Pacific Islander and Indian/Alaska Native men, but second among Hispanic men in the USA (6). CRC incidence has declined from about 60 per 100,000 in 1975 to ∼50 per 100,000 in 2004, and the decrease in USA mortality has recently accelerated (i.e. the rate decreased from about 29 per 100,000 population in 1970 to about 18 per 100,000 in 2004, with similar decline for white men and women, although the decline for men began several years after women), but it has changed little for African-American men and women. Since 1990, the mortality in African-Americans has decreased from about 30 to 25 per 100,000 population, with higher mortality in men than women, and since about 1980 the mortality has been higher in African-Americans than whites. Five-year survival rates are strikingly different by stage, ranging from 90% for localized disease to 10% for distant disease, clearly arguing for early detection (7).
The guaiac-based fecal occult blood test Hemocult is the only screening test proved to be effective by randomized clinical trials (RCTs) (8, 9). Other tests such as immunochemical (IMC)-based fecal blood test, although never tested in an RCT, have been evaluated against guaiac-based tests and have performed at least as well with higher compliance rates (10-12). Increasing incidence of right-sided CRC lesions has been reported with increasing age (13, 14). CRC is the only cancer for which the diagnostic test colonoscopy is recommended as a screening test (15, 16). The Multisociety Task Force on CRC recommends annual screening using a guaiac test with dietary restrictions or an IMC test without dietary restriction (17). The American Cancer Society (ACS) has a similar recommendation, but advises that IMC tests are more acceptable to patients and are likely to perform as well or better than guaiac tests (18), although they cost more. There are several methods available for colon cancer screening e.g. flexible sigmoidoscopy (19), CT colonography (virtual colonoscopy) (20), capsule endoscopy (21), double contrast barium enema (22), molecular DNA tests in stool and blood (33-39); however, none is optimal. Colonoscopy screening for the 70 million people older than 50 years of age in the USA, considered to be the gold standard for CRC screening, could cost $10 billion per year and exceed the physician capacity to perform this procedure (30, 31). Clearly, a simple, inexpensive, noninvasive, sensitive and specific diagnostic screening test is needed to identify people at risk for developing advanced adenomas or carcinoma, and who would benefit from subsequent invasive, but necessary colonoscopy (15) to screen for this preventable cancer.
The traditional understanding of the evolution of CRC was based on progression of adenoma to carcinoma through genetic alterations involving tumor suppressor genes (32). An alternative CRC pathway is the serrated one involving hyperplastic polyps or related lesions, although our understanding of these mechanisms is incomplete (33).
Inflammatory bowel diseases (IBD) comprises ulcerative colitis (UC) and Crohn's disease (CD), with an estimated prevalence of 700,000 people for each disease (34). Inflammation and ulceration of the colon occurs in the entire rectum and extends up the colon in a continuous manner, and colon cancer is a serious side-effect of long-term UC or CD involving the whole colon, even in patients who are in remission (35).
Proteomics combined with bioinformatics has been indicated as having a potential diagnostic potential for serving as biomarkers for CRC in tissue or blood (36-40), although a recent preliminary serum proteomic study carried out in a nonbiased fashion failed to differentiate between individuals with large adenoma (⩾1 cm) and normal individuals (41).
Genome-wide approaches have been prominent in cancer research, and have been driven by the view that alteration in protein-coding oncogenes and tumor suppressor genes underlie tumorigenesis (1, 8). Meta-analysis of multi-study data has allowed the identification of overlapping sets of differentially expressed genes that may have biomarker potential (42). A transcriptomic mRNA approach has shown promise to detect adenomas and colon carcinomas at > 90% sensitivity and specificity in preliminary studies (43-45); however, a large randomized, standardized, blinded prospective clinical study has not yet been carried out in order to validate the superiority of that approach (46).
MiRNAs are small, noncoding sequences of 17-27 nucleotides long that regulate cell processes in ∼30% of mammalian genes by imperfectly binding to the 3' untranslated region (UTR) of target mRNAs resulting in prevention of protein accumulation by either transcription repression, or by inducing mRNA degradation (47). Many miRNAs are thought to target hundreds of conserved mRNAs and several hundreds of nonconserved targets. Thus, miRNAs operate in a complex regulatory network, and it is predicted that together they regulate thousands of human genes (48). MiRNAs are transcribed as long primary precursor molecules (pri-miRNA) that are subsequently processed by the nuclear enzyme Drosha and other agents to the precursor intermediate miRNA (pre-miRNA), which in turn is processed in the cytoplasm by the protein Dicer to generate the mature single-stranded (ss) miRNA (49). MiRNA functions have been shown to include development and apoptosis, cell cycle progression, and so specific miRNAs are thought to be critical in oncogenesis, effective in classifying both solid (50, 51) and liquid human tumors (52, 53). They play a role in cancer initiation and metastasis (54, 55), and can function as either an oncogene or a tumor suppressor gene (56). MiRNA genes are frequently located at fragile sites as well as minimal regions of loss of heterozygosity, minimal regions of amplification or common breakpoint regions, suggesting that miRNAs might be a new class of genes involved in human carcinogenesis (57), can correctly classify human cancers of unknown primary origin, as well as poorly differentiated tumors (58), and promise to serve as biomarkers for cancer diagnosis, prognosis and response to therapy (47).
According to the miRBase Sequence Database Release 13.0 in September (http://mirbase.org), 721 miRNAs have been identified in humans and 579 in mice (59). Several human miRNAs were shown by microarrays and RT-qPCR in CRC tissue, cell culture lines and blood to be related to colon cancer tumorigenesis (60-75) and UC (76). Rosetta Genomics reported initial efficacy data for a test dubbed “miRscreen Colon”, which showed that lower expression of hsa-miR-16 and hsa-miR-126b can be used to identify the presence of CRC in blood with 91% sensitivity, but only 72% specificity (75). A study employing microarrays and RT-qPCR, in addition to in situ hybridization to assess differential expression in IBD, showed 11 miRNA to be aberrantly expressed in inflamed tissue and HT-29 colon adenocarcinoma cells (3 showing significant decrease and 8 significant increase) (76). A recent study indicated that the combination of transcriptomic mRNA and miRNA expression signatures represent a better approach for improving biomolecular classification of CRC (77). However, comparison across studies is limited by differences in profiling platforms, quantity of obtainable miRNAs, methodology used, contamination of tumor tissue with surrounding residual normal tissue when no laser capture microdissection (LCM) is employed, and in some cases inadequate sample number and paucity of clinopathological data. Consequently, translation of miRNA results into clinically useful and widely applicable biomarkers is often hampered.
It has been estimated that approximately 1010 normal adult colonic epithelial cells, each having a lifespan of 3-4 days, are shed daily from the lower two thirds of colon crypts (80), which makes colonocyte use to develop a CRC screening test an attainable goal (23-29, 43-46). As CRC- and UC-specific miRNAs are identified in stool colonocytes by an approach as presented herein, the validation of novel miRNA/mRNA target pairs within the pathways of interest could lead to discovery of cellular functions collectively targeted by differentially expressed miRNAs (78). For example, comparison of the top 12 pathways affected by colon cancer and globally targeted by miRNAs overexpressed in CRC shows that coexpressed miRNAs collectively provide systemic compensatory response to the abnormal phenotypic changes in cancer cells by targeting a broad range of signaling pathways affected in that cancer (79).
Materials and Methods
Acquisition of clinical specimens. Stool and tissue samples were obtained from five controls and fifteen patients with various stages of colon adenocarcinoma (Dukes' stages 0 to 3), five patients with UC and five patients with CD, according to an approved Institutional Review Board (IRB) protocol. All Laboratory work was carried out and standardized under blind conditions and followed ECU's guidelines for handling biohazardous material established by its Biological Safety & Hazardous Substance Committee.
Control stool and tissue samples.
-
(i) Fecal specimens. Control stool samples (20 g) were collected from consenting individuals visiting our participating GI-Surgery Clinic/ECU Endoscopy Lab who did not show any polyps or IBD, such as colitis or diverticulitis. Stool samples were stored overnight at room temperature in the preservative RNALater® (Ambion, Austin, TX, USA), which was added at 2.5 ml per 1 g of stool, and samples transferred to the laboratory next day for extraction of total RNA and further processing.
-
(ii) Tissue specimens. Normal tissues were either obtained from a small piece of colon tissue (about 0.5 cm3) removed >10 cm away from diseased patient tissue at surgery (80), or from biopsies taken during colonscopy from non-diseased areas of consenting individuals. For UC or CD patients, a small piece of tissue taken further away from the inflamed or diseased tissue was considered normal. Tissues were flash frozen in liquid nitrogen and stored at –70°C for subsequent LCM work. Longitudinal sectioning of the tissue before LCM use was employed to pick up epithelial cells that would eventually be shed as colonocytes into the lamina propria from the bottom epithelial cells among the proliferative enterocyte crypt lineage (45).
Experimental stool and tissue samples from cancerous or inflamed patients.
-
(i) A 20 g sample of feces (bowel movement) was collected the night before surgery or earlier, before administering any laxative, in a plastic container. Stool processing was standardized for all samples immediately after collection by using a solid brush to scrapping collect samples from a mucinous layer, which is rich in colonocytes (81), and non-mucinous parts of stool in order to have a representation of the entire colon (both right and left side colon) (13, 14), and then RNALater® added at 2.5 ml per 1 g of stool in a smaller size container, and sample stored at room temperature and processed for RNA extraction, followed by storage at –70°C until RT-qPCR quantification was carried out randomly and blindly on all stored samples in a short time period in order to prevent analytical bias (82).
-
(ii) Tissue specimens. A small piece of tissue sample (about 0.5 cm3) was obtained after colonoscopy for adenoma, or at surgery for carcinoma. Samples were processed after flash freezing in liquid nitrogen and storage at –70°C for subsequent microdissection. Longitudinal LCM sectioning was performed (Figure 1). The areas of the crypt marked by the pathologist that indicated where the transformed cells (i.e. adenoma, carcinoma) were to be captured by LCM [see Figure 2 showing dysplatic tissue before being pulsed by the laser (panel A), after dysplastic cells removed (panel B), and dysplastic regions on a plastic cap (panel C)] for subsequent RNA extraction (45).
For the current study, stool and tissue samples were obtained from 5 non-cancerous non IBD control individuals, 5 patients having adenomatous polyps ⩾1 cm with high-grade dysplasia (stage 0-1), 5 patients with stage 2 carcinoma, 5 patients with stage 3 carcinoma, 5 non-cancerous patients with severe UC, and five non-cancerous patients with severe CD. Each patient provided a stool sample, thus totaling 30 stool and 30 tissue samples.
Manual extraction of total RNA from LCM cells and stool, and ss-cDNA preparation. This procedure was used for extracting RNA from a small number of LCM captured cells or from about 0.25 g of stool, and was carried out according to manufacturer's specifications using the RNeasy isolation Kit® from Qiagen, Valencia, CA, USA, as previously described (43, 44). Purity of total RNA was measured spectrophotometrically at λ260 nm and 280 nm. The intensity of RNA was determined on an Agilent 2100 Bioanalyzer (Agilent Technologies, Inc, Palo Alto, CA, USA) utilizing the RNA 6000 Nano LabChip®. Extracted total RNA was reverse transcribed using TaqMan MicroRNA Reverse Transcriptase Kit (Applied Biosystems, Foster City, CA, USA). The RT reactions contained 50 nM stem-loop RT primers, 1xRT buffer, 0.25 mM of dNTPs and 3.33 U/μl MultiScribe transcriptase, which resulted in generation of ssDNA. A total of 100,000 captured cells on 5 plastic LCM caps (each accommodating 20,000 cells) was enough to test all the 15 miRNA genes of interest, considering that each cell contains ∼20 pg total RNA or 0.4 pg mRNA (equivalent to 0.36 pg ss-cDNA), as only a few picograms of cDNA are needed per PCR reaction (84).
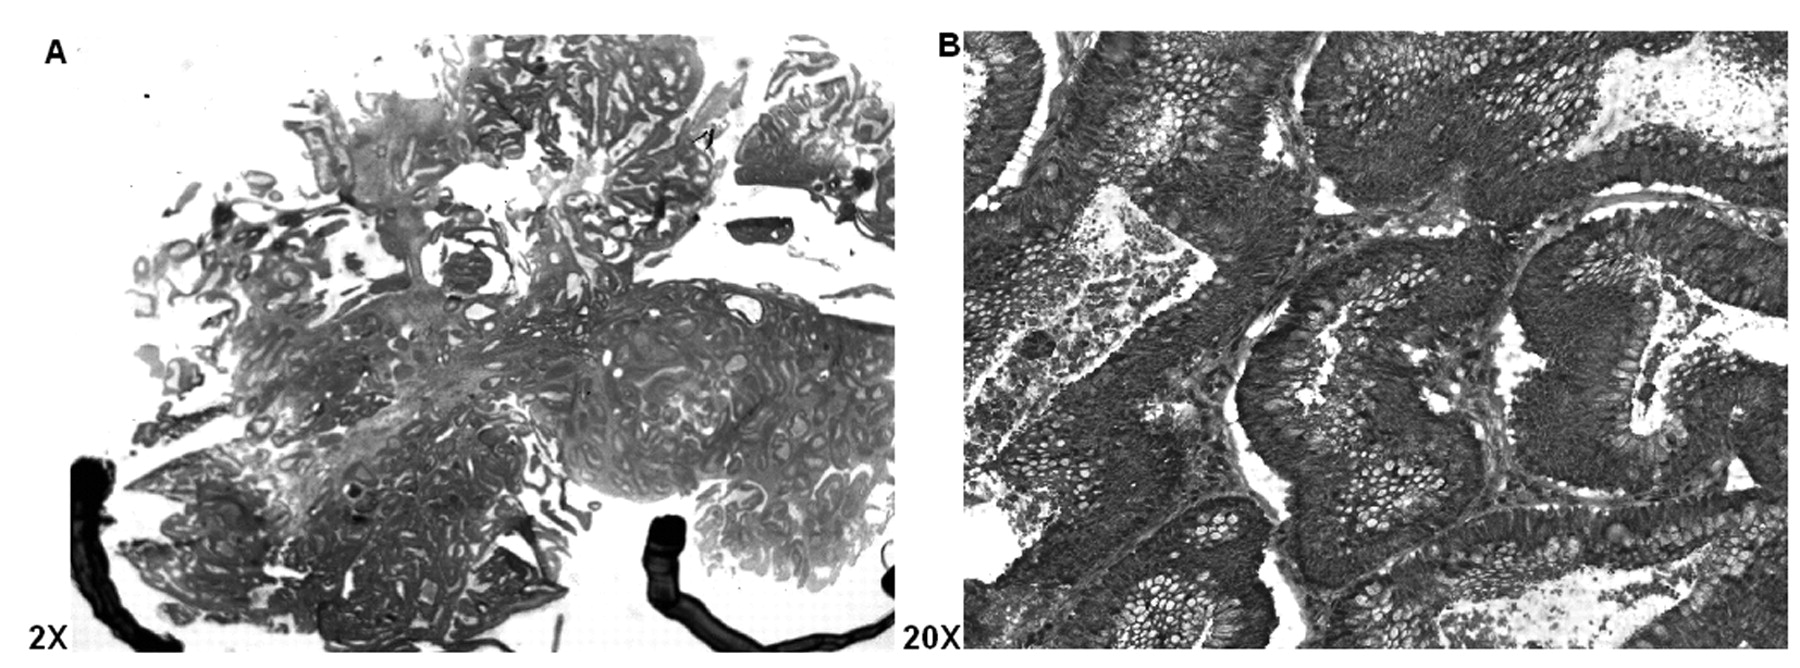
Longitudinal H&E cryostat section of colon adenoma exhibiting high grade dysplasia (i.e., carcinoma in situ, stage 0), with the areas to be focused for LCM selection marked, ×2 (A), and ×20 (B).
Real-time quantification of mature miRNAs using TaqMan® minor groove binding probes. This assay is specific for mature miRNAs and discriminates among related miRNAs that differ by as little as one nucleotide, and is not affected by genomic DNA contamination (85). MiRNA stem-loop RT primers for specific miRNA species to be tested, together with probes having a minor groove binder (MGB) with non-fluorescence quencher at the 3' end and the fluorescence dye FAM at the 5' end, were obtained from Applied Biosystems (Foster City, CA, USA) for the following 16 miRNAs: 18S rRNA, miR-16, miR-20a, miR-21, miR-92, miR-96, miR-106a, miR-125b, miR-126, miR-143, miR-145, miR-192, miR-203, miR-320, miR-326 and miR-485-5p. The 10 μl PCR reaction included 0.67 μl RT product (representing ∼1 nm total RNA), 1x TaqMan® probe, 1 μM of forward and 0.7 μm of reverse stem-loop RT primers (∼ 50 nM each), and deionized, DNase-free distilled water was added to make the 10 μl volume. Reaction run conditions were as follows: 95°C for 10 min, followed by 30 cycles of 95°C for 15s and 60°C for 1 min. All reactions were run in triplicate. Components for the assay were found in the TaqManTM MicroRNA Reverse Transcription Kit, Universal Master Mix without UNG and TaqMan™ Assay, all obtained from Applied Biosystems.
Our study emphasized a commonly accepted dogma of real-time PCR analysis in which optimal data are achieved when each RT reaction is normalized to contain an equal amount of a starting total RNA (86). Normalization was carried out against an endogenous housekeeping internal standard 18S rRNA, as this standard seems to give consistent and reliable results for normalizing PCR expression of miRNAs (77). The CP method was also used to calculate CPs for mature miRNAs. In all PCR reactions, strict attention to quality control (QC) procedures was adhered to in order to ensure the uniformity, reproducibility and reliability of the PCR reaction (87). The level of gene expression was displayed using parallel coordinate plots (88) produced by the lattice package in R (version 2.4.0, http://cran.r-project.org).
Semi-quantitative real-time PCR. The comparative cross point (CP) method, also called the E-method (89), for semi-quantitative PCR analysis was carried out using a Roche LightCycler (LC™), model 2.0 PCR instrument, utilizing LC Relative Quantification Software™ (90). The method uses standard curves in which the relative target concentration is a function of the difference between crossing points (or cycle numbers) as calculated by the second derivative maximum, in which the Cycler's software algorithm (v4.0 software for the LC™ model 2.0) identifies the first turning point of the fluorescent curve in the graph showing fluorescence versus cycle number (90), which corresponds to the second derivative curve (91). The CP method was selected because it produces more accurate results than the 2–ΔΔCt method (92), as it compensates for differences in target and reference gene amplification efficiency [E=10–1/slope] (93) either within an experiment, or between experiments (94). Normalization against a housekeeping internal standard or in some cases against several standards is customarily employed in this method (77).
Computer-based approaches correlating mRNA with microRNA data. We have attempted to relate 2-7 or 2-8 complement nucleotide (nt) bases in the mature miRNAs with the 3' UTR of a message using Broad's Institute's TargetScan algorithm (95) http://www.targetscan.org/archives.html, which provides a precompiled list for their prediction (47). Advantages and disadvantage of this basic approach are discussed below.
Results
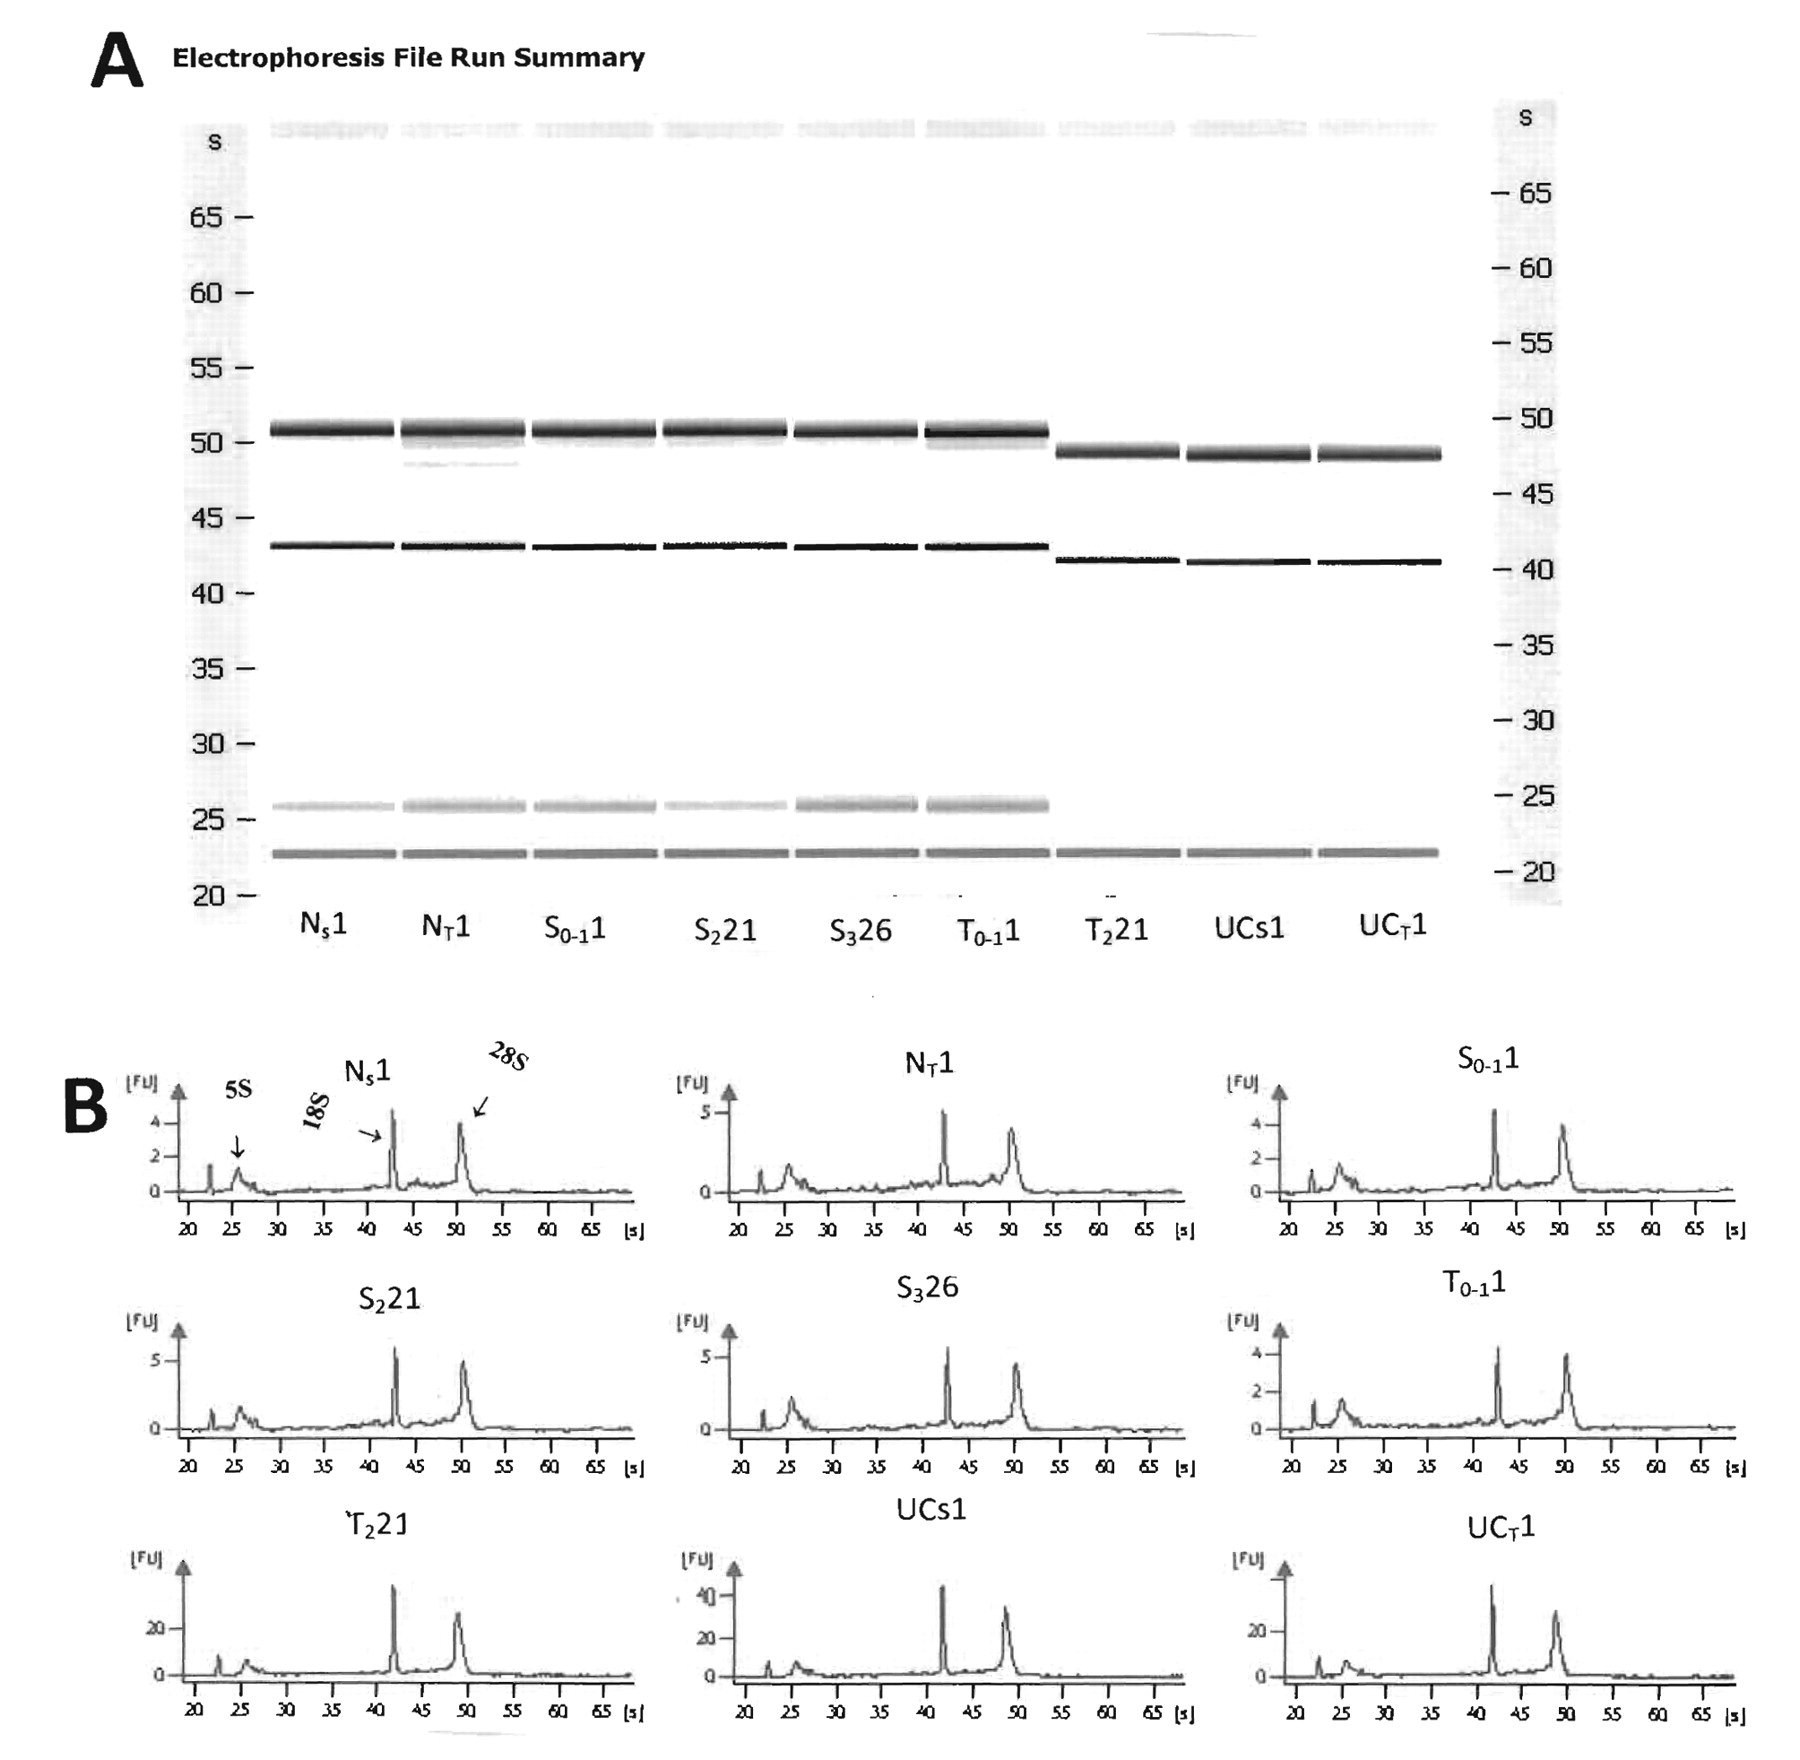
Purity of total RNA measured spectrophotometrically on Nanodrop-1000 (Thermo Fisher Scientific, Inc, Waltham, MA, USA) showed the OD 260 nm/280 nm ratio was from 1.9 to 2.0, indicating that it was reasonably pure. Electrophoretic runs carried out on the Agilent Bioanalyzer (46) showed that all total RNA extracted from either LCM or stool samples of normal or of various stages of colon cancer, or from patients with UC using both gels and electrophoretograms was intact and of human origin, making it suitable for high quality miRNA determinations. Although there may be daily variations between runs as shown by comparing the first 6 gels that were processed on one day with the other 3 gels that were processed in the next day (Figure 3 A and B), the overall electrophoretogram patterns show that the 18S and 28S bands migrate to the same extent in all nine total RNA samples taken from stool or tissue. Moreover, the RNA integrity assessed on the Agilent 2100 BioAnalyzer showed an RNA integrity number (RIN)>7.0, indicating a high quality total RNA.

LCM displaying cells from Figure 1B before being pulsed by an IR laser (upper panel A); the middle panel B shows same area with dysplastic cells removed; and the lower panel C shows removed dysplastic regions on a film cap.
We estimate that using the method outlined herein, we are able to retrieve between 75-250 μg of human total RNA per gram of stool from a cancer patient, depending on stage (the higher the stage, the higher the amount of RNA extracted), and ∼25 μg human RNA per gram of stool from control individuals. Although in our case and others (96) about 10% of total RNA is of human origin, the presence of intestinal bacterial (e.g., Escherichia coli) RNA does not interfere with the PCR reaction because of the high sensitivity and specificity of employed RT primers and MGB probes for TaqMan PCR.
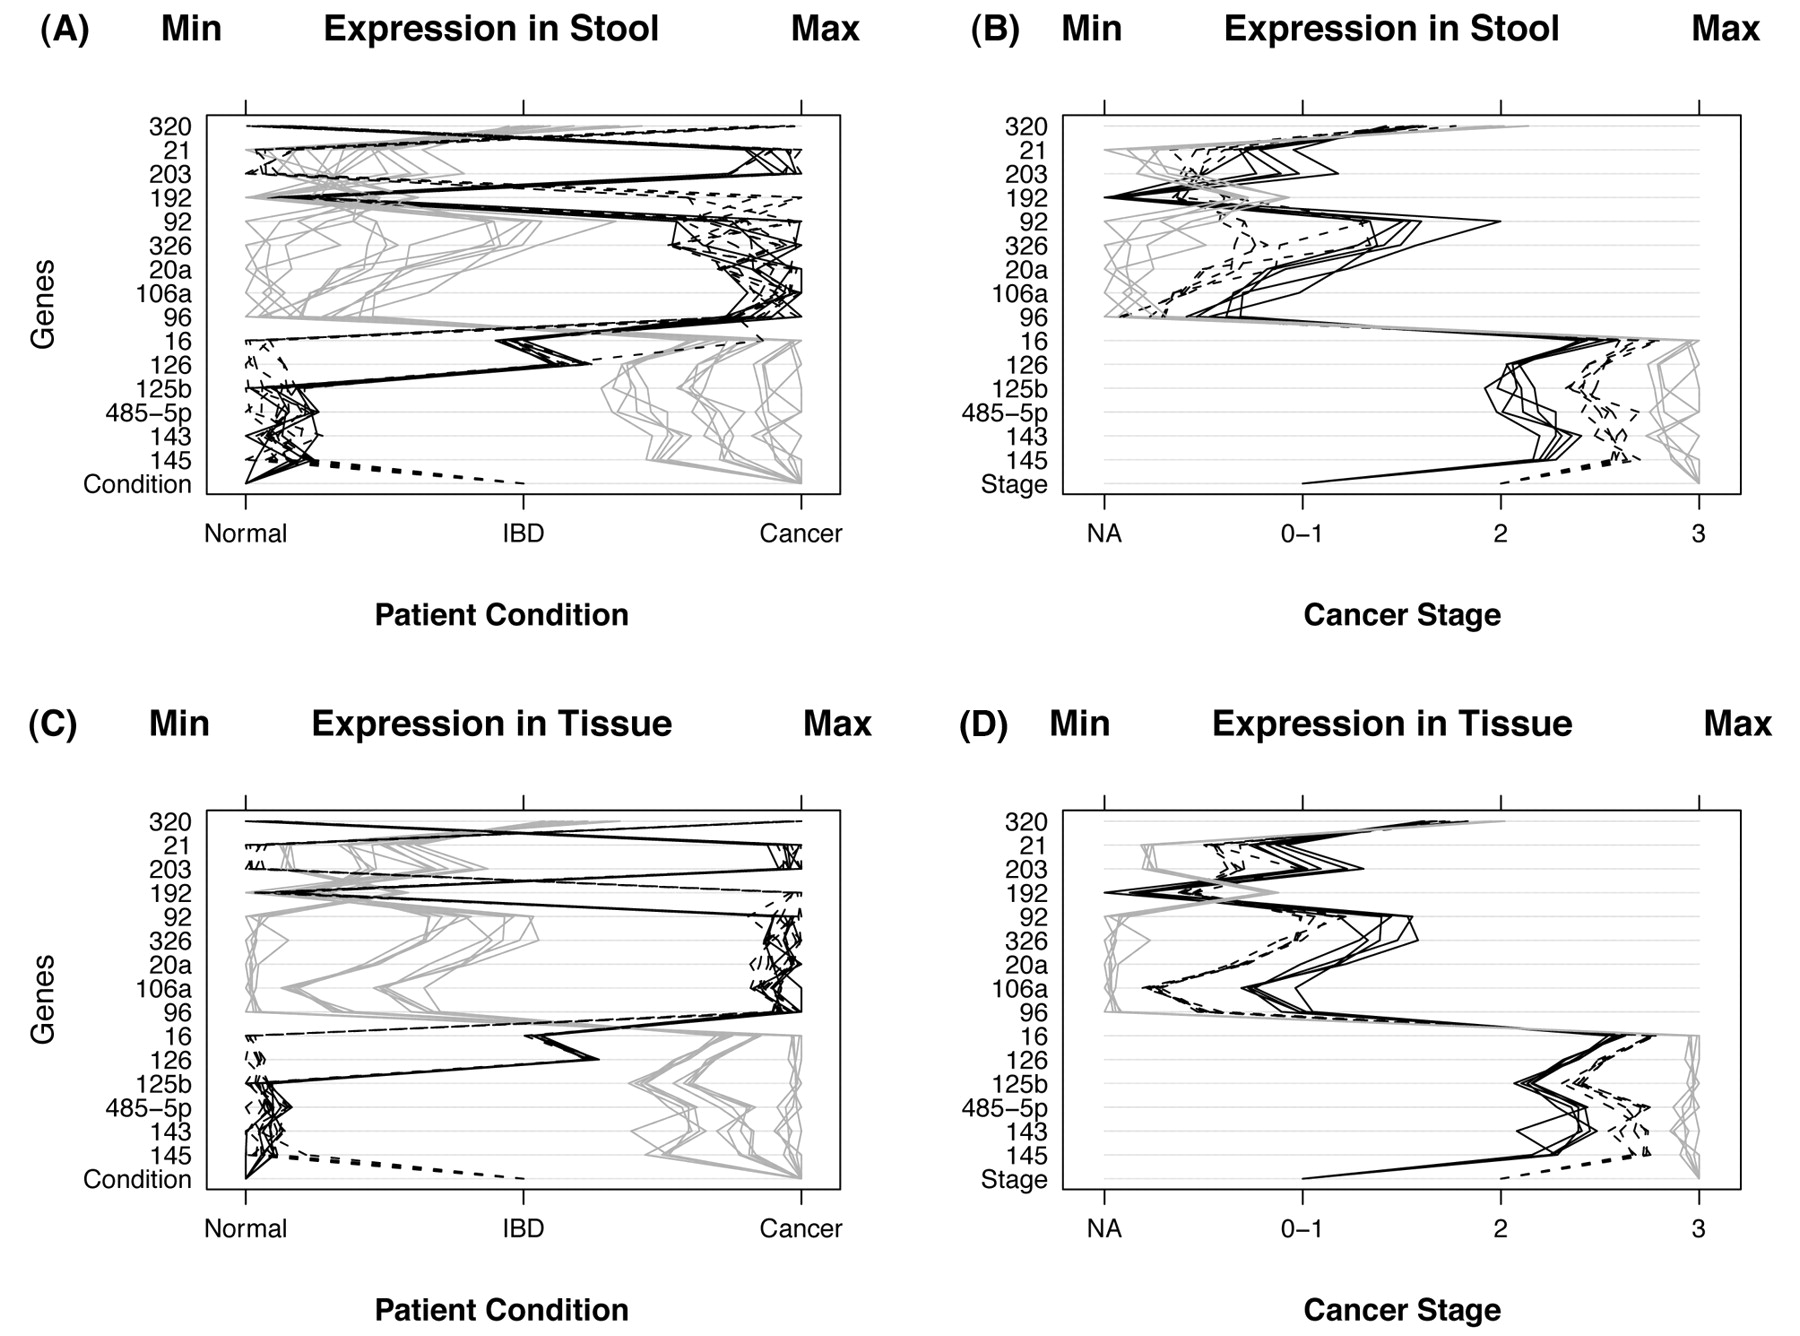
After inspection of generated qPCR data (Table I, and Figure 4), several miRNA genes by themselves appear to offer distinct and clear separation between control, colon and cancer and UC cases in both stool and tissue samples. Figure 4, panel A displays miRNA expression for stool samples taken from 30 control, colon cancer and UC patients. Condition of the patient appears at the bottom of the panel and is indicated by the type of line: 5 normal patients (black lines), 10 with IBD (dashed lines), and 15 with cancer (gray lines). Instances of high expression appear on the right and those with low expression on the left. Expression was measured by CP and scales were chosen so that minimum values line up on the “Min” mark labeled at the top of the panel. The same is true for the maximum values which line up under the mark labeled “Max”. Panel B displays gene expression for stool samples taken from 15 cancer patients. Stage of cancer is indicated by the bottom row of the panel and by the type of line (5 patients with stage 0 or 1 (black lines), 5 with stage 2 (dashed lines), and 5 with stage 3 (gray lines). The 15 non-cancerous patients are not shown to simplify data visualization. Thus, panel A shows the power of the miRNA genes to differentiate among the groups (normal, cancer and IBD), whereas panel B shows the power of some of those miRNA genes to diferentiate among the various Dukes' CRC stages. Panels C and D display the same information as panels A and B, respectively, except that tissue samples were used instead of stool samples. Overall, the relationship among patient groups (panels A and C) and among cancer stages (panels B and D) are very similar using tissue samples. However, tissue samples differ from stool samples in that the variability within patient groups and within cancer stages are smaller for tissue samples, and the extent of miRNA expression is more prominent is tissue as compared to stool samples, as would be expected when comparing primary tumors to colonocytes diluted in stool.

A) Representative of Agilent gels for stool and LCM tissue samples showing nondegraded RNA from stool from a normal individual; Ns1 of 9 individuals who are either normal, with various stages of colon cancer, or severe UC. NT1, Tissue from a normal individual; S0-11, stool from a patient with adenomatous colon polyp 1 cm (stage 0-1); S221, stool from colon carcinoma patient (stage 2); S326, stool from carcinoma patient (stage 3); T0-11, LCM tissue from a patient with adenomatous colon polyp 1 cm (stage 0-1); T221, LCM tissue from colon carcinoma patient (stage 2); UCs1, stool from a patient with active severe UC; and UCT1, LCM tissue from a patient with active severe UC. B) Agilent electrophoretograms showing the 28S, 18S, 5.8S and 5S, and tRNA bands (from left to right) for the same stool and tissue samples as in A.
It is evident from our data that seven miRNAs (miR-21, miR-106a, miR-96, miR-203, miR-20a, miR-326, and miR-92) showed increased expression in stool (and also in tissue) of CRC patients, and that later Dukes' stages exhibited a more increased expression than adenomas. On the other hand, seven miRNAs (miR-320, miR-126, miR-484-5p, miR-143, miR-145, miR-16 and miR-125b) showed decreased expression in stool (and also in tissue) of CRC patients that seemed to be more pronounced in later Dukes' stages. MiRNAs from stool and tissue of UC patients was up-regulated for four miRNAs (miR-21, miR-203, miR-126 and miR16), and down-regulated for two miRNAs (miR-320 and miR-192); such aberrant effects were not observed in stool of Crohn's patients.

A) MicroRNA expression in stool samples taken from 30 individuals. The condition of the patient is indicated by the bottom row of the panel and by the type of line. There were 5 normal patients (black lines), 10 with IBD (dashed lines), and 15 with cancer (gray lines). Instances of high expression appear on the right and those with low expression on the left. Expression was measured by CP and scales were chosen so that minimum values line up on the Min mark labeled at the top of the panel. The same is true for the maximum values which line up under the mark labeled Max. B) This panel displays microRNA expression for stool samples taken from 15 cancer patients. Stage of cancer is indicated by the bottom row of the panel and by the type of line. There were 5 patients with stage 0 or 1 (black lines), 5 with stage 2 (dashed lines), and 5 with stage 3 (gray lines) cancer. The 15 noncancerous patients (stage NA) are not shown. C): MicroRNA expression for tissue samples taken from the same 30 individuals. Conditions of the patient are the same as in panel A. D) This panel displays microRNA expression for tissue samples taken from 15 cancer individuals. Stage of cancer is indicated as in panel B.
Table II shows alignment of the mRNA targets for the first and last seven reported seeds in miRNAs for the IGF2BP1 gene that has a large 3'UTR of 6,699 bases.
Discussion
Mortality and morbidity from colorectal cancer (CRC) represent a major health care problem involving a malignant disease that is theoretically preventable through appropriate screening. Early detection would be greatly enhanced if accurate, practical and cost-effective diagnostic biomarkers for this malignancy were available (7). Current screening methods lack sensitivity (e.g. fecal occult blood test, FOBT) or have low compliance (e.g. colonoscopy). About 700,000 Americans also suffer from the inflammatory disease UC at a cost of billions of dollars per year and there is no effective treatment for the underlying cause of the disease. Available therapies cause significant side-effects. Colon cancer is often a serious side-effect of long-term UC, even in remission patients (35).
RNA isolation procedure employed herein, compared to those used for isolation of DNA from stool samples (23, 81), were standardized and made simple by using improved commercially available kits to extract high quality total RNA from an environment as hostile as stool (85). This dispels the objection that it is difficult to employ miRNA as a screening substrate. Our innovation has been to stabilize total RNA shortly after obtaining fresh stool by fixing samples in a chaotropic agent and observing that RNA does not fragment thereafter. Fragmented RNA results in poor cDNA synthesis and ultimately in less than optimal PCR amplification.
Stem-loop TaqMan® MGB probes RT-qPCR microRNA expression in human stool and tissue from normal, colon cancer and IBD patients.
Real-time PCR refers to analysis of product kinetics by detecting them as they accumulate (i.e. on-line) at a large dynamic range of target molecule (i.e. at least five orders of magnitude as compared to traditional PCR) using Roche's LightCyclers (LCs) (97), allowing a more precise product determination during the log/linear amplification phase, and decreased labor and increased fluorescence (98, 99). Moreover, employing a two-step RT-PCR format that allows reverse transcription and amplification to be performed separately under optimal conditions is particularly attractive for experiments that require the same RT product to be used for analysis of multiple transcripts (100, 101), as compared to a one-step format that allows both cDNA synthesis and PCR amplification to be performed in a single tube, because of the flexibility it will provide for our particular type of multiple-parameter analysis.
Although miRNAs represent a relatively abundant class of transcripts, their expression level vary greatly among species and tissues (102). Less abundant miRNAs routinely escape detection with technologies such as cloning, northern hybridization and microarray analysis. Low sensitivity becomes a problem for miRNA quantification because it is difficult to amplify these short RNA targets. Furthermore, low specificity may lead to false-positive signal from closely related miRNAs, precursors and genomic sequences (47). A modified TaqMan-based quantitative real-time PCR assay was designed that incorporates two steps: a) stem-loop RT, and b) real-time PCR. Stem-loop RT primers bind to the 3' portion of miRNA molecules and are reverse transcribed with reverse transcriptase. The RT product is then quantified using conventional TaqMan PCR that includes miRNA-specific forward primer, reverse primer and a dye-labeled hydrolysis TaqMan probes. The purpose of tailed forward primer at 5' is to increase its melting temperature (Tm) depending on the sequence composition of miRNA molecules (85). Better specificity and sensitivity of stem-loop primers compared to conventional linear ones occurs due to base stacking and spatial constraint on the stem-loop structure. Moreover, base stacking improves the thermal stability and extends the effective footprint of RT primer/RNA duplex that may be required for effective RT from relatively shorter RT primers. The spatial constraint of the stem-loop structure may prevent it from binding double strand (ds) genomic DNA molecules, and therefore prevent amplification of any potential genomic DNA contaminants present in the preparation (85). The TaqMan minor groove binding (MGB) probes are employed to increase the Tm of very small probes; they are designed to have a Tm that is 10°C higher than primers, and probes are designed to have a 5' FAM and a 3' MGB (103).
To be able to screen several miRNA genes in a systematic manner using the proposed LightCycler technology in a sequence-specific RT, in which a cDNA preparation can assay for a specific miRNA, we employed a relative quantitative method involving amplification of the gene of interest (target) and a second control sequence (reference) also called an external standard, that amplified with equal efficiency as the target gene, in the same capillary, a procedure known as multiplex PCR. Quantification of the target was made by comparison of the intensity of the products (104). A suitable reference gene was the housekeeping gene 18S ribosomal (r)RNA used as a normalization standard because of the absence of pseudogenes and the weak variation in its expression (105, 106).
Alignment for the first and last 7 bases in various miRNAs seeds for IGF2BP1 gene targeted by by TargetScan algorithm (http://www.targetscan.org/).
Results for the expression of the 15 microRNA genes for both CRC and UC in this diagnostic study are in general agreement with what has been reported in the literature for the expression of these miRNAs in tissue, blood and cells in culture of CRC and UC patients and, in our case, miRNA expression patterns are the same for stool versus tissue samples, although to a lesser magnitude (60-77). Thus, these limited data indicate that the choice of carefully selected miRNAs can distinguish between non-colon cancer and cancer patients, and can separate between various Dukes' stages, in addition to distinguishing between colon cancer and UC.
A miRNA expression index similar to that developed for mRNA (107), or a complicate multivariate statistical analysis (108) is therefore not necessary for reaching conclusions from these data because the miRNA gene expression was able to distinguish between control and diseased individuals, and between CRC and UC. However, a larger sample may include patients that respond differently for some of the miRNA genes, in which case there may be a need to define a miRNA expression index, or employ a more complicated data analysis.
Other prognostic studies have reported detection of miRNA expression in human peripheral blood microvessicles (also known as exosomes or microparticles) (109) that can be transferred to another cell and be functional in that new environment (110). However, no correlation between the exosomal miRNA level and the stage of cancer was possible (111).
From our list of seven up-regulated miRNAs in CRC (miR-21, miR-106a, miR-96, miR-203, miR-20a, miR-326 and miR-92), we note that four (miR-21, miR-20a, miR-106a, and miR-203) were also described as up-regulated in colon cancer in two important papers by Schetter et al. (62) and Yantiss et al. (112); the latter showed that early-onset carcinoma in patients <40 years old showed pathological features associated with aggressive behavior. Within the seven miRNAs, we found that by using the TargetScan algorithm (95), two miRNAs (miR-20a and miR-106a) have the same seed region, and thus might to some degree have the same targets. TargetScan simply finds the genes with described 3'UTRs that have seven base reverse complements of the seed regions (bases 2-8) of the mature miRNAs (113). This basic bioinformatics approach yields 21 mRNAs that might be targeted by at least three of the six up-regulated miRNAs (counting only one of miR-20a and miR-106). The 21 mRNA genes encoding different cell regulatory functions are: BCL11B, CUGBP2, EGR3, DLGAP2, NUFIP2, KLF3, MECP2, ZNF532, APPL1, NFIB, SMAD7, SNF1LK, ANKRD52, C17orf39, FAM13A1, GLT8D3, KIAA0240, PCT, SOCS6, TNRC6B, and UHRF1BP1. Of these, the first 12 are found with the Database for Annotation, Visualization and Integrated Discovery (DAVID) program (of the Advanced Biomedical Computing Center (NCI, Frederick, MD, USA; http://david.abcc.ncifcrf.gov/) (114), and its Functional Annotational Clustering to be active in the nucleus and related to transcriptional control of gene regulation. The DAVID program allows addressing of relevant biological questions of genes based on molecular functions and biological processes and pathways of encoded proteins.
Regarding the seven down-regulated miRNAs in stool and tissue of CRC patients (miR-320, miR-126, miR-484-5p, miR-143, miR-145, miR-16 and miR-125b), miR-145 has been found to potently suppressed growth of three different colon carcinoma cell lines (60); furthermore, miR-320 correlated with the probability of recurrence-free survival by multivariate analysis. Suzuki et al. (115) found that tumor suppressor p53 enhances the post-transcriptional maturation of several miRNAs with growth-suppressive function, including miR-16, miR-143, and miR-145, in response to DNA damage. For the seven miRNAs, the mRNAs from TargetScan that are targeted by at least three miRNAs are TGFB1, CKS2, IGF2, KLK10, FLNA, CSE1L, CXCL3, DPEP1, and GUCA2B (see Table II for IGF2BP1, a variant of IGF2 gene). Of these mRNA genes, the first four are found by the DAVID program to be clustered in cell cycle regulation categories.
It is disappointing that no simple relationships seem evident from comparison of distinguished miRNAs showing either increased or decreased expression in stool/tissue and our distinguished mRNAs: FLNA, TGFB1, CKS2, CSE1L, CXCL3, DPEP1, KLK10, GUCA2B observed in an earlier transcriptomic study (45). However, only the very simplest targeting relationships are presently possible to investigate in silico. Other indirect mechanisms, other than targeting the 3'UTR seed region of mRNA by miRNAs, which connect mRNAs and miRNAs are known (116), and such connections for the above sets are certainly possible.
We have used TargetScan in this study as a first convenient step to correlate miRNAs with target mRNAs. TargetScan algorithm employs conservation at the expense of ignoring several human-specific miRNAs that could be of great importance (117). Moreover there have been several complexities and uncertainties related to TargetScan that could cause confusion (118-120). In subsequent experiments, we could use other algorithms, such as DIANA-micro http://www.diana.pcbi.upenn/edu (121), miRanda http://www.microrna.org (122), or PicTar http://pictar.bio.nyu.edu (123). These programs differ in their requirement for base pairing of miRNA and target genes, and implement similar but not the same criteria when cross-species conservation is applied. Therefore, these programs will generate different sets of target genes for many miRNAs. We will also employ the important and expanding collections of verified targeting relationships (some in vivo), e.g. miRecords at http://mirecords.umn/miRecords/.
The next step to take will naturally be to design prospective specimen collection, retrospective blinded evaluation (PRoBE) design of control subjects and cancer cases (124) for two large studies of hundreds of individuals, one for CRC and another for UC to avoid decreased sensitivity and specificity when we combine analyses of CRC and UC in a single study) and to have statistical confidence in their outcome using the methods that we have outlined herein. Moreover, employing cytological methods (125-126) on purified colonocytes (127) could provide a numerical underpinning of the miRNA method as a function of total RNA. This numerical method could be accomplished, for example, by taking a known number of these colonocytes from a known amount of stool, e.g. 1 g (from normal and neoplastic preparations), extracting total RNA from them to determine the actual amount of total RNA per stool sample, and determining the average CP value from the panel of selected miRNA genes, eventually arriving at an average CP value per a certain amount (e.g. pg or ng) of transformed total RNA.
Acknowledgments
We express our deep gratitude to Nancy C. Jaggard for coordinating sample collection, Stephanie I. James for advice on qPCR and Salah M. Ahmed for help with drawings and graphics.
- Received September 14, 2009.
- Accepted October 26, 2009.
- Copyright© 2009 International Institute of Anticancer Research (Dr. John G. Delinassios), All rights reserved
References
In this issue


Jump to section
Related Articles
Cited By...
- Colorectal Cancer Screening With Traditional and New-generation Fecal Immunochemical Tests: A Critical Review of Fecal Occult Blood Tests
- Identification of microRNA-135b in Stool as a Potential Noninvasive Biomarker for Colorectal Cancer and Adenoma
- Detection of miR-92a and miR-21 in stool samples as potential screening biomarkers for colorectal cancer and polyps
- The mRNA Stability Factor HuR Inhibits MicroRNA-16 Targeting of COX-2
- Fecal MicroRNAs as Novel Biomarkers for Colon Cancer Screening