


Abstract
Background: The purpose of the present study was to evaluate the detection rate of genomic aberrations in haematological malignancies using oligobased array-CGH (oaCGH) analysis in combination with karyotyping and fluorescence in situ hybridization (FISH) analyses, and its feasibility in a clinical pragmatic approach. Materials and Methods: The 4x180K Cancer Cytochip array was applied in 96 patients with various haematological malignancies in a prospective setting and in 41 acute myeloid leukemia (AML) patients retrospectively. Results: Combined use of oaCGH analysis and karyotyping improved the overall detection rate in comparison to karyotyping-alone and vice versa. In cases with normal karyotypes oaCGH analysis detected genomic aberrations in 66% (39/60) of cases. In the group of simple karyotypes oaCGH analysis extended karyotypic findings in 39% (12/31) while oaCGH analysis extended the karyotypic findings in 89% (39/44) of cases with complex karyotypes. In 7% (5/75) of cases oaCGH analysis failed in detecting the observed abnormalities by karyotyping. Conclusion: oaCGH analysis is a valuable asset in routine cytogenetics of haematological malignancies.
Karyotyping is a clonal and single-cell-based genomic screening method. It is cost-effective and considered the gold standard to detecting cytogenetic aberrations in acute leukemias and other haematological diseases, being part of the routine diagnostic work-up (1, 2). Cytogenetic diagnostics by banding or by fluorescence in situ hybridization (FISH) analyses are important to determine prognosis, and are in many cases required in treatment protocols related to e.g. leukemia (3) and multiple myeloma (4).
Cytogenetic analysis in haematological malignancies is hampered by poor chromosome quality, limited resolution and the fact that abnormal cells need to divide for cytogenetic abnormalities in order to be detected by metaphase analysis (5). In addition, conventional cytogenetic analyses can result in the description of marker chromosomes, which comprise of re-arranged fragments whose origin remains undetermined by banding methods. Furthermore, imbalanced material in tumor genomes, such as double-minute chromosomes or homogenously staining regions (hsr), is difficult to assess by banding methods. To circumvent such obstacles a great number of FISH analyses have been developed including 24-color karyotyping, whole-chromosome and arms-specific painting probes, in addition to using locus-specific probes in metaphases and in interphase nuclei to enhance cytogenetic diagnostics (5-7). Often, it is tedious work to use a great number locus-specific probes to screen for cytogenetic abnormalities in several genomic regions of relevance, which can be impractical in a clinical setting due to timing and costs.
Oligo-nucleotide array-based comparative genomic hybridization (oaCGH) analysis is a high-througput genomic screening method that can detect genomic imbalances at the gene level in a single experiment (8). For this reason it has become a first tier test in routine constitutional genetic investigation that has almost replaced conventional cytogenetic analysis in clinical genetic diagnotics and is part of prenatal screening (9). In addition, oaCGH analysis has proven to be a valuable research tool to investigate genomic lesions in leukemic cells (10-12), but it is not broadly used in routine cytogenetic diagnostics of haematological malignancies (13).
The purpose of enhancing cytogenetic diagnostics by combining cytogenetic diagnostics with oaCGH analysis in haematological malignancies is multimodal. First, to dissect genomic aberrations at the gene level in order to refine karyotyping result; secondly, it is possible to detect submicroscopic or cryptic aberrations; thirdly, it is possible to detect genomic aberrations in cases where cells are non-dividing or come from fixed tissue; and finally, to detect novel non-random genomic imbalances that may be future prognostic targets.
Herein I evaluated the adjuvant effect of combining conventional cytogenetic analysis including advanced molecular cytogenetic FISH analyses and oaCGH analysis. We retrospectively examined 41 acute myeloid leukemia (AML) cases and 96 cases with a variety of haematological malignancies in a prospective clinical setting. Results clearly demonstrated the ability of whole-genome array screening with an oligobased 4x180K aCGH platform, to be used in a routine setting not only to identify clonal aberrations that are established as prognosticators, but also to provide identification of novel predictive markers and evaluation of treatment response. It is important to notice that an oaCGH result can be present within the time frame of conventional cytogenetics and therefore does not delay cytogenetic diagnostics as long as the oaCGH analysis is an integrated part of the cytogenetic armamentarium in the cytogenetic laboratory.
Results suggest that oaCGH analysis is a reliable and accurate technique in identifying genomic alterations in haematological malignancies in a clinical setting and that a combined usage of conventional and molecular cytogenetics together with oaCGH analysis maximizes the detection rate of genomic abnormalities in these diseases.
Materials and Methods
Patients. A total of 137 adolescent patients were analyzed by oaCGH analysis in the present study. A retrospective cohort of 41 adult patients with acute myeloid leukemia was randomly selected from biobanked material sampled in the period of July 2000 to September 2010. The median age at first diagnosis was 66 years (range=30-86 years). Nineteen patients were male; twenty-two were female. In the retrospective AML cohort oaCGH analysis was done blinded, i.e. the oaCGH result was reported without knowledge of the karyotyping results. The prospective study cohort consisted of 96 adult patients with a variety of haematological malignancies, including the most common AML (n=26), myelodysplastic syndrome (MDS) (n=14), chronic myelomonocytoc leukemia CMML (n=5), myeloproliferative neoplasia (MPN) (n=3), B-cell acute lymphoblastic leukemia (ALL) (n=13), T-ALL (n=6), and other (n=29; thrombocytopenia, anemia, neutropenia, polycythemia vera (PV), essential thrombocythemia (ET), myelofibrosis, acute promyelocytic leukemia (APL), lymphoma, hairy cell leukemia and immunodeficiency. They were referred and examined in a clinical setting in the period between March 2012 and April 2015. The median age at first diagnosis was 52 years (range=17-89 years). Fifty patients were males; forty-five were females. In both cohorts the karyotype findings were correlated with oaCGH results. Five patients' cases have been previously published and characterized in greater detail. These cases numbers are: 152 (14), 213 (15), 215 (16), 216 (17), and 229 (18). One patient with cutaneous lymphoma was referred in November 2012 and included although oaCGH was performed without karyotyping. Ten patients had clinical follow-up oaCGH analyses performed but these were not included in the study. Six patients had germ-line DNA evaluated by oaCGH analysis to exclude congential genomic aberrations. The study was conducted in accordance with the Declaration of Helsinki and was approved by the local ethics committee. Unless stated otherwise all analyses were done on aspirated bone marrow cells at first diagnosis.
Cytogenetic analysis. Unstimulated overnight cultures of bone marrow samples from the patients were examined according to our standard laboratory protocols. Phytohaemagglutinin (PHA)-stimulated cultures from a peripheral blood sample were established at a later time point to examine whether the identified chromosomal abnormalities were acquired or congenital. Chromosome preparations were treated and stained for Giemsa-banding. Karyotypes were described according to ISCN 2013 (19).
FISH analysis. In order to characterize chromosome re-arrangements multicolor FISH was performed on chromosome preparations from bone marrow in selected cases according to manufacturer's instructions using the following human XCyting multicolor FISH probes (MetaSystems, Altlussheim, Germany): i) 24-color karyotyping was done with the 24XCyte kit consisting of 24 different chromosome painting probes; and ii) mBanding with XCyting probes for chromosome 3 consisting of a series of partial chromosome paint probes for sequential partially overlapping chromosome regions of a single chromosome. Each of the XCyte probes was labeled with one of five fluorochromes or a unique combination thereof (combinatorial labeling). Metaphases were counterstained with 4’,6-diamidino-2-phenylindole (DAPI). Image capture was done with an automated Zeiss Axio Imager.Z2 equipped with a CCD-camera (CoolCube1) and appropriate filters using Isis software (MetaSystems). Karyotyping was done using the 24-color mFISH upgrade package, ISIS, including mBanding. Whole chromosome and arms-specific painting probes (Kreatech, Amsterdam, The Netherlands) were used in selected cases according to manufacturer's instructions.
Table I summarizes commercial and custom-made locus-specific bacterial artificial chromosomes (BAC) directly fluorescent-labeled probes that were used for validation of identified abnormalities by oaCGH analysis and break point mapping. FISH analyses were performed according to manufacturer's instructions. To estimate the number of abnormal cells 200 interphase nuclei was evaluated by two independent observers.
oaCGH Analysis and interpretation of microarray data. The CytoChip Cancer 4x180K v2.0 (BlueGnome, Cambridge, UK) encompassing a 20-kb backbone with highest concentration of probes at 670 cancer genes, was used for oaCGH analysis according to the manufacturer's instructions, as described previously (20). DNA purified from bone marrow cells, peripheral blood or skin biopsies were used together with pooled sex-mismatched genomic DNA as reference. In cases where oaCGH analysis was not decided upon receipt of sample for cytogenetic analysis surplus material was stored in a refrigerator for up to one week. There was no apparent loss of abnormal cells while stored and DNA could be purified with good quality. After hybridization, washing and drying, the oligo array was scanned at 2.5 μm with GenePix 4400A microarray scanner. Initial analysis and normalization was done with BlueFuseMulti v3.1. For analysis and visualization normalized log2 probe signal values were imported into Nexus Copy Number software v. 6.1 (BioDiscovery, Hawthorne, California, USA) and segmented using FASST2 segmentation algorithm with a minimum of 3 probes/segment. Reference genome was NCBI build 36.1 (hg18). The University of California Santa Cruz (UCSC) database (http://genome.ucsc.edu) was used for bioinformatics analysis.
Locus-specific FISH probes used in the study.
We used a previously developed standardized workflow for a comprehensive analysis of the oligobased-microarray data, its interpretation and decision making for reporting results was performed using criteria adapted as reported previously (21, 22): i) all segments larger than 5 Mb (resolution of conventional karyotyping) were regarded as true aberrations and included; ii) all segments smaller than 5 Mb that coincided with known cancer genes (http://cancer.sanger.ac.uk/cancergenome/projects/census) were included; iii) since paired control DNA was not used in most cases, alterations that coincided with normal genomic variants (CNVs) was excluded. In five selected cases a normal matched sample (DNA was isolated from CD3+ selected cells of peripheral blood in one cases or DNA was isolated from a skin biopsy in four cases) were used to distinguish somatic genomic changes from constitutional CNVs; and iv) all data were also visually inspected to define alterations present in low proportions of cells, and to eliminate alterations called in regions with low probe density. Only oaCGH aberrations fulfilling the above criteria were included and described according to ISCN 2013 (19).
Results
Karyotyping. The diagnosis, karyotyping results at diagnosis and oaCGH results for the two studied cohorts of patients, a retrospective cohort of 41 AML patients and a prospective cohort of 95 patients with various haematological malignancies, are given in Table II. In the Table an additional case without karyoyping is included. Twenty-one patients of the retrospective AML cohort had an abnormal karyotyping result, where 15 patients had a simple clonal aberration defined as the occurence of a clone with one numerical or structural chromosome aberration after karyotyping by G-banding and/or 24-color karyotyping. The remaining 6 patients had a complex karyotype. In the prospective study cohort of 95 karyotyped cases with various haematological malignancies 40 cases had normal karyotypes and 1 case had no evaluable metaphases. In the remaing cases, 54 patients had an abnormal karyotyping result out of which 16 had a simple clonal aberration and 38 had a complex karyotype.
oaCGH analysis in patients with normal karyotypes. In the retrospective cohort of AML patients with normal karyotypes (n=20) oaCGH analysis confirmed the karyotyping results in 10 cases, and in 10 cases the oaCGH analysis detected additional aberrations. In one example, a cryptic deletion approximately 19,9 Mb in size at chromosome 3 band regions p14.2 to p12.3 was detected by oaCGH analysis and confirmed by mBanding with chromosome 3 XCyte probes (Figure 1A). Re-evaluation of the G-banded metaphases indicated that it is possible to discern the deletion although not unequivocally or to the same genomic precision as with the oaCGH analysis. In another AML patient, an insufficient number of mitoses was available for analysis although they all appeared normal, oaCGH analysis revealed complex aberrations in a high percentage affecting chromosome regions 2p, 6q, and 7q (Figure 1B). FISH analysis with probes representing aberrant genomic regions at 2p (ALK), 6q (SEC63/Cen6), and 7q (ELN/7q31) confirmed the aberrations and that these were present in approximately 80% of the interphase nuclei. Screening for abnormal metaphases was still negative, suggesting that the abnormal clone had not divided in vitro. In the prosepctive cohort 41 patients had a normal karyotype and oaCGH analysis confirmed the karyotyping results in 12 cases, and in 29 cases the oaCGH analysis detected additional aberrations. One example is a T-ALL patient with a normal karyotype where oaCGH analysis detected two submicroscopic deletions at 4q28.1q28.2 (1.20 Mb in size) and 5q21.1q21.1 (0.15 Mb in size) (Figure 1C). The deletions were confirmed by FISH analyses and present in approximately 98% of the interphase nuceli, while the deletions were absent in PHA stimulated cells cultures.
Summary of patients and their karyotyping, FISH and oaCGH results.
It can be challenging to determine whether a genomic imbalance detected by oaCGH analysis is part of the abnormal haematological clone or it is an inborn genomic aberration especially in cases with non-recurrent genomic findings. In these cases it is convenient to obtain a skin biopsy and perform an additional oaCGH analysis using purifed DNA from the skin biopsy and use the same reference DNA used in the first analysis. An example of a patient with secondary MDS after treatment for DLCBCL is shown in Figure 2. In this case oaCGH analysis from patients bone marrow cells detected three deletions, two at 7q (7q32.3 and 7q35) and one at 14q with different log2 ratios. oaCGH analysis of the skin biopsy revealed that only the 7q32.3 deletion was acquired. By FISH analysis with a specific BAC probe in this region, RP11-48A7, it could be determined that the deletion was present in 8% of the cells. In addition, FISH analysis on a follow-up bone marrow sample three month later after initial diagnosis revealed no cells contained the deletion at 7q32.3 demonstrating that this deletion indeed is acquired while the other two deletions were inherent.
oaCGH Analysis in patients with simple karyotypes. In cases with simple clonal aberrations (n=15) oaCGH analysis confirmed the karyotyping results in 5 cases in the AML retrospective cohort, and in 4 cases additional genomic aberrations were detected or oaCGH enhanced the interpretation of the aberration. In the prospective cohort simple clonal aberrations were found in 16 cases and this was confirmed by oaCGH analysis in 1 case, and in 8 cases the oaCGH analysis detected additional genomic aberrations. In a case with MDS G-banding revealed an interstitial deletion at the short arm of chromosome 12, del(12)(p12p12). oaCGH analysis confirmed the deletion but could also more precisely determine that the deletion were approximately 15,24 Mb in size including the ETV6 gene (Figure 3A). FISH using the commercial dual color ETV6/RUNX1 probe confirmed the deletion and that it was present in approximately 95% of the interphase nuclei. Furthermore, oaCGH analysis revealed two additional submicroscopic deletions at 20q11.21q11.23 and 20q13.12q13.12 which were approximately 5.29 Mb and 1.40 Mb in size, respectively. FISH analysis with BAC-based probes from each of the two regions confirmed the deletions and that they were present in 95% of the interphase nuclei. In addition, FISH analysis was able show that the deletions were present on the same chromosome 20 homologue (Figure 3A). In another AML case, a simple karyotpye cytogenetic analysis detected an additional i(11)(q10), that was confirmed by oaCGH analysis without additional genomic aberrations (Figure 3B).

G-banding, multi-color FISH and oaCGH analyses in patients with normal karyotypes. Panel A. Left-hand side shows a partial karyogram of chromosome pair 3 from case 112 with AML. In the middle section the oaCGH result revealing a deletion at chromosome 3 banding region p14.2 to p12.3 is shown. Right-hand side shows the mBanding of the deleted chromosome 3 (upper row) where the Cy5 signal is greatly reduced as a result of the deletion compared to a normal chromosome 3 (lower row). Panel B. Left-hand side shows the chromosome summary view of case 139 with amplification of 2p25.3p13.1 (blue shade), two deletions at 6q (6q14.1-q16.1 and 6q16.1-q27) and one deletion at 7q21.1q36.3 (red shade). To the right from top to bottom are given the interphase nuclei results using the indicated FISH probes. Panel C. Zoom view of chromosomes 4q and 5q from case 219 with T-ALL. Vertical blue lines indicate log2 ratios +0.24 and +0.60 and red lines indicate log2 ratios −0.24 and −1.0. The X-axis at the bottom indicates chromosomal position. The deleted regions are indicated by red shade. At the bottom the FISH validation using the indicated BAC-based FISH probes in addition to centromeric chromosome 4 probe and 5qter probe are shown.
oaCGH analysis in patients with complex karyotypes. By combining all cases with complex karyotypes, oaCGH analysis enhanced the karyotypic interpretation in 89% (39/44) of cases. As one example, G-banding revealed apparent monosomies of chromosomes 13 and 20 together with a marker chromosome in a case with pre-B ALL (Figure 4A). Whole-chromosome painting using chromosome 13 and 20 probes revealed an unbalanced translocation between the two chromosomes, der(?)t(13;20), although the derivative nature of the chromosome was undetermined, as well as the break points involved. oaCGH analysis could determine that the derivative chromosome was in fact a dicentric chromosome dic(13;20) with breakpoints at 13q12.3 (between oligo-probes A_16_P19760982 and A_16_P19761007 at pos. 29,365,828 and 29,378,740) and 20p11.22 (between oligo-probes A_16_P21100106 and A_16_P03500168 at pos. 22,109,174 and 22,148,175). The deletions and breakpoints on both chromosomes were confirmed by BAC-based locus-specific FISH analysis (Figure 4A). There are no apparent genes located at the breakpoint regions at 13q12.3 and 20p11.22. The oaCGH analysis revealed two additional submicrocsopic deletions at 9p21.3 and at 3q21.3 in this case.

oaCGH analyses in a patient with normal karyotype. oaCGH analyses showing zoomed chromosome views of chromosomes 7 and 14 from case 188 with secondary MDS. The deleted regions are indicated by red shade together with its maximal chromosomal position Panel A. oaCGH analysis using DNA from bone marrow at the time of admission. Panel B. oaCGH analysis of DNA from a skin biopsy two weeks after admission to determine the inherent genomic background using the same reference DNA as the one used for the bone oaCGH examination.

G-banding, multi-color FISH and oaCGH analyses on patients with simple abnormal karyotypes. Panel A. Left-hand side shows a partial karyogram of chromosome pairs 12 and 20 from case 209 with secondary MDS. Arrow indicates the derivative chromosome 12 with an interstitial del(12)(p12p12). There were no apparent cytogenetic abnormalities in chromosome pair 20. In the middle section upper row, the oaCGH result revealing an interstitial deletion 15.24 Mb at chromosome 12 region p13.31p12.1 is shown. In the lower row two deletions on 20q at q11.21 to q11.23 and at q13.12 to q13.12 are shown. Right-hand side shows the FISH validation results using the ETV6/RUNX1 probe set in the upper row. In the lower left row right-hand side the hybridization results using the BAC-based probes RP11-42O4 and RP11-169A6 at 20q11.22 and 20q13.12, respectively, together with a centromeric probe for chromosome 20 are shown. Same metaphase as in left hand-side except that the centromeric chromosome 20 signals are omitted. Panel B. Left-hand side shows the partial karyogram of chromosome 11 from case 185 with AML. In the middle section arms-specific painting probes for the short and long arms of chromosome 11 are shown. A zoom view of oaCGH result for chromosome 11 indicates amplification of the long arm of chromosome 11.
In a case with T-ALL where G-banding and 24-color karyotyping inferred a complex karyotype, 46,XX, der(5)t(5;6)(q35;q21),i(7)(q10),-21,+22, oaCGH analysis could confirm the unbalanced nature of the der(5)t(5;6), i(7)(q10) and the loss of chromosome 21 and gain of chromosome 22 without additional aberrations (Figure 4B). Due to the unbalanced chromosome der(5)t(5;6)(q35.3;q21), oaCGH analysis could determine the breakpoints at the gene level and thereby refine the breakpoints at 5q35.3 (between the oligo-probes A_16_P01406450 and A_16_P01406461 at pos. 180,444,892 and 180,459,698, respectively) and at 6q21 (between the oligo-probes A_14_P139239 and A_16_P17665471 at pos. 107,173,886 and 107,193,223, respectively). FISH analysis with BAC-based locus-specific FISH probes confirmed the 5q35.3 deletion and amplification at 6q21 in addition to a fusion at these chromosome break points (Figure 4B). The breakpoint at 5q35.3 is between genes BTNL9 and OR2V2 and at 6q21 in either of the genes RTN4IP1 or QRSL1. The gene RTN4IP1 has tumor suppressor function and is down-regulated in thyroid cancer (23) and QRSL1 is a glutaminyl-tRNA synthase.
In an example of a case of AML with a complex karyotype, oaCGH analysis revealed a chromothriptic pattern involving chromosome 19 between the band regions p13.3 to p12 (Figure 5). Chromothripsis is a recently described phenomenon by which up to thousands of clustered chromosomal re-arrangements occur in a single event in localized and confined genomic regions in one or a few chromosomes, (24). ISCN2013 has defined chromothripsis as complex patterns of alternating copy number changes (normal, gain or loss) along a chromosome or a chromosomal segment and it is denoted “cth” (19). FISH analysis with the BAC probe RP11-626D17 located at 19p13.13 where the amplification is at its highest level together with the whole chromosome painting probe of chromosome 16 revealed that the locus specific probe had an appearance like a painting probe in abnormal metaphases confirming the high degree of amplification. It should be noted that there were several variants of aberrant chromosomes with an abnormal signal pattern for the RP11-626D17 probe. Herein we present one example of an abnormal der(19) chromosome where the RP11-626D17 probe revealed that the hsr determined by G-banding and by 24-color karyotyping for a large part in fact is chromosome 19p material translocated to the short arm of chromosome 16 which can be described as der(19)t(16;19)(p11;p11)hsr(19)(p11p13.3) (Figure 5). In normal metaphases the FISH experiment revealed two normal chromosomes 16 and signals from the RP11-626D17 probe at 19p. In addition, the cytogenetic findings were confirmed by oaCGH analsysis except for a derivative chromosome der(?)t(3;21), which was present in very few abnormal metaphases (Figure 5).

G-banding, multi-color FISH and oaCGH analyses on patients with complex abnormal karyotypes. Panel A. In case 142 with pre-B ALL is at left-hand side shown the partial G-banded karyograms of chromosomes 13 and 20 in a normal (upper row) and an abnormal metaphase (middle row) together with a marker chromosome. The lower row shows the dual-color painting result with whole chromosome painting probes for chromosome 13 and 20. In the middle section the oaCGH result of chromosomes are shown for chromosome 13 and chromosome 20. Red shade indicates the deleted regions and arrows indicate the break points. The relative positions (not to scale) of the BAC based FISH probes used for validations are indicated. In the right-hand side is shown an interphase nucleus with fusion signal and partial deletion in each of the two probes RP11-242I5 and RP11-962L23 (white arrow). Panel B. In case 156 with T-ALL the left-hand side shows the G-banded karyogram in the upper row and 24-color karyogram in the lower row. In the middle section upper row a summary karyogram view of the oaCGH analysis is shown. In the right-hand panel a zoom view of the break point region on chromosome 5q35.3 (upper row) and 6q21 (lower row) is shown. The relative positions of the BAC based FISH probes for validations are indicated. In middle section (lower row) an interphase nucleus and partial karyograms indicating fusion and partial deletion in each of the probes RP11-148J9 and RP11-46K13 is shown.
oaCGH analysis of a tumor biopsy from a cutaneous lymphoma. In a case of cutaneous lymphoma our clinicians wanted an evaluation of genomic aberrations in a small biopsy from a tumor lesion. The biopsy was too small for culturing and subsequent karyotyping and therefore oaCGH analysis was performed (Figure 6). The oaCGH analysis revealed trisomy of chromosome 3, a 31.56 Mb deletion at 6q22.31-q25.2 and a 0.27 Mb submicroscopic deletion at 12q23.1 using commercially pooled DNA as a reference. The oaCGH analsysis of a later blood sample did not reveal any aberrations. FISH analysis with the BAC-probe RP11-101D18 on PHA stimulated blood cells was also normal. A subsequent bone marrow sample showed normal karyotype without the microdeletion confirming that the bone marrow was not affected. Trisomy 3 and del(6q) are compatible with non-Hodgkin's lymphoma. There are four genes located at 12q23.1 out of which LTA4H is implicated in primary effusion lymphoma (25) and ELK3 is implicated in cancer (26).

G-banding and multi-color FISH analyses on a patient with a complex abnormal karyotype and chromothripsis determined by oaCGH analysis. In case 174 with AML the left-hand side shows the G-banded karyogram in the upper row and 24-color karyogram in the lower row. In the middle section upper row a summary karyogram view of the oaCGH analysis and in the lower row is shown a zoom view of chromosome 19 revealing a chromothriptic pattern in the short arm of chromosome 19 is shown. The relative position of the BAC based probe RP11-626D17 (not to scale) are indicated and used for FISH validation. In the right-hand panel metaphases after dual-color FISH analysis using whole chromosome painting probe for chromosome 16 and the locus-specific RP11-626D17 in a normal metaphase (upper row) and an abnormal metaphase (lower row) are shown. White arrow in the lower row indicates an example of a derivative chromosome with a hsr, der(19)t(16;19)hsr(19)(p11p13.3).

oaCGH analysis of a patient with cutaneous lymphoma. The left-hand side panel shows a summary view of the oaCGH analysis using DNA purified from the tumor and pooled male DNA as reference. Blue shade indicates genomic gain, red shade indicates genomic loss, and arrow indicates position of the microdeletion at 12q23.1. The right-hand side panel shows a summary view of the oaCGH analysis using DNA purified from peripheral blood against pooled male DNA as reference.
Summary of oaCGH findings. Table III summarizes the adjuvant effect of oaCGH analysis in the two study cohorts. In the prosepctive study cohort oaCGH analysis was performed as part of the diagnostic work-up in addition to the routinely performed karyotyping and FISH analyses. In both study cohorts oaCGH analysis either confirmed or extended the genomic findings in comparable proportions in all three groups of karyotype complexity. By grouping all cases together, oaCGH analysis extended the genomic findings in 66% (90/136) of cases, while it confirmed the karyotypic findings in 23% (31/136) of cases. In cases with normal karyotypes oaCGH analysis extended the genomic findings in 64% of cases (39/61) while it was lower in the group with simple karyotypes being 39% (12/31). The highest degree of additional genomic information generated by oaCGH analysis was in the cases with complex karyotypes where the prospective group showed extended findings in 92% (35/38) of cases and in 67% (4/6) of cases in the retrospective AML cohort. In 7% (5/76) of all cases with karyotypic abnormalities oaCGH analysis failed to detect the identified abnormalities by karyotyping. This was primarily due to balanced translocations or marker chromosomes with a low abnormality frequency. In 13% (10/75) of all cases with an abnormal karyotype, oaCGH analysis neither was normal nor confirmed the karyotyping result, but identified other abnormalities that were grouped and termed ”Other”.
Summary of oaCGH results in the two hematological patient study cohorts with normal, simple or complex karyotypes.
Summary of oaCGH results in distinct diagnostic groups with normal, simple or complex karyotypes.
Characteristics of abnormal alterations identified by oaCGH analysis in different disease groups.

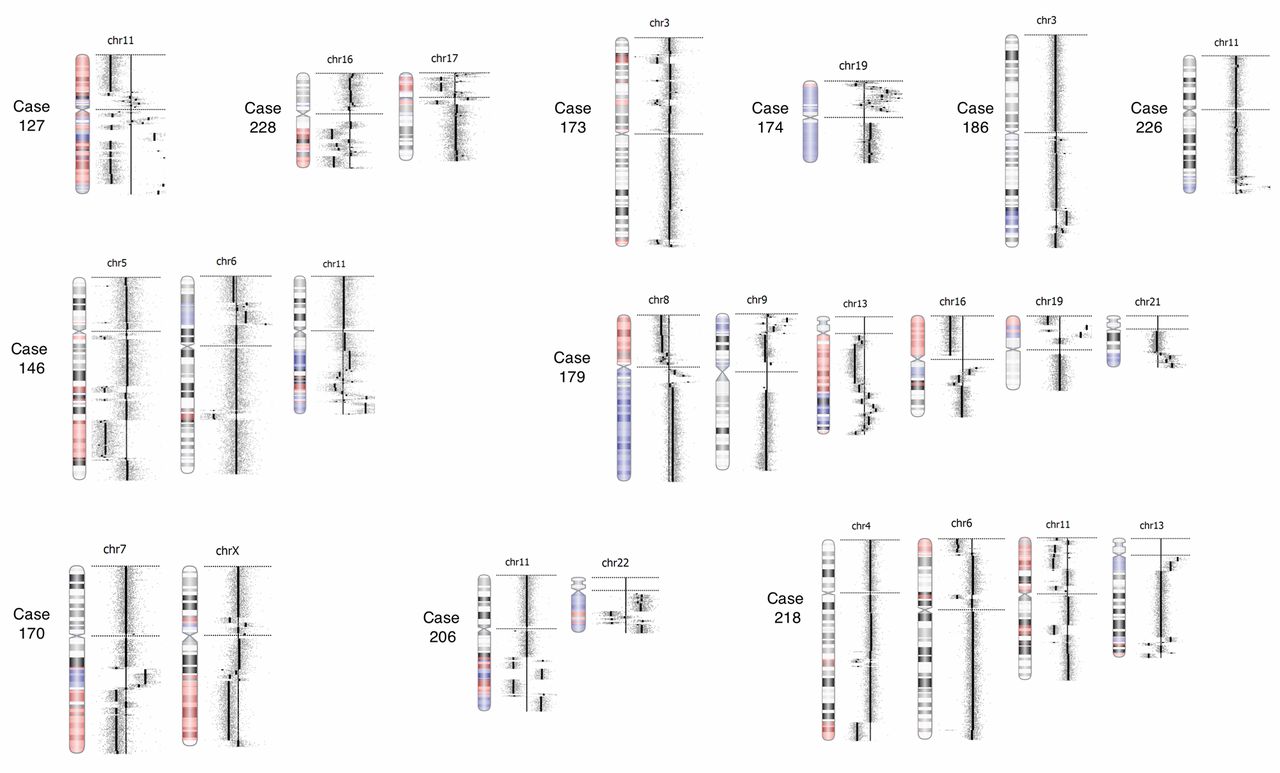
Chromothriptic chromosomes detected by oaCGH analysis. The gallery shows the 24 chromothriptic chromosomes detected in 11 patients. Case numbers indicate the aberrant chromothriptic chromosomes from each case.
A total of 478 aberrations were detected by oaCGH analysis out of 137 patient samples. In 41% (195/478) the detected aberrations were <5 Mb, in 39% (188/478) the aberrations were ≥5 Mb and the remaing 20% (95/478) were whole chromosome aberrations.
The adjuvant effect of oaCGH analysis with respect to haematological diseases was examined by grouping the most frequent haematological diseases from the study cohorts (Table IV). In the AML group oaCGH analysis extended the genomic findings in 60% (40/67) of cases with the highest frequency in cases with complex karyotypes. A similar pattern was observed in the MDS/CMML group and in the ALL group. In cases with normal karyotype, oaCGH analysis extended the genomic findings in a significant proportion of all three groups: in 56% (14/25) of AML, in 67% (6/9) of MDS/CMML and in 83% (5/6) of ALL. In 3% (3/104) of all cases with a simple or a complex karyotype oaCGH analysis showed a normal result thereby failing to detect the by karyotyping-obtained findings.
The characteristics of the aberrations identified by oaCGH analysis showed compatible patterns in terms of their types and sizes and of copy number alterations between the distinct disease groups (Table V).
Chromothripsis. In eleven (11/137, 8%) of all cases examined by oaCGH analysis in this study, chromothripsis was detected involving a total of 24 chromosomes (Figure 7, Tables V and VI). Chromothripsis was only observed in cases with complex karyotpyes. Six cases had more than one chromosome involved (three cases had two chromosomes involved, one case had three chromosome involved and two cases had five chromosomes involved), and in five cases only one chromosome was involved. The most frequent chromosome involved in chromothripsis in this study was chromosome 11 in 5 of the 24 cases (20%), while chromosomes 3, 6, 7, 13 and 19 were involved in two (8%) cases each. Interestingly, chromothripsis at 19p was observed in two AML cases (case 174 and 179) with high copy amplification of several genes including the gene CACNA1A, which belongs to the VGCC (voltage-gated calcium channel) family of genes that plays roles in cell proliferation, migrartion and apoptosis. They are highly expressed in most types of cancer including leukemia (27).
Correlation of number of copy number aberrations (CNAs) and their sizes with respect to karyotype complexity. It has been previously suggested that genomic complexity (defined as 3 or more oaCGH aberrations ≥5 Mb) may serve as an independent risk factor for disease progression in chronic lymphatic leukemia (28), and in AML it has been suggested that five or more oaCGH aberrations may correlate with prognosis (29). In the present study we analyzed both possibilities with respect to karyotype complexity (Tables VII and VIII). We found, perhaps not surprisingly, that higher numbers and larger genomic alterations are mainly present in the vast majority of cases with complex karyotypes irrespective of disease group. The distribution of numbers of oaCGH aberrations per case with respect to karyotype complexity correlates with the degree of karyotype complexity (Table IX).
Chromothriptic chromosomes and chromosomal regions.
Specific recurrent oaCGH aberrations for each individual chromosome. I next examined the types of aberrations revealed by oaCGH analysis at a chromosome-by-chromosome basis in all cases of myeloid malignancies (n=95). Chromothriptic aberrations were disregarded in this analysis.
Chromosome 1 was involved in 18 cases with 24 aberrations: one trisomy of chromosome 1, eight losses (median size: 7.31 Mb; range=0.10-48.00 Mb) and fifteen gains (median size: 27.00 Mb; range=0.01-155.73 Mb). Chromosome band 1p36 was involved in eight cases out of which six were AML and two were MDS. This chromosome band is approximately 27.8 Mb in size and harbors at least 70 RefSeq genes. Interestingly, 1p36 has been described to be involved in translocation and inversion in myeloid malignancies detected by 24-color karyotyping (30). Chromosome band 1p33 contained microamplifications in three cases with a median size of 37.9 kb (range=25.6-49.1 kb). The genes FAF1 and CDKN2C are located in this region. FAF1 is a member of the tumor necrosis factor (TNF) receptor super-family that interact with FAS lignad to mediate apoptosis and has a potential role in oncogenesis (31).
Chromosome 2 was involved in eight cases with 11 aberrations: four losses (median size: 22.93 Mb; range=0.01-91.12 Mb) and six gains (median size=32.00 Mb; range=0.01-147.94 Mb). In one AML case (case 148) chromosome band 2q33.1 had a submicroscopic amplification (0.49 Mb in size), which among other genes, contained the gene BMPR2. The gene BMP2 is one of about 20 BMPs, which are members of the transforming growth factor TGF-b-superfamily involved in the regulation of proliferation, differentiation, morphogenesis and apoptosis in a variety of cells including hematopoietic lineages (32).
Chromosome 3 was involved in nine cases with 12 aberrations, all of which were losses (median size=33.62 Mb; range=0.56-128.06 Mb). Ten of these deletions were located on the short arm of chromosome 3 with an overlapping region of 3.23 Mb in size (pos. 0-3,232,279 bp) in four AML cases. The genes CHL1, AK126307, hNB-3, CNTN6, CNTN4, IL5RA, hMtCCA1, TRNT1, and CRBN are located in this commonly deleted region. The CRBN gene is encoding a member of the E3 ubiquitin ligase complex functioning in the ubiquitin-proteasome protein degradation pathway and recently shown to be deleted in resistant multiple myeloma against immunomodulatory drugs (IMiDs) such as thalidomide, lenalidomide and pomalidomide (33). There are no current reports on CRBN gene in relation to AML, but interestingly lenalidomide is a drug currently tested for treatment of AML (34).
Correlation of genomic complexity with karyotype complexity in individual disease groups and in the entire cohort with a karyotype.
Correlation of ≥5 CNAs per case with karyotype complexity in individual disease groups and in the entire cohort with a karyotype.
Distribution of numbers of oaCGH aberrations per case with respect to karyotype complexity.
Chromosome 4 was involved in five cases with six aberrations: three trisomies of chromosome 4 and three deletions (median size=7.86 Mb; range=0.12-18.07 Mb). Trisomy 4 as the sole cytogenetic abnormality is unusual in acute leukemia with a reported prevalence of 0.0655% in AML and is even less common in ALL (35, 36). In all three AML cases trisomy 4 was recognized by karyotyping and confirmed by oaCGH analysis. In neither of these cases was trisomy 4 the sole cytogenetic abnormality. The identified deletions overlapped in two cases, one with AML (case 218) and one with PV (case 158). The overlapping region is located at chromosome band 4q24 (pos. 1,05,964,422-106,965,421 bp) and contains eight RefSeq genes (TET2, PPA2, BC008246, EEF1AL7, FLJ20184, INTS12 and GSTCD). Loss of TET2 in hematopoietic cells was recently shown to lead to DNA hypermethylation of active enhancers and induction of leukemogenesis (37).
Chromosome 5 was involved in 19 cases with 27 aberrations: 24 deletions out of which 20 were located on 5q (median size=33.31 Mb; range=0.02-11.76 Mb); and three gains out of which located on 5q. There were no cases with isolated monosomy 5 or del(5q) in this study cohort. In six cases where the del(5q) was uncovered by oaCGH analysis the deletion was unrecognized by karyotyping because it was submicroscopic (0.12-1.24 Mb in size) or cryptic (9.49 Mb). In two of these cases deletion was part of a structural rearrangement such as ins(18;5) and t(5;9;22), in two cases the karyotype was normal, and two cases had other than chromosome 5 aberrations. In the remaining cases oaCGH analysis refined the breakpoints of the detected del(5q) which by karyotyping was described within complex karyotypes with monosomy 5, marker chromosomes, or del(5q).
As an example (case 138) a submicroscopic deletion 0.34 Mb in size was detected within the chromosome band region 5q31.1. Four RefSeq genes are located in this region of which the paired-like homeodomain 1 (PITX1) gene attracts attention. This gene is a bicoid-related homeobox transcription factor involved in differentiation of pituitary cells and pituitary formation (38). It was later suggested to play a crucial role in cancer development as its down-regulation was reported in various types of human cancer, including colon, prostate, bladder, and malignant melanoma amongst other cancers (39-41) but has not previously been associated with haematological malignancies. Interstingly, PITX1 acts as a hTERT suppressor (42) via the microRNA, miR-19b (43). The telomerase genes hTERT and hTERC were recently shown to be frequently amplified in human malignancies including haematological malignancies (44) suggesting a possible link between PITX1 and myeloid malignancy.
In another case (case 171) a submicroscopic deletion 0.02 Mb in size was identified within the band region q32.1 of chromosome 5. The deleted region contains two genes, TCOF1 and CD74, not associated with myeloid malignancy previously. TCOF1 is a known nucleolar protein that regulates ribosomal RNA transcription (45). It was recently shown to be a DDR (DNA damage response) factor that cooporates with NBS1 which is part of the MRN complex playing a central role in the repair of DNA double-strand breaks to preserve genomic stability (46). NBS1 is important in the maintenance of genomic integrity and bi-allelic mutations in this gene predisposes to growth defects and B-cell lymphomas of patient with Nijmegen syndrome (47). The CD74 gene codes a non-polymorphic type II integral membrane protein acting as a receptor for the cytokine macrophage migration inhibitory factor (MIF) (48). Associations have been described between between CD74 expression and tumor development, progression and metastasis in solid tumors. In mice lacking CD74 a poor response to T-independent antigens was shown while the mature population responsible for the humoral immune response was missing.
In a case (case 229) with a submicroscopic deletion 0.36 Mb in size at 5q31.2 containing the genes SIL1, MATR3, SNHG4 SNORA74A, PAIP2, and SLC23A1. The gene SLC23A1 encodes a human vitamin C transporter (SVCT2) suggested to play a role in tumor suppression (49). It has also been shown that L-ascorbic acid has a cytotoxic effect on leukemia cells in vitro (50). We have previously characterized this patient in greater detail (18).
Chromosome 6 was involved in 11 cases with 11 aberrations: one trisomy of chromosome 6, four deletions (median size: 25.60 Mb; range: 3.35-76.82 Mb) and six gains (median size: 7.85 Mb; range=0.01-44.40 Mb). In two AML cases (case 192 and 193) the chromosome band 6q23.3 was involved with a microamplification of 0.03 Mb containing the 5’ part of the MYB gene. Mutations in the MYB gene was recently observed in primary myelofibrosis transformed to AML (51) and interaction of c-MYB with p300 is required for induction of AML by human AML oncogenes (52) suggesting a role for MYB in leukemogenesis.
Chromosome 7 was involved in 19 cases with 21 aberrations: nine monosomies of chromosome 7, ten deletions, eight of these located on 7q (median size=24,85 Mb; range=0.16-89.58 Mb); and two gains located on 7p. In five cases where the karyotyping results were normal or had an aberration unrelated to chromosome 7 the oaCGH analysis revealed submicroscopic deletions on 7q (0.16-4.14 Mb in size) and in one case it revealed a large 7q deletion (79 Mb). In the latter case (case 139) FISH analysis with a locus-specific probe confirmed the oaCGH result in interphase nuclei but was negative when examining metaphases (Figure 1B). Interestingly, in a bone marrow sample from the same patient obtained one month later the karyotyping showed monosomy 7. In the remaining cases oaCGH analysis refined the breakpoints as described by karyotyping analysis.
A submicroscopic deletion 0.16 Mb in size at chromosome band 7q31.1 was observed in one AML case (case 213) and affected a single gene, DOCK4. We have previously characterized case 213 (15), and it was suggested that DOCK4 was involved in the leukemogenic process (53).
A submicroscopic deletion at chromosome band 7q32.3 was observed in one MDS case (case 188) and affected the PLXNA4 gene. This gene was recently described to be deleted in myeloid malignancies with del(7q) (54). The plexin-A4 is a receptor that promotes tumor progression and tumor angiogenesis by enhancement of VEGF and gFGF signaling (55).
In two cases with myeloproliferative neoplasia and hypereosinophilia (case 168 and 221) an overlapping deletion at 7q22.1 (pos. 99,784,439-101,424,654) 1.64 Mb in size was observed while the karyotype in one case was normal (case 168) and showed idic(17p) in the other case (case 211). This region contains more than 50 RefSeq genes including FIS1, CUX1. Altered expression of the FIS1 gene has been suggested to be a novel molecular marker for prognosis estimation of AML (56). The CUX1 gene encodes a transcription factor that regulates a large number of miRNAs involved in DNA replication, DNA damage response and cell-cycle progression (57, 58). In addition, it has been shown that Cux1 transgenic mice developed an MPN-like myeloid leukemia (59).
Chromosome 8 was involved in 15 cases with 16 aberrations: nine trisomies of chromosome 8, five deletions (average size: 8.67 Mb; range: 1.09-33.09 Mb) and two gains. There were no overlapping regions of the submicroscopic lesions. All trisomies of chromosome 8 detected by oaCGH analysis were also identified by karyotyping.
Chromosome 9 was involved in four AML cases with seven aberrations: four deletions (average size=6.93 Mb; range=0.27-18.39 Mb); and three gains (average size=68.79 Mb; range=33.16-119.99 Mb). There were no overlapping regions of the aberrant lesions. Chromosome 10 was involved in four AML cases with six aberrations: four deletions (average size=16.50 Mb; range=0,16-31.92 Mb); and two gains. None of these aberrations were recurrent.
Chromosome 11 was involved in 17 cases with 18 aberrations: one trisomy 11; ten deletions (average size=7.42 Mb; range=0.06-41.04 Mb); and seven gains (average size=19.81 Mb; range=0.01-79.76 Mb). Eight of the deletions were on 11p and in two cases there was an overlapping deleted region at 11p15.5p15.4 (pos. 2,367,700-3,033,775) containing ten genes including TRPM5, CDKN1C, SLC22A18. A genetic polymorphism in the TRPM5 gene reduced the risk to develop leukemia in children (60). The CDKN1C gene is considered a tumor suppressor gene. It encodes a cyclin-dependent kinase inhibitor silenced in a variety of human malignancies including leukemias, in particular ALL (61). The gene SLC22A18 encodes an efflux transporter-like protein whose expression affects cellular metabolism, cellular growth, and drug sensitivity (62). It can act as an oncogene or a tumor suppressor gene in different malignancies but has not previously been associated with myeloid malignancy. Chromosome band 11q23.3 was involved in five cases in the present study. In two of these cases (104 and 213) a minimal region of amplification 0.37 Mb in size (pos. 117,846,060-117,855,780) could be determined containing 13 RefSeq genes, including the KMT2A (previously MLL) gene. Although uncommon, MLL gene amplification has been recognized as a recurrent event that occurs in AML and MDS (63). These patients tend to be older, have poor survival, often very complex karyotypes, and frequently deletion of or loss of 5q, but not 7q (64).
Chromosome 12 was involved 12 cases with 13 aberrations: 11 deletions (average size=16.79 Mb; range=0.02-82.29 Mb); and two gains. In six cases there was an overlapping region of minimal deletion at chromosome bands 12p13.2p12.3 (pos. 11,138,145-16,052,507 bp) containing more than 55 RefSeq genes including the ETV6 and CDKN1B genes. ETV6 deletion is a recurrent aberration in AML with complex karyotypes with a minimal deleted region, that spans over two putative tumor suppressor genes ETV6 and CDKN1B (65).
Chromosome 13 was involved in eight cases with eight aberrations: one trisomy of chromosome 13; four deletions (average size=39.09 Mb; range=1.37-60.00 Mb); and three amplifications (average size=26.53 Mb; range=0.43-66.16 Mb). A minimal overlapping region of deletion was at 13q14.3 (pos. 49,114,939-50,487,807 bp) in four AML cases containing 13 genes including DLEU1 and DLEU2. DLEU1 and DLEU2 are two long non-coding RNA (lncRNA) genes that are recurrently deleted in solid tumors and in chronic lymphocytic leukemia (66). Recently, down-regulation of DLEU2 has been associated with a pediatric AML case (67).
Chromosome 14 was involved in six cases with 10 aberrations: 1 monosomy of chromosome 14; 7 deletions (average size=11.48 Mb; range=0.50-35.43 Mb); and 2 gains. There were no overlapping regions of the aberrant lesions. Recently, the chromosome band region 14q31.1-q32.11 containing the FOXN3 gene was shown by oaCGH analysis to be a recurrent deletion in AML-M5 (29). In the present study, one patient (case 184) had an overlapping deletion compared to this region.
Chromosome 15 was involved in four cases with five aberrations: one trisomy 15; three deletions (average size=20.00 Mb; range=0.2-36.23 Mb); and one gain. The gene UNC13C at chromosome band 15q21.3 was deleted in two patients (cases 162 and 206). This gene was recently shown to be involved in gingiva-buccal oral squamous carcinoma (68) but there are no previous reports in myeloid malignancy.
Chromosome 16 was involved in five cases with seven aberrations: one trisomy 16; and six deletions (average size=42.65 Mb; range=2.72-88.83 Mb). A 15.27-Mb deletion at chromosome bands 16q23.1q24.3 (pos. 73,559,065-88,827,254 bp) framed a minimal overlapping region in four cases. This region contains more than 100 RefSeq genes including genes LDHD, WWOX, GINS2 and CDT1. LDHD among others being regulated by Cited2 in adult hematopoietic stem cells (69). WWOX is a putative tumor suppressor gene and its loss has been found in several types of solid tumors (70, 71) and recently in leukemia (72). The GINS2 gene was recently shown to be involved in tumor cell apoptosis and cell-cycle progression in a leukemic cell line (73). Recently, the CDT1 gene was shown to be overexpressed in a patient with acute leukemia suggesting that it plays a role in pathogenesis of acute leukemia (74).
Chromosome 17 was involved in 12 cases with 18 aberrations: 14 deletions (average size=5,62 Mb; range: 0.14-44.57 Mb); and four gains (average size=12.68 Mb; range=0.02-50.17 Mb). Nine of the 14 deletions were located at the short arm of chromosome 17 with a minimum overlapping region of 1.90 Mb in size at 17p13.2-p13.1 (pos. 6,277,032-8,172,538 bp) containing more than 70 RefSeq genes including the tumor suppressor gene TP53. In three of the cases the deletion was part of a monosomy 17 while in three cases it was present as a submicroscopic deletion that could not be detected by karyotyping. Deletions and/or mutations of TP53 have been shown in myeloid malignancy and have been often associated with del(5q) (75, 76). In our study we also found an association of 17p-deletion/TP53- with complex karyotypes and del(5q). A minimum overlapping deleted region at chromosome band 17q11.2 (pos. 25,958,094-27,344,419) was found in two cases. This region contains 22 RefSeq genes including NF1, miR-193a and SUZ12. NF1 encodes a neurofibromin that is predominantly expressed in leukocytes, and was recently shown to function as a cotumor suppressor with RASA1 in T cell lineages (77). In addition, it was recently shown to be deleted in patients with primary myelofibrosis (78). miR-193a has been shown to be involved in long non-coding RNA HOTAIR modulation of c-KIT expression in AML (79). The SUZ12 gene is a component of the Polycomb group complexes (PRCs), which have been implicated in conferring a neoplastic phenotype (80), and recently was shown deleted in patients with primary myelofibrosis (78).
Chromosome 18 was involved in five cases with seven aberrations: five deletions (average size: 21.89 Mb; range: 2.07-57.20 Mb); and two gains. 18q Deletions are rarely described (81) but in the present cohort three cases with a minimal overlap of deletion could be determined at chromosome bands 18q.12.3q21.1. One of these deletions was associated with ins(18;5) in an AML cases (case 229) that we previously characterized (18).
Chromosome 19 was involved in three cases with five aberrations: one deletion; and four gains (average size: 15.72 Mb; range: 4.31-31.27 Mb). Gain of chromosome 19 has frequently been detected in megakaryoblastic leukemias by CGH (82).
Chromosome 20 was involved in six patients with 10 aberrations: seven deletions (average size=4.09 Mb; range=1.40-6.81 Mb); and three gains (average size=0.46 Mb; range=0.08-1.15 Mb). Karyotyping revealed one patient with del(20q) detected by oaCGH. Deletion of the long arm of chromosome 20 is one of the most common recurring chromosomal abnormalities associated with myeloid malignancies. The small size of chromosome 20 together with its limited number of G-bands on its long arm has hampered characterization of submicroscopic deletions or rearrangements in this region. Studies using aCGH analyses or FISH mapping studies have not been able to identify pathogenetically crucial gene(s) involved in myeloid malignancies with del(20q) (83-85) although two commonly deleted regions (CDRs) on 20q have been defined; CDR1 at 20q11.23-20q12 and CDR2 within the band 20q13.12 (83). Our patients with 20q deletions partially overlap over these regions. The deletion of chromosome 20q material may result in loss of one or several tumor suppressor genes. Sequencing analysis of 20q genes have not detected any mutation suggesting that haploinsufficiency of several genes of this chromosomal region could contribute to leukemogenesis.
Chromosome 21 was involved in 11 patients with 16 aberrations: five trisomies of chromosome 21; four deletions (average size=2.22 Mb; range=0.11-8.57 Mb); and seven gains (average size=9.04 Mb; range=0.08-20.68 Mb). Apart from the recurrent trisomies of chromosome 21 a minimal region of microamplification was detected in four cases at 21q22.13q22.2 (pos. 38,270,300-40,362,577) 2.09 Mb in size containing 22 genes, including SH3BGR, ERG, and ETS2. The SH3BGR gene codes a TNF-alpha inhibitory protein and has been shown to be up-regulated in the APL NB4 cell line (86). In another microarray-based high-resolution CGH analysis of de novo AML patients revealed a non-random 1-Mb minimal critical region of amplification harboring the ERG and ETS2 genes (87). It has been suggested that ERG is a megakaryocytic oncogene together with ETS2 (88, 89).
Chromosome 22 was involved in four cases with four aberrations: two trisomies of chromosome 22; one deletion; and one amplification. Trisomy 22 has been associated with inv(16) in AML (90), which was not present in our trisomy 22 AML patients.
Chromosome X was involved in seven cases with 10 aberrations: four with loss of one X chromosome; five deletions (average size: 1.73 Mb; range: 0.12-4.65 Mb); and one gain. Except for the X chromosome losses, there were no recurrent aberrations related to the X chromosome in this cohort of myeloid malignancies. It is not generally established whether sex chromosome loss is an age-related phenomenon or a cytogenetic marker of haematological disease (91).
Discussion
The clinical application of oaCGH analysis in routine cytogenetics diagnostics of haematological malignancies is limited (13), although it has become a first tier in clinical genetics of constitutional diagnostics (9). This is despite the fact that conventional cytogenetic analysis in haematological malignancy is hampered by poor chromosome quality, limited resolution and that abnormal cells need to divide for cytogenetic abnormalities to be detected by metaphase analysis (5). These limitations of routine cytogenetics may lead to false-negative karyotyping results or imprecise descriptions of identified abnormalities, which in turn may influence studies determining the prognostic impact of chromosomal abnormalities in haematological malignancies.
There may be many reasons why oaCGH analysis use is limited in the clinical cytogenetic diagnostics of haematological malignancies. To include oaCGH analysis as part of the cytogenetic haematological diagnostic armamentarium several factors should be considered: i) does oaCGH analysis provide the genomic information in a timely manner in the clinical setting; ii) does oaCGH analysis provide additional information compared to that provided by karyotyping and/or FISH analyses which are routinely performed; iii) can oaCGH analysis identify aberrations that have potential clinical impact; and iv) the costs and handling of the oaCGH analysis in addition to data analysis, interpretation and validation of oaCGH results.
It is possible in a routine clinical setting to obtain a reliable oaCGH result within three to four working days, as demonstrated in our prospective study cohort (n=96). This is within the time-frame of conventional cytogenetics provided that there is sufficient sample material available and that the specialized equipment for oaCGH analysis is an integrated part of the cytogenetic armamentarium. Although 24-color karyotyping is a valuable tool to enhance conventional karyotyping in haematological cytogenetics (6, 30) in a clinical setting it is far from being used in all cases due to labor and reagents costs. In this study we used oaCGH analysis in a similar clinical setting and it is therefore important to determine when it should be applied. This is different to a research setting where the samples for oaCGH analysis are collected, organized, analyzed and interpreted in a centralized manner either in-house or at another facility. In the clinic the samples arrive out of order and a final report on the karyotyoic findings and interpretations thereof should often be present within a few days after sampling. Although oaCGH analysis is a highly sophisticated procedure with specialized equipment and software, as for 24-color karyotyping, we found that it is possible to perform oaCGH analyses in a small cytogenetic facility for haematological cytogenetic diagnostics, consisting of a team with five biotechnicians and one medical consultant, in a clinical setting as an integrated adjunct to conventional cytogenetics and other advanced molecular cytogenetics methods (20, 92).
Herein we showed that the combined use of oaCGH analysis and karyotyping improved the detection rate of abnormal genomic lesions compared to that of karyotyping or oaCGH analysis alone (Tables III and IV) in agreement with other studies (11, 13, 93, 94). We found that the adjuvant effect of the combined oaCGH analysis and karyotyping varied with respect to karyotype complexity. The highest adjuvant effect of oaCGH analysis was found in cases with complex karyotypes (89%, 39/44) although hidden genomic aberrations could also be detected in lower numbers (55%, 51/92) in cases with normal or simple karyotypes. The detected aberrations were mainly submicroscopic or cryptic to conventional karyotyping and were present both in normal and abnormal karyotypes. In addition, oaCGH analysis enhanced the description of unbalanced chromosomal aberrations such as derivatives, marker chromosomes, hsr, and in cases where abnormal cells had not divided.
Detection of submicroscopic imbalances is a major advantage of oaCGH analysis due to its high level of resolution (less than 0.1 Mb) compared to that of karyotyping (5-10 Mb). This allows for detecting submicroscopic aberrations that can harbor clinically relevant genes (21). Considering the entire cohort (n=136) we found that 41% (195/478) of all detected structural aberrations were submicroscopic imbalances (defined as <5 Mb in size). Sixty-one patients had a normal karyotype and oaCGH analysis detected at least one alteration <5Mb in size in 34 of these cases. Many alterations were found in regions that are known to harbor genes of clinical importance in myeloid malignancy such as deletions in 5q, 7q, 17p and 20q and in the lymphoid malignancies deletions in 6q and 9p are frequent (2). As one example from the present study, oaCGH analysis uncovered a submicroscopic deletion 0.34 Mb in size at 5q31.1 in an AML patient with a normal karyotype (case 138). The microdeletion in this patient is located within a CDR region at 5q31 that in AML and some aggressive forms of MDS have been shown to be of prognostic significance (95, 96). In another AML patient with a normal karyotype (case 213) the leukemic cells harbored a submicroscopic deletion at 7q31.1 involving only the DOCK4 gene, as detected by oaCGH analysis that we have previously characterized (15). This submicroscopic deletion was not located within the most recently proposed CDRs at bands 7q21-q22, 7q34 and 7q35-q36 although the 7q31.1 region is frequently deleted in AML conferring adverse prognosis (97). It is of note that even with a whole set of FISH probes located within these CDRs this submicroscopic deletion would have been missed if oaCGH had not been performed in this patient. Previous FISH studies of patients with various haematological malignancies determined the incidence of submicroscopic deletions to be between 4-65% depending on the specific genetic changes and disease entities (98, 99). In a study of MDS patients with a normal karyotype 17,8% of these had occult deletions involving the chromosomal regions 5q31, 7q31 and 17p13 detected by interphase nuclei FISH, and shown to have an impact on prognosis (99). It is, however, not clear whether submicroscopic deletions detected by oaCGH analysis have the same clinical impact as large visible deletions or FISH with probes located in regions of previously determined importance. The effect of submicroscopic imbalances detected by oaCGH analysis on the clinical prognosis needs further study, but still, it provides a handle to follow the clinical and treatment course of the patient.
Submicroscopic alterations may accompany structural rearrangements that are identified by karyotyping or may be distant from these while being on the same or the other chromosome homologue. For example, deletions of 5’ of ABL and 3’ of BCR often accompany BCR/ABL rearrangement in chronic myeloid leukemia and ALL patients, conferring a poor prognosis (100, 101). We have previously characterized two patients with unbalanced structural rearrangements, a patient with inv(2)(p23.3q24.3) (case 215) (16) and another with ins(18;5)(q21.1;q31.2q35.1) (case 229) (18), and shown that the submicroscopic deletions were directly involved in the structural rearrangements identified by karyotyping by metaphase FISH analysis. These findings demonstrate the importance of the combined usage of oaCGH analysis with karyotyping and FISH analyses to obtain a complete picture of genomic rearrangements in agreement with other views (7).
Cryptic chromosomal alterations are invisible for traditional banding analysis. They are often large scale, but below the the resolution of karyotyping, and is caused by imperfect banding or chromosome condensation. They are not rare events in myeloid malignancies, and often missed by 24-color karyotyping. Array-based CGH analysis has proven to be a powerful genomic screening method to detect these aberrations (102, 103). In the present study, oaCGH analysis revealed a cryptic deletion of approximately 19.9 Mb in size on the short arm of chromosome 3 at bands p14.2 to p12.3 in a patient with normal karyotype AML (Figure 1A). Deletions on the short arm of chromosome 3 are rare events in AML but have been described in few cases with secondary AML (104) and more recently in MDS (30). In another AML patient with a normal karyotype (case 122) we showed that oaCGH analysis revealed a cryptic deletion on chromosome 5 at bands q21.3 to q22.3, approximately 9.49 Mb in size. This deletion is outside CDRs defined on 5q (95, 96) and may therefore have been missed if oaCGH analysis had not been done in this patient.
A normal karyotyping result may be present in cases of insufficient number of metaphases available for analysis. In the present study we described an AML patient (case 139) with an insufficient number of metaphases available for karyotyping as described by the karyotype 46,XX[7]. oaCGH analysis showed gross chromosomal aberrations including gain on 2p, and major losses on 6q and 7q (Figure 1B). Screening with commercially available locus-specific FISH probes would have detected the 7q-deletion in interphase nuclei but the 2p and 6q aberrations would probably be missed because they would probably not have been examined for. This case indicates that when insufficient numbers of metaphases are available for analysis this can be an indicator that the abnormal cells have not divided in vitro and thereby missed detection by karyotyping. In such cases oaCGH analysis may be an efficient method to detect chromosomal aberrations of clinical importance in agreement with other observations (105).
In situations where clinicians want a whole-genome screening of abnormal cells from small biopsies or in cases of dry tap in the bone marrow there may often be too few cells avaiable for culturing and subsequent karyotyping. In these situations oaCGH analysis is a convenient method to examine the whole genome because only a few nanograms of DNA are necesseary for analysis, which can be easily obtained by DNA purification from the small biopsies (106). In the present study we had a case with a cutaneous lymphoma where we received a small biopsy from the tumor and oaCGH analysis revealed an aberrant result (case 149). In cases lacking a cytogenetic result for various reasons oaCGH analysis may be a valuable substitution.
Unbalanced chromosomal re-arrangements may present as derivatives, marker chromosomes, or as hsr in abnormal metaphases after conventional karyotyping. Although 24-color karyotyping can determine the chromosomal content of most of these unbalanced rearrangements (6, 107), oaCGH has an additional advantage. It can determine the involved breakpoint regions with high precision depending on the number of probes in the regions in question (21). The clinical significance of these unbalanced re-arrangements is very variable and depends on which chromosomal material is present and the context of other possible abnormalities that may exist (108). In the present study a marker chromosome, in addition to monomeric losses of chromosomes 13 and 20 was described by G-banding of the leukemic cells of a patient with pre-B ALL (Figure 4A). Whole-chromosome painting with chromosome 13 and 20, probes revealed an unbalanced translocation between these two chromosomes while oaCGH analysis determined the translocation break points with high precision at 20p11.22 and 13q12.3. The unbalanced dic(13;20) is very rare and has only been described in one previous case of AML with a complex karyotype (109, 110). Unbalanced translocations may be cryptic in apparent normal metaphases or present as additional. We have previously characterized an unbalanced novel der(5)t(4;5)(q26;q21.1) in an adult T-ALL patient with a normal karyotype (20). The unbalanced translocation was detected by oaCGH analysis and confirmed by 24-color karyotyping. In the present study we characterized another T-ALL patient where G-banding detected an add(5q) among other aberrations while 24-color karyotyping revealed the add(5q) as a der(5)t(5;6)(q35;?q) (Figure 4B). oaCGH analysis could determine the breakpoints at 5q35.3 and at 6q21 with high precision. This is a novel chromosomal aberration that has not been described previously (109). Homogeneously-stained regions often contain amplified material and its chromosomal content may be determined by multicolor FISH (111). We have shown one patient with AML and a complex karyotype (Figure 5) where several marker chromosomes were characterized by 24-color karyotyping and oaCGH analysis among other aberrations revealing a chromothripic pattern of the short arm of chromosome 19. By combining oaCGH analysis and 24-color karyotyping the derivative chromosome could be described as der(19)t(16;19)(p11;p11)hsr(19)(p11p13.3), which is a novel rearrangement. Taken together, oaCGH analysis greatly enhanced the karyotypic description in cases with unbalanced chromosomal rearrangements of different nature revealing novel aberrations.
A complex karyotype defined by three or more chromosomal aberrations is an independent poor prognostic factor in myeloid malignancies (112). In complex karyotypes, where it is difficult to accurately identify specific chromosomal aberrations, it was shown that oaCGH analysis is of benefit for obtaining clinically relevant information and selecting prognostic markers (Tables IV, VII and VIII). In AML, complex karyotypes confer poor prognosis although some patients perform better than expected (112). It may be that oaCGH analysis can define new sub-groups or define genomic regions of clinical importance in this rather unspecific complex cytogenetic group as more cases become characterized.
Chromothripsis is a complex chromosomal re-arrangement which we observed in nine patients with myeloid malignancies and in two cases with ALL. Chromothripsis describes chromosomal rearrangements in which one or a few chromosomes undergo an initial fragmentation into many pieces and then get stitched back together in random order by DNA repair processes (113). This generates a highly re-arranged chromosome or chromosome fragment from a single catastrophic event resulting in deletions and amplifications which can only be detected by array-based CGH or whole genome sequencing methods. Chromothripsis has only rarely been described in haematological malignancies (114-116), that may relate to the fact that oaCGH analysis has only been scarcely used in a clinical setting. In several cancer types chromothripsis is associated with poor prognosis although this has not been generally established especially since some cancers may obtain additional aberrations that may out-weigh the negative consequence of chromothripsis (117). More cases need to be examined to establish the incidence and prognostic consequences of chromothripsis in haematological malignancies. Karyotyping analysis might give clues to a possible occurrence of chromothripsis by the advent of homogenously stained regions.
A limitation of aCGH analysis is that it can not detect balanced structural re-arrangements, such as translocations or inversions, which also are very important aberrations for diagnostics and prognostication in haematological malignancies (2). In certain cases with aberrant ploidy and in cases with several sub-clones it can be difficult to correctly interpret the oaCGH analysis result. In other situations where oaCGH analysis has uncovered several unbalanced alterations it may not be apparent how these are structurally organized within the cells chromosomal complement. In all these situations either karyotyping or metaphase FISH analysis is important to complement the oaCGH analysis as they are both single-cell clonal analyses. For example, in a patient with a complex three-way translocation t(2;11;5)(p21.3;q13.5;q23.2) and an additional submicroscopic del(11)(p14.3pq14.3) we were able to show by metaphase FISH analysis that the submicroscopic deletion at 11p14.3 was on the same aberrant chromosome 11 homologue but distant from the breakpoints on 11q involved in the three-way translocation (17). In another example, oaCGH analysis detected two submicroscopic deletions in close proximity at 20q (Figure 3A) while metaphase FISH analysis established that the two deletions indeed were on the same chromosome homologue. In many aCGH studies on solid tumors and even in haematological malignancies metaphase FISH analysis has not been performed although the specific copy number findings often has been confirmed by interphase nuclei FISH or by MLPA. Taken together, if oaCGH analysis is not complemented by karyotyping and/or molecular cytogenetics this may result in an incomplete interpretation of the genomic complement.
Another limitation of oaCGH analysis is a relatively low sensitivity although it varies considerably with respect to the size of aberrations to be detected. The median proportion of cells with karyotypic aberrations that could be detected by different oligo-based microarrays is 2-30% (21, 118). Herein we showed that a 0.16-Mb submicroscopic deletion could be detected in a case with approximately 8% abnormal cells provided that normal tissue is examined as well. In this study in 7% (5/76) of all cases with karyotypic abnormalities oaCGH analysis failed to detect the by-karyotyping-identified abnormalities; primarily due to balanced translocations or marker chromosomes with a low abnormality frequency. Conversely, in 93% of cases oaCGH analysis revealed alterations that in the majority of cases were located in regions of clinical relevance as described above.
Lack of surplus sample material for oaCGH analysis is another type of limitation although only a small amount of DNA is requierd for analysis. In the present study we intended to perform oaCGH analysis in eight additional cases as an adjunct but there was no sample material left. Although whole genome-amplification of cells from fixed preparations is a possibility limitations may apply to this approach and was not used in the present study (119, 120).
Novel somatic chromosomal lesions detected by array technologies should be confirmed by testing germ-line DNA, but this requirement may depend on the size and location of the aberration, and if metaphase cytogenetics are informative. In the present study in cases where it was relevant to examine for CNVs we performed this by comparing the oaCGH results from the bone marrow with oaCGH results from skin biopsies or from CD3+ purified cells from peripheral blood. It is not convenient in a clinical setting to obtain a skin biopsy or obtain peripheral blood sample for CD3+ separation from all referred cases to be used as reference DNA, although this is optimal from a research point of view. In our experience, it is feasible on a case-by-case basis to obtain skin or PB to be analyzed by oaCGH analysis with the same reference DNA as in the original sample (Figure 2). PHA-stimulated culturing is used in a similar way on a case-by-case basis if karyotyping reveals novel or unexpected chromosmal aberrations to determine if they are acquired or congenital. Depending on the clinical situation another possibility is to wait until the patient is in complete cytogenetic remission and use this as a surrogate germ-line.
This study was designed to evaulate the feasibility of oaCGH analysis on BM aspirates from haematological malignancies on a routine basis rather than an attempt to identify frequency of recurrent aberrations in specific haematological entities. On the whole, in a pragmatic clinical setting we found that oaCGH analysis is an effective genomic screening method to detect submicroscopic and cryptic aberrations in regions of clinical importance that was not uncovered by karyotyping or molecular cytogenetics. It can determine re-arrangement breakpoints in unbalanced cases with high precision at the single-gene level and it can analyze for genomic imbalances in thousands of regions in a single experiment, which may be difficult or impractical to perform with a great number locus-specific FISH probes due to timing and costs. Only in very few cases with a simple or complex karyotype oaCGH analysis showed a normal result (3%, 3/104) thereby failing to detect the by-karyotyping-obtained findings.
From the described findings it is apparent that in cases where karyotyping identified unbalanced re-arrangements, such as marker chromosome(s), hsr, or complex karyotypes, oaCGH analysis, in addition to confirming these aberrations in the majority of cases, conveyed a higher genomic precision, as well as was able to uncover additional cryptic or submicroscopic alterations. In cases with an insufficient number of metaphases available for cytogenetic analysis oaCGH analysis detected aberrations in abnormal cells that were not dividing. In situations of small tumor biopsies or cases with fibrotic bone marrow biopsies (106) oaCGH analysis may be a valuable substitution to lacking cytogenetic results. In cases with normal karyotypes we identified cryptic or submicroscopic aberrations in regions of clinical importance in agreement with other studies (22, 105). Algorithms must be developed to help clarify when to use oaCGH as an adjunct tool in combination with advanced molecular cytogenetic methods (13). It is important to emphazise that oaCGH should not replace karyotyping or FISH analyses but instead be used in various combinations in a cost-effective manner also taking into account the limitations of oaCGH. In cases where specific abnormalities within a complex or a non-complex karyotype could be accurately detected and monotoring markers selected by karyotyping and/or FISH, oaCGH analysis may not be routinely needed.
To confirm and extend the presented findings more cases clearly need to be examined by oaCGH analysis in combination with karyotyping. As oaCGH analysis becomes more generally used new sub-groups may emerge, which could help in fine-tuning specific risk groups and provide better risk-adapted therapies. Karyotyping as a clinical tool has, since its birth in the late 1950's, and together with advanced molecular multi-color assays in the late 1990's, been a standard method to detect known recurrent abnormalities. It has also at the same time been a mean to idenitify novel aberrations while being used in a clinical setting. A similar scenario may be envisioned for oaCGH analysis in the future.
Conclusion
I find that oaCGH analysis is a valuable asset in the diagnostic flow in clinical cytogenetics and recommend that it becomes an integrated part of routine cytogenetic diagnostics in haematological malignancies. Data indicate that information from karyotyping and oaCGH analysis are complementary, and that a combined usage maximizes the detection rate of genomic abnormalities in these diseases in a timely manner. Due to limited laboratory and health care resources clinical application of oaCGH analysis is not yet a routine procedure in the common clinical haematological setting. Accordingly, its clinical application needs to be decided carefully with respect to reasonable guidelines and how it can be implemented in future treatment and related protocols. As array-based characterization becomes more commonly used new sub-groups may emerge within the various haematological malignancies providing better means for optimization of treatment protocols and prognostic groups.
Acknowledgements
The biotechnologists Kirsten V. Madsen, Bente Madsen, Pia Kristensen, Majbritt D. Jensen and Mette Rasmussen are greatly thanked for their excellent technical assistance with conventional and molecular cytogenetics analyses, and additionally, Bente Madsen and Pia Kristensen for their excellent technical assistance also being able to perform oaCGH analysis. The clinicians at Department of Hematology, Aarhus University Hospital and in particular consultant Ingolf Mølle, M.D., is greatly thanked for referring patients and providing clinical details. The Danish Cancer Society supported the study.
Footnotes
Conflicts of Interest
The Author has no conflicts of interest to declare.
- Received August 12, 2015.
- Revision received September 11, 2015.
- Accepted September 30, 2015.
- Copyright© 2015, International Institute of Anticancer Research (Dr. John G. Delinasios), All rights reserved
References
In this issue


Jump to section
Related Articles
Cited By...
- No citing articles found.