


Abstract
Backgroud/Aim: Triple-negative breast cancer (TNBC) frequently metastasizes to the brain (BrM). However, genes responsible for BrM of TNBC are yet to be identified. Materials and Methods: Gene expression profiling of TNBC and BrM was conducted, and studies with cultured cells in vitro were performed to verify functions of genes identified in these analyses. Results: According to gene expression analyses of TNBC and BrM, periplakin (PPL) and mitogen-activated protein kinase 13 (MAPK13) were chosen for further investigations. PPL and MAPK13 were highly expressed in TNBC compared to BrM. While silencing of either PPL or MAPK13 in TNBC cells increased cell growth and reduced cell motility, overexpression of either PPL or MAPK13 in BrM cells, retarded growth rates and facilitated cell motility. Conclusion: Gene expression patterns in TNBC and BrM reflect cancer cell growth in regions of metastasis.
Biomedical attempts to understand the nature of breast cancer metastases have long been performed (1-8). Intensive efforts have revealed that breast cancer cells frequently metastasize to the lymph nodes, lung, liver, bone, and brain (9), thereby creating need for advances in therapeutic approaches (3, 10-12). However, treatment options for brain metastasis (BrM) of breast cancer are still limited. BrM of breast cancer can be treated by surgery, radiosurgery, and whole-brain radiotherapy (11). In addition, chemotherapeutic approaches can be taken, while the blood-brain barrier is an obstacle to chemotherapy targeting BrM of breast cancer (3, 13).
Breast cancer exists in three molecular subtypes, hormone-positive, human epidermal growth factor receptor 2 (HER2)-positive and triple-negative (2, 7, 8, 14). Triple-negative breast cancer (TNBC) is defined by estrogen receptor-negative, progesterone receptor-negative and HER2-negative expression patterns (2, 9, 14, 15). While TNBC is only identified in approximately 10-15% of patients with breast cancer, it is more aggressive than other subtypes of breast cancer, metastasizes frequently to the brain, and is associated with poor outcomes (9, 10, 15-19). Consequently, BrM of TNBC increases mortality (9, 10, 14, 16-21).
Recent research has investigated genes involved in metastasis of breast cancer (1, 8, 20, 22, 23). However, genes associated with BrM of TNBC are yet to be elucidated. In this study, we analyzed gene expression profiles in TNBC and BrM, and identified several genes significantly up- and down-regulated in BrM compared to TNBC. Expression levels of two genes, periplakin (PPL) and mitogen-activated protein kinase 13 (MAPK13), were uniquely altered in gene expression, ontology and pathway analyses, and were further verified in cultured cells with gain-of-function and loss-of-function approaches. Overall, our investigations demonstrate that TNBC cells lose cell motility but regain growth ability in the brain.
Materials and Methods
Gene expression profiling. Four TNBC and three BrM tissues from patients were used after approval of the Institutional Review Boards in both Seoul National University Hospital (H-0606-021-175) and Kyung Hee University (KHUASP(SE)-12-035). RNAs from either TNBC tissues or BrM tissues from patients were isolated using Trizol reagent. cRNAs were synthesized and hybridized onto Human HT12 genome-wide expression profiling chip (Illumina, San Diego, CA, USA). Data analyses were performed in the GenomeStudio program. Detection of a p-value greater than 0.01 was considered meaningful for analyses, an expression level greater than 1 was adjusted to 1, and both fold changes over 5 and delta difference over 50 with a t-test p-value lower than 0.05 were selected. A heat-map was generated for the expression patterns of significant genes. Hierarchical trees were produced by Pearson correlation. A volcano plot was generated by gene expression levels from the Z-scores. Analyses were conducted in Genome Studio software (Illumina) and images were produced in Multiexperimental Viewer (Boston, MA, USA). Gene ontology was analyzed using the gene ontology tree machine. Pathway analysis was conducted based on Kyoto encyclopedia of genes and genomes (KEGG) pathway mapping tool (genome.jp/keg/pathway.html).
Cell culture. MDA-MB-231 cells, widely used for TNBC studies, were obtained from the American Type Culture Collection (ATCC) (Manassas, VA, USA) and maintained in Dulbecco’s Modified Eagle’s Medium (DMEM) supplemented with 10% fetal bovine serum and 1% antibiotics. HCC-38, HCC-1395 and HCC-70 cells, defined as TNBC cell lines, were obtained from the Seoul National University Cell Bank (Seoul, Korea) and cultured in Roswell Park Memorial Institute Medium-1640 (RPMI-1640) supplemented with 10% fetal bovine serum and 1% antibiotics. Hs578T cells from Seoul National University Cell Bank were cultured in DMEM. GBL-60 BrM cells were isolated from BrM lesion of TNBC and maintained in DMEM supplemented with 10% fetal bovine serum and 1% antibiotics. For silencing strategies, siRNAs for PPL and MAPK13 were obtained from Santa Cruz BioTech (Santa Cruz, CA, USA). Negative control siRNA (AllStars Negative control) was purchased from Qiagen (Düsseldorf, Germany). For inducing overexpression, BamHI/EcoRI fragment of either full length PPL or MAPK13 was amplified with conventional polymerase chain reaction (PCR) and inserted into pcDNA3.1(+) plasmid (Calsbad, CA, USA). Transient transfections were performed using Lipofectamine mixture with plasmids or siRNAs.
RNA and protein assays. RNAs from patients’ tissues and cultured cells were isolated using Trizol (Invitrogen, Calsbad, CA, USA). cDNA was synthesized and subjected to real-time PCR. Primers used were as follows: PPL: forward primer: 5’-AGGAGACAGACAG CCTCAGC-3’, reverse primer: 5’-GGCTTCTCCTTCCATTCTCC-3’, MAPK13: forward primer: 5’-GGGATGGAGTTCAGTGAGGA-3’, reverse primer: 5’-TCACCACGTAGCCAGTCATC-3’, Glyceraldehyde 3-phosphate dehydrogenase (GAPDH): forward primer: 5’-AATCCCATCACCATCTTCCA-3’, reverse primer: 5’-TGGACTC CACGACGTACTCA-3’. Cells were lysed with RIPA buffer, and 30 μg of protein were run on 8% to 12% sodium dodecyl sulfate polyacrylamide gel electrophoresis (SDS-PAGE) and transferred to nitrocellulose membranes. Antibodies for PPL (Abcam, Cat # ab72422, Cambridge, UK) and MAPK13 (Abnova, Cat # PAB2787, Taipei City, Taiwan) were diluted at 1:500 to 1:1,000. Antibody against actin was obtained from Cell Signaling (Danvers, MA, USA) and used at 1:1,000 dilution.
Cell growth, migration, invasion, anchorage-independent growth assays. Cell numbers were measured for four days, and the doubling time was calculated using the Doubling Time web tool (www.doubling-time.com/compute.php). For cell migration, cells cultured in plates were scratched and cultured for 24 h. Migrated cells were counted after randomly choosing four fields in scratched regions. For invasion assays, two-chamber assays were conducted. Cells were seeded in top chambers pre-coated with matrigel (San Jose, CA, USA) and cultured with 1% serum-enriched medium. The bottom chambers were filled with 10% serum-enriched medium. Twenty four hours after incubation, the top chambers were stained with crystal violet, and invading cells were counted. For anchorage-independent growth assays, cells were cultured in soft agar for 15 days. Colonies were stained with crystal violet and then counted. All experiments were performed in triplicate and repeated three times. The t-test was applied to analyze statistical significances. p-Values lower than 0.05 were considered statistically significant.
Results
Gene expression patterns between TNBC and BrM. To examine gene expression patterns in TNBC and BrM, gene expression arrays were performed. While gene expression patterns in TNBC were likely to be slightly correlated with those in BrM, expression patterns of several genes were different in TNBC compared to BrM (Figure 1A and B). We further found that approximately 1% out of a total 16,402 genes was significantly differently expressed in TNBC compared to BrM (Table I). In brief, 45 and 74 genes were down-regulated and up-regulated, respectively, in BrM compared to TNBC.
Gene ontology analyses showed that 10 gene ontology categories were altered in BrM compared to TNBC (Table II). Pathway analyses showed that six pathways were most significantly altered in BrM compared to TNBC (Table III). Interestingly, expression of genes associated with cell-to-cell interaction was found to be altered in both pathway and ontology analyses. Overall, mRNA expression levels of PPL and MAPK13 were significantly down-regulated in BrM compared to TNBC, which was also shown in either gene ontology or pathway analyses (Figure 1C).
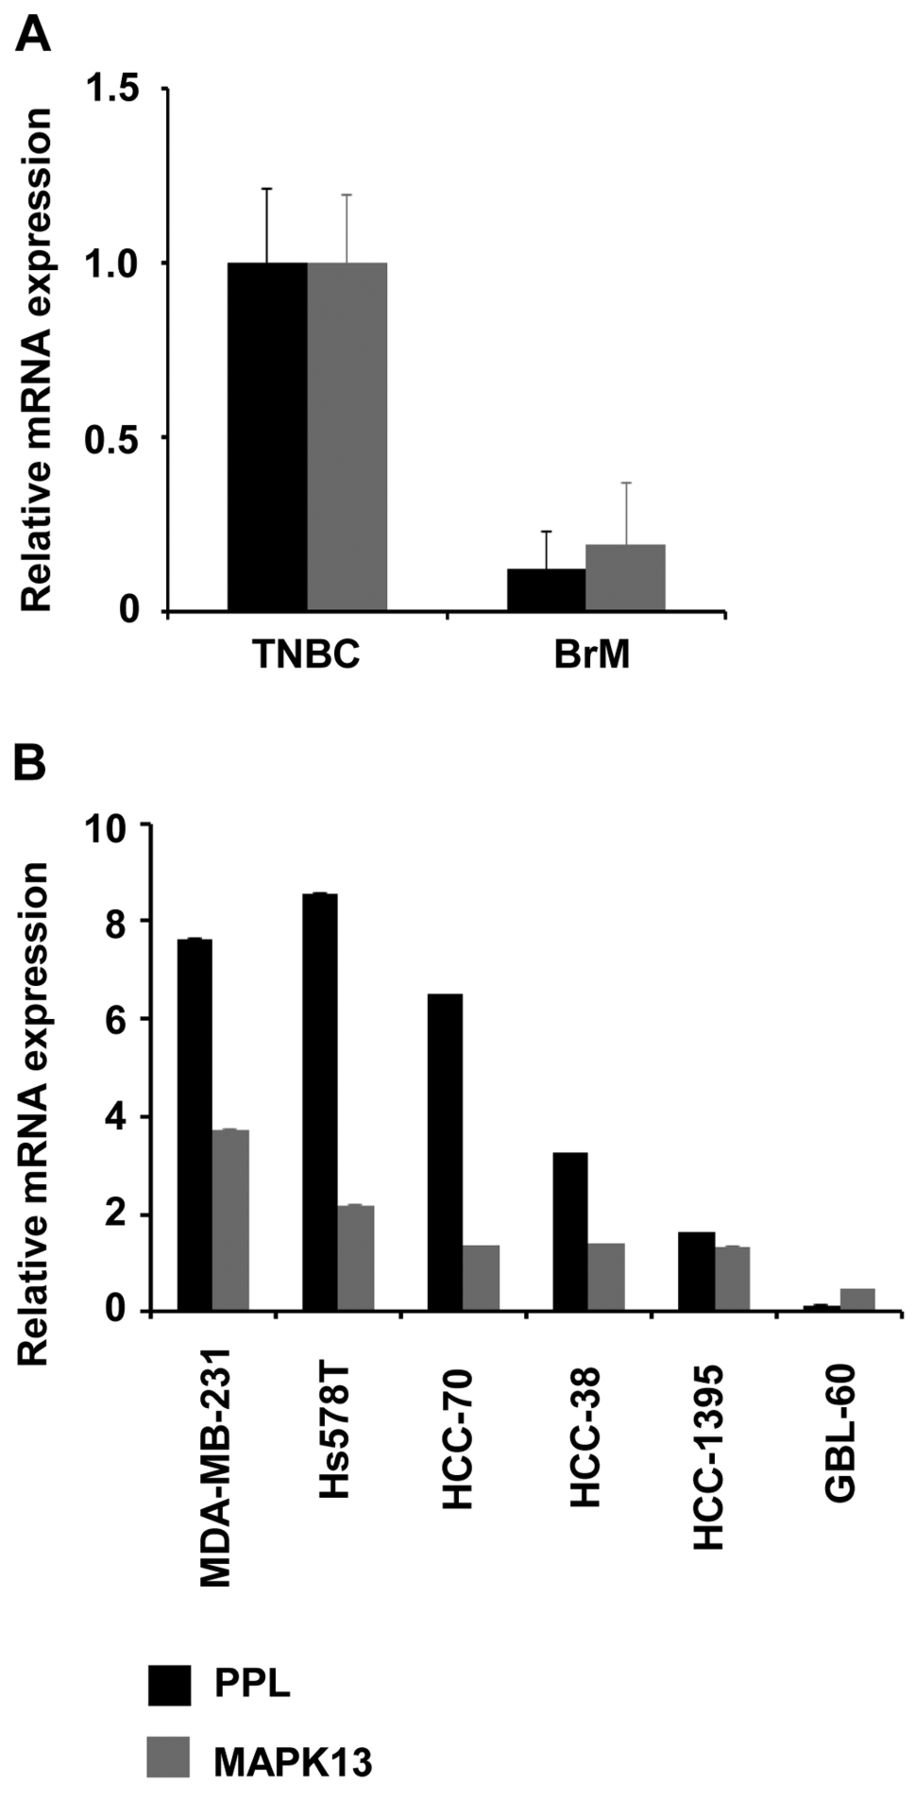
Expression levels of PPL and MAPK13 in TNBC and BrM. Thus, we further confirmed mRNA expression levels of PPL and MAPK13 in tissues from TNBC and BrM using real-time PCR. Consistent with gene expression array data, mRNA expression levels of PPL and MAPK13 were reduced in BrM compared to TNBC (Figure 2A). Thus, we further examined mRNA expression levels of PPL and MAPK13 in GBL-60 BrM cell line isolated from the brain tumor and TNBC cell lines MDA-MB-231, Hs578T, HCC-70, HCC-38 and HCC-1395. In line with gene expression array data, expression levels of PPL and MAPK13 were higher in MDA-MB-231, Hs578T, HCC-70, HCC-38 and HCC-1395 than in GBL-60 (Figure 2B).

Different gene expression patterns in triple-negative breast cancer (TNBC) and brain-metastatic cancer (BrM). A: Heat-map shows genes differentially expressed in TNBC and BrM. B: Volcano plot presents differential expression patterns of genes in BrM and TNBC. Genes up-/downregulated by 5-fold are colored in red. C: Relative expression levels of PPL (top) and MAPK13 (bottom) in TNBC and BrM.
Genes down/up-regulated in brain-metastatic cancer (BrM) compared to triple-negative breast cancer (TNBC).
PPL and MAPK13 facilitate TNBC cell growth. Thus, we further examined whether silencing of either PPL or MAPK13 affects the growth of TNBC cells. When expression of either PPL or MAPK13 in MDA-MB-231, Hs578T and HCC-70 cells were knocked-down with appropriate siRNAs, the growth rates of these cells were higher than those of cells where control siRNA was transfected (Figure 3A and C). In detail, whereas the doubling time of MDA-MB-231 cells was 41.81 h, in cells where either PPL or MAPK13 was silenced, the doubling time became 34.76 and 32.58 h, respectively. The doubling time of Hs578T cells was 38.94 h, while PPL and MAPK13 silencing led to times of 33.34 and 33 h, respectively. In the case of HCC-70 cells, control, PPL or MAPK13 siRNA led to 29.46, 27.73 and 27.05 h, respectively, for the doubling time. Conversely, when overexpression of PPL or MAPK13 was induced in GBL-60 cells, the doubling time (31.98 h) was extended to 40.16 h with PPL and 42.05 h with MAPK13, respectively (Figure 3B and C). Therefore, our data indicate that altered gene expression of either PPL or MAPK13 may affect TNBC cell growth rate.
Ontology of genes differentially expressed in brain-metastatic cancer (BrM) compared to triple-negative breast cancer (TNBC).
Pathway analysis of genes differentially regulated in brain-metastatic cancer (BrM) compared to triple-negative breast cancer (TNBC).
To examine whether PPL and MAPK13 affect metastatic growth ability, we performed anchorage-independent growth assays. Silencing of either PPL or MAPK13 increased colony numbers in TNBC cell lines MDA-MB-231, Hs578T and HCC-70, whereas overexpression of either PPL or MAPK13 reduced colony formation in GBL-60 cells (Figure 3D).
PPL and MAPK13 repress TNBC cell motility. We next examined whether silencing of PPL and MAPK13 affects cell migration ability. In MDA-MB-231, Hs578T and HCC-70 cells, silencing of either PPL or MAPK13 reduced cell migration rates (Figure 4A). We also found that silencing of either PPL or MAPK13 retarded invasiveness of MDA-MB-231, Hs578T and HCC-70 cells (Figure 4B). However, overexpression of either PPL or MAPK13 in GBL-60 cells facilitated cell migration and invasion (Figure 4A and 4B). Thus, our data further suggest that expression levels of PPL and MAPK13 may determine TNBC cell motility.
Discussion
Metastasis of TNBC to the brain occurs frequently, resulting in a high risk of death (5-8). While genes associated with distant metastases of breast cancer have been investigated, genes involved in metastasis of TNBC to the brain are yet to be reported (6, 9, 14, 22). Our study demonstrates that 119 genes were differentially expressed between TNBC and BrM. Gene ontology and pathway analyses showed that genes involved in cell-to-cell interaction were affected in BrM. These data indicate that TNBC cells have altered expression levels of genes involved in cell-to-cell interaction. From the analyses, we found that expression patterns of two genes, PPL and MAPK13, were significantly different between BrM and TNBC. Moreover, altered expression of either PPL or MAPK13 affected TNBC growth and motility, in vitro.
PPL is crucial for maintaining epithelial cell barriers in normal physiology (24-26). Recent research revealed that cyclin A2-induced up-regulation of PPL is associated with aggressive behavior as well as cisplatin resistance of endometrial cancer cells (27). Likewise, PPL silencing reduced migration and attachment of pharyngeal squamous cancer cells (28). PPL down-regulation was correlated with the progression of esophageal squamous cell carcinoma (29, 30). In our study, PPL silencing reduced TNBC cell migration and invasion, while increasing cell growth even in soft agar. Thus, reduced expression of PPL in BrM suggests that down-regulation of PPL is important for TNBC cell growth in the brain.
MAPK13 was found to promote cholangiocarcinoma cell invasiveness (31), while MAPK13 DNA was found to be methylated in malignant pleural mesothelioma (32). In the highly metastatic TNBC MDA-MB-231 cell line, tissue inhibitor of metallo-proteinase 1 (TIMP-1) overexpression down-regulated MAPK13 expression and led to an inhibition of cell motility (33). Consistent with this, our study also showed that MAPK13 silencing reduced both migration and invasion of TNBC cells. However, MAPK13 silencing induced cell growth even in soft agar, which was similar to the effect of PPL silencing on cell growth. Thus, down-regulation of PLL and MAPK13 in BrM indicates that TNBC cells require cell growth ability rather than motility in the brain. Cellular phenomena resulting from the effect of PPL and MAPK13 are similar to those resulting from the activation of metastasis suppressor genes (34-39). Thus, our data are consistent with the notion that metastasis suppressor genes are down-regulated in metastatic cancer. However, it is yet unclear whether PPL and MAPK13 play the role of metastasis suppressors in TNBC.

Expression of periplakin (PPL) and mitogen-activated protein kinase 13 (MAPK13). A: mRNA levels of PPL and MAPK13 in brain-metastatic cancer (BrM) and triple-negative breast cancer (TNBC). Glyceraldehyde 3-phosphoate dehydrogenase (GAPDH) mRNA was measured as an internal control. Relative values were measured by normalizing 2-ddCT (BrM vs. TNBC). B: mRNA levels of PPL and MAPK13 in TNBC cell lines (MDA-MB-231, Hs578T, HCC-70, HCC-38 and HCC-1395) and BrM cells (GBL-60).

Silencing of either periplakin (PPL) or mitogen-activated protein kinase 13 (MAPK13) facilitates triple-negative breast cancer (TNBC) cell growth. A: Expression of PPL and MAPK13 in different TNBC cells (MDA-MB-231, Hs578T and HCC-70) silenced with control, PPL or MAPK13 siRNA. B: Overexpression of PPL and MAPK13 in GBL-60 cells. Appropriate antibodies were used to detect PPL and MAPK13. Actin was used as an internal control. C: Cell growth rates of MDA-MB-231, HS578T, HCC-70 and GBL-60 cells, where expression of either PPL or MAPK13 was altered. Cell numbers were counted for four days. D: Anchorage-independent cell growth. TNBC and BrM cells where expression of either PPL or MAPK13 was altered were cultured in soft agar. Fifteen days after incubation, plates were stained with crystal violet and colonies were counted. *p-Values less than 0.05 were considered significantly different from the controls.
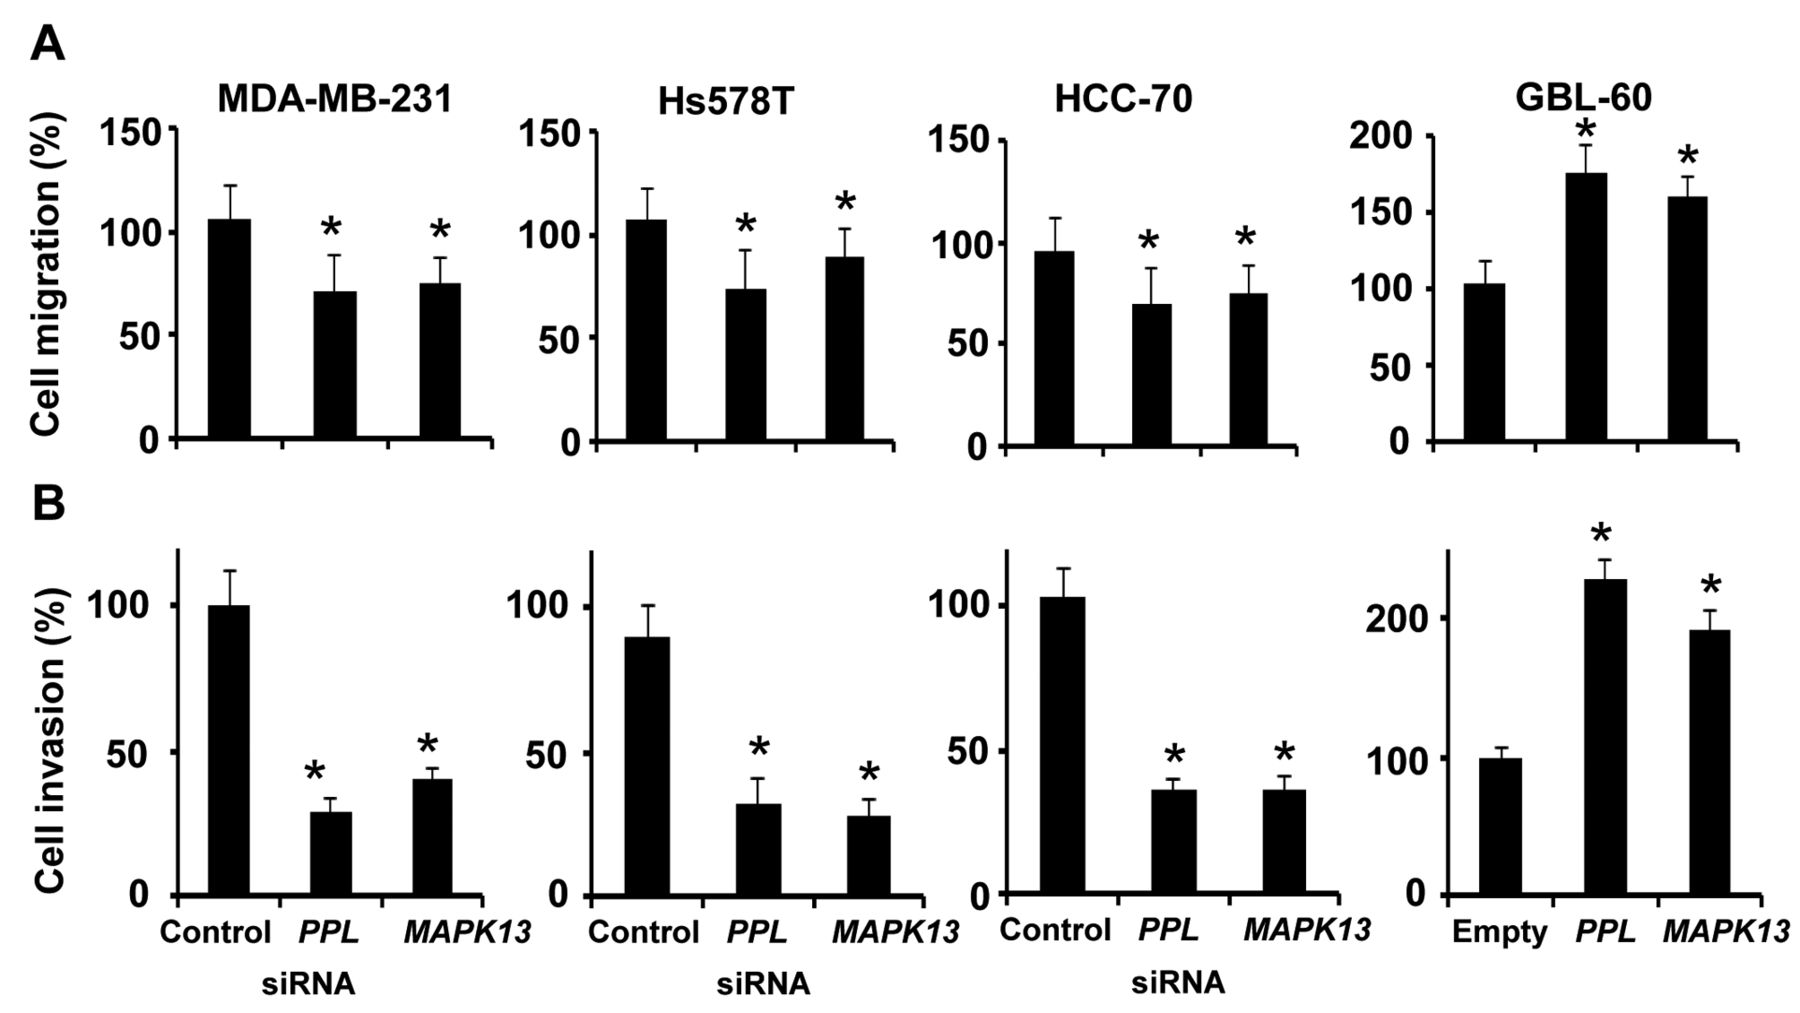
Periplakin (PPL) and mitogen-activated protein kinase 13 (MAPK13) regulate cell motility. A: Migration rates of triple-negative breast cancer (TNBC) and brain-metastatic cancer (BrM) cells where expression of either PPL or MAPK13 was altered. Cell culture plates were scratched and then cells were further cultured for one day. Migrated cells were counted after randomly choosing four fields in scratched regions. B: Invasiveness of TNBC and BrM, where expression of either PPL or MAPK13 was altered. Cells were cultured on top chambers filled with 1% serum and allowed to invade toward the bottom chambers filled with 10% serum. Invaded cells were stained with crystal violet and counted. *p-Values less than 0.05 were considered significantly different from controls.
Overall, TNBC cells may alter gene expression patterns for the growth in the brain. However, it is unclear whether expression patterns of particular genes drive BrM, regardless of breast cancer subtype. Thus, our ongoing studies will strive to identify common gene sets driving BrM. In addition, BrM of TNBC is associated with poor outcomes (10, 16-19, 21, 40). Thus, identifying gene signatures driving TNBC metastasis to the brain will provide knowledge for understanding the nature of BrM, improving diagnostic and therapeutic approaches.
Acknowledgments
This study was supported by a grant from Korean Medicine R&D Project of the Ministry of Health and Welfare (B110043).
Footnotes
-
↵* These Authors contributed equally to this work.
- Received August 25, 2013.
- Revision received October 24, 2013.
- Accepted October 25, 2013.
- Copyright© 2013, International Institute of Anticancer Research (Dr. John G. Delinasios), All rights reserved


